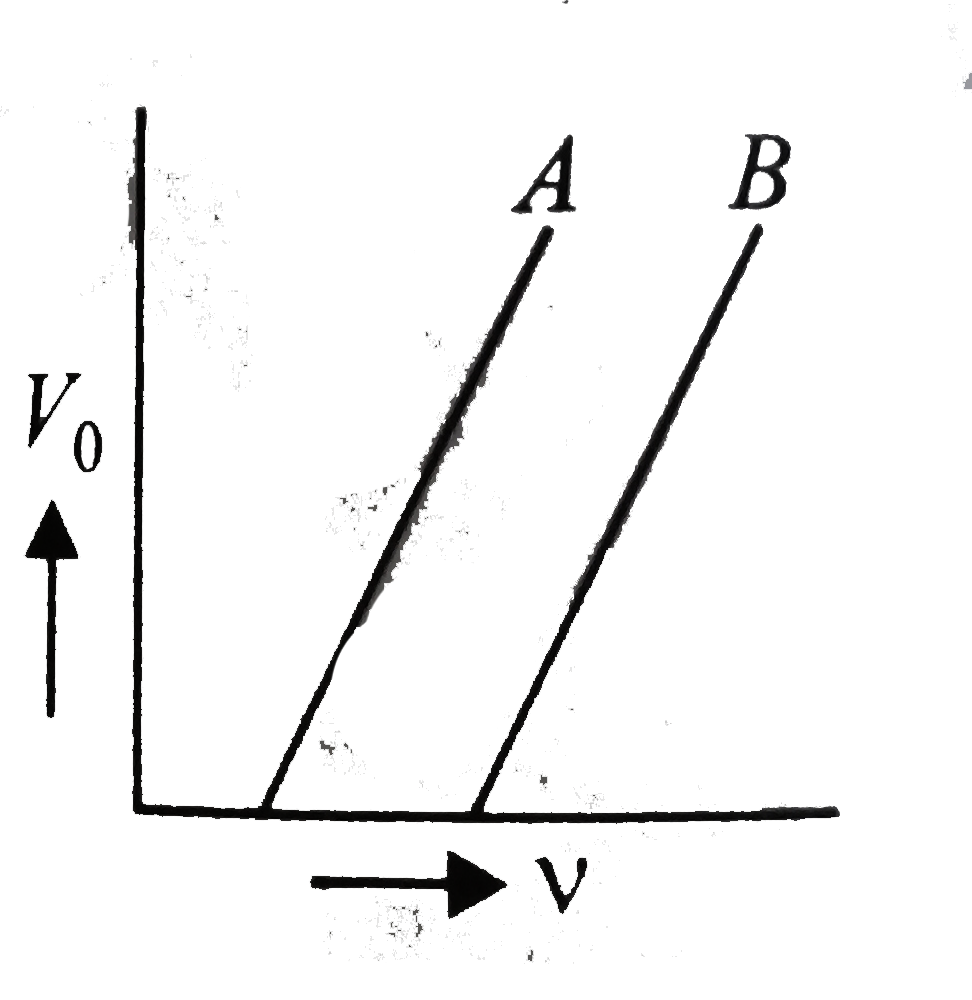
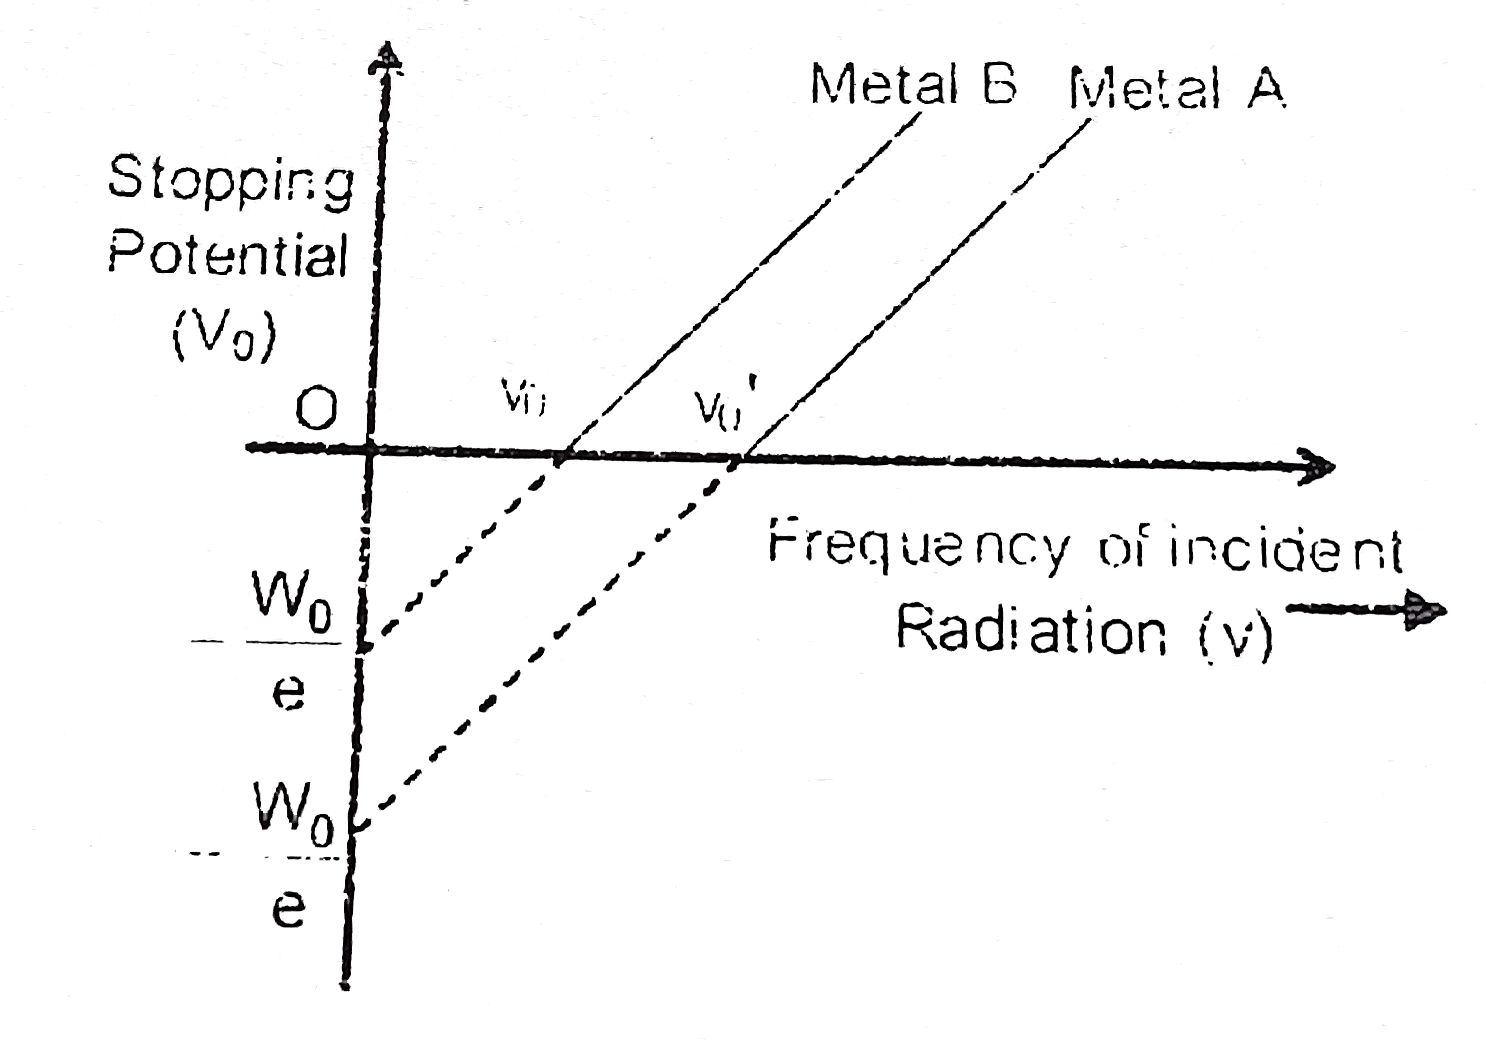
The stopping potential as a function of the frequency of the incident radiation is plotted for two different photoelectric surfaces A and B . The graphs show that work function of A is

less
more
equal
nothing can be said
The correct Answer is:A
(a) : The value of threshold frequency v0 for A is less than for B, hence ϕA<ϕB.
Topper's Solved these Questions
- DUAL NATURE OF RADIATION AND MATTER Book:NCERT FINGERTPS ENGLISHChapter:DUAL NATURE OF RADIATION AND MATTER Exercise:PARTICLE NATURE OF LIGHT : THE PHOTON
Explore 19 Videos
- DUAL NATURE OF RADIATION AND MATTER Book:NCERT FINGERTPS ENGLISHChapter:DUAL NATURE OF RADIATION AND MATTER Exercise:WAVE NATURE OF MATTER
Explore 37 Videos
- DUAL NATURE OF RADIATION AND MATTER Book:NCERT FINGERTPS ENGLISHChapter:DUAL NATURE OF RADIATION AND MATTER Exercise:EXPERIMENTAL STUDY OF PHOTOELECTRIC EFFECT
Explore 11 Videos
- CURRENT ELECTRICITYBook:NCERT FINGERTPS ENGLISHChapter:CURRENT ELECTRICITYExercise:Assertion And Reason
Explore 15 Videos
- ELECTRIC CHARGES AND FIELDSBook:NCERT FINGERTPS ENGLISHChapter:ELECTRIC CHARGES AND FIELDSExercise:Assertion And Reason
Explore 15 Videos
Similar Questions
The emission of electrons from a metal surface exposed rto light radaition of appropriate wavelength is called photoelectroic effect .The emmited electron are called photo=-weklectron work function of threshold energy may be defined as the minimum amount of energy required to ejercted electron from a most surface .According to Einstein
Maximum kinetic energy of ejected electron = Aborbed energy - Work function
12mv2max=h(v)−h(vn)=hv[1λ−01λn]
Where vn and λ0 are thereshold frequency and threshold wavelength respectively
Sopping potential : it is the miximum potential at which the photoelectric current becomes zero if V0 is the stopping potential eV0=h(v−v0)
The stopping potential as a function on electron frtequency is plotted for two photoelectric surface A abd B The graph show that the work function of A is
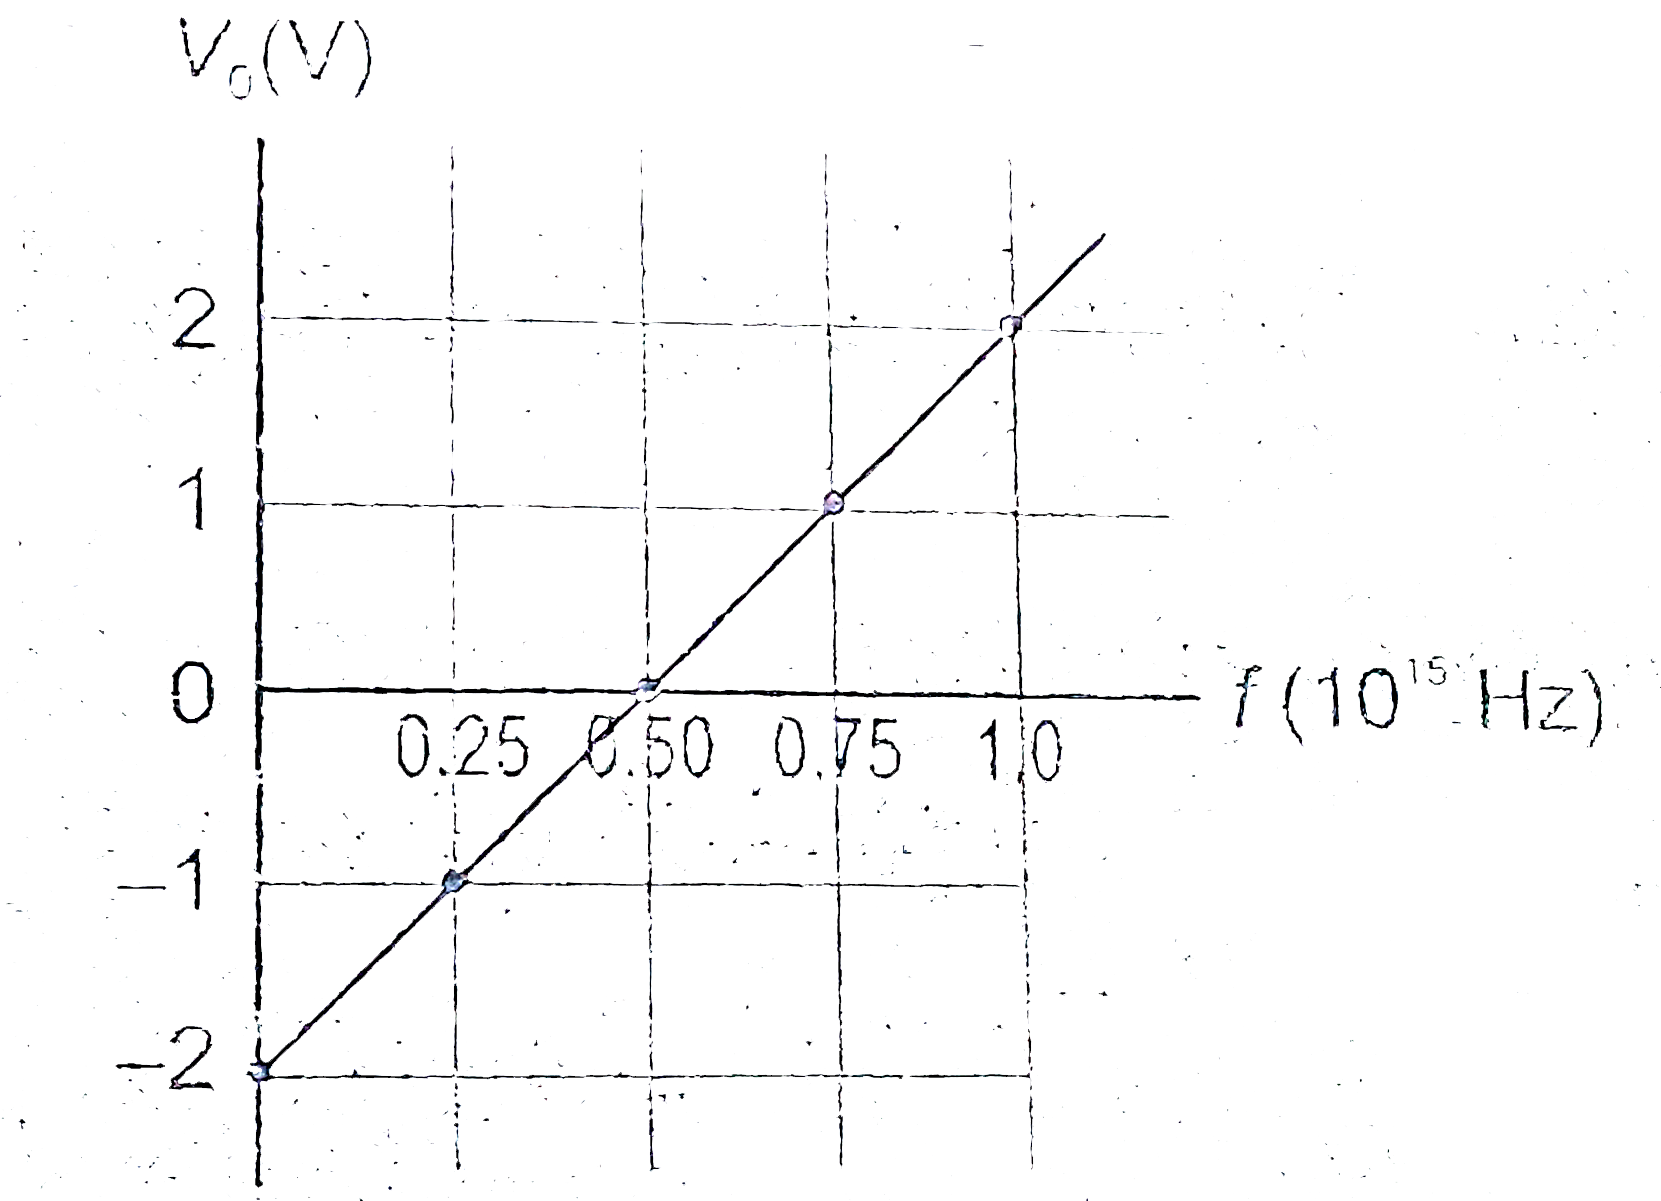
View SolutionThe following figure shows a graph for the stopping potential as a function of the frequency of incident light illuminating a metal surface. Find the photoelectric work function for this surface.
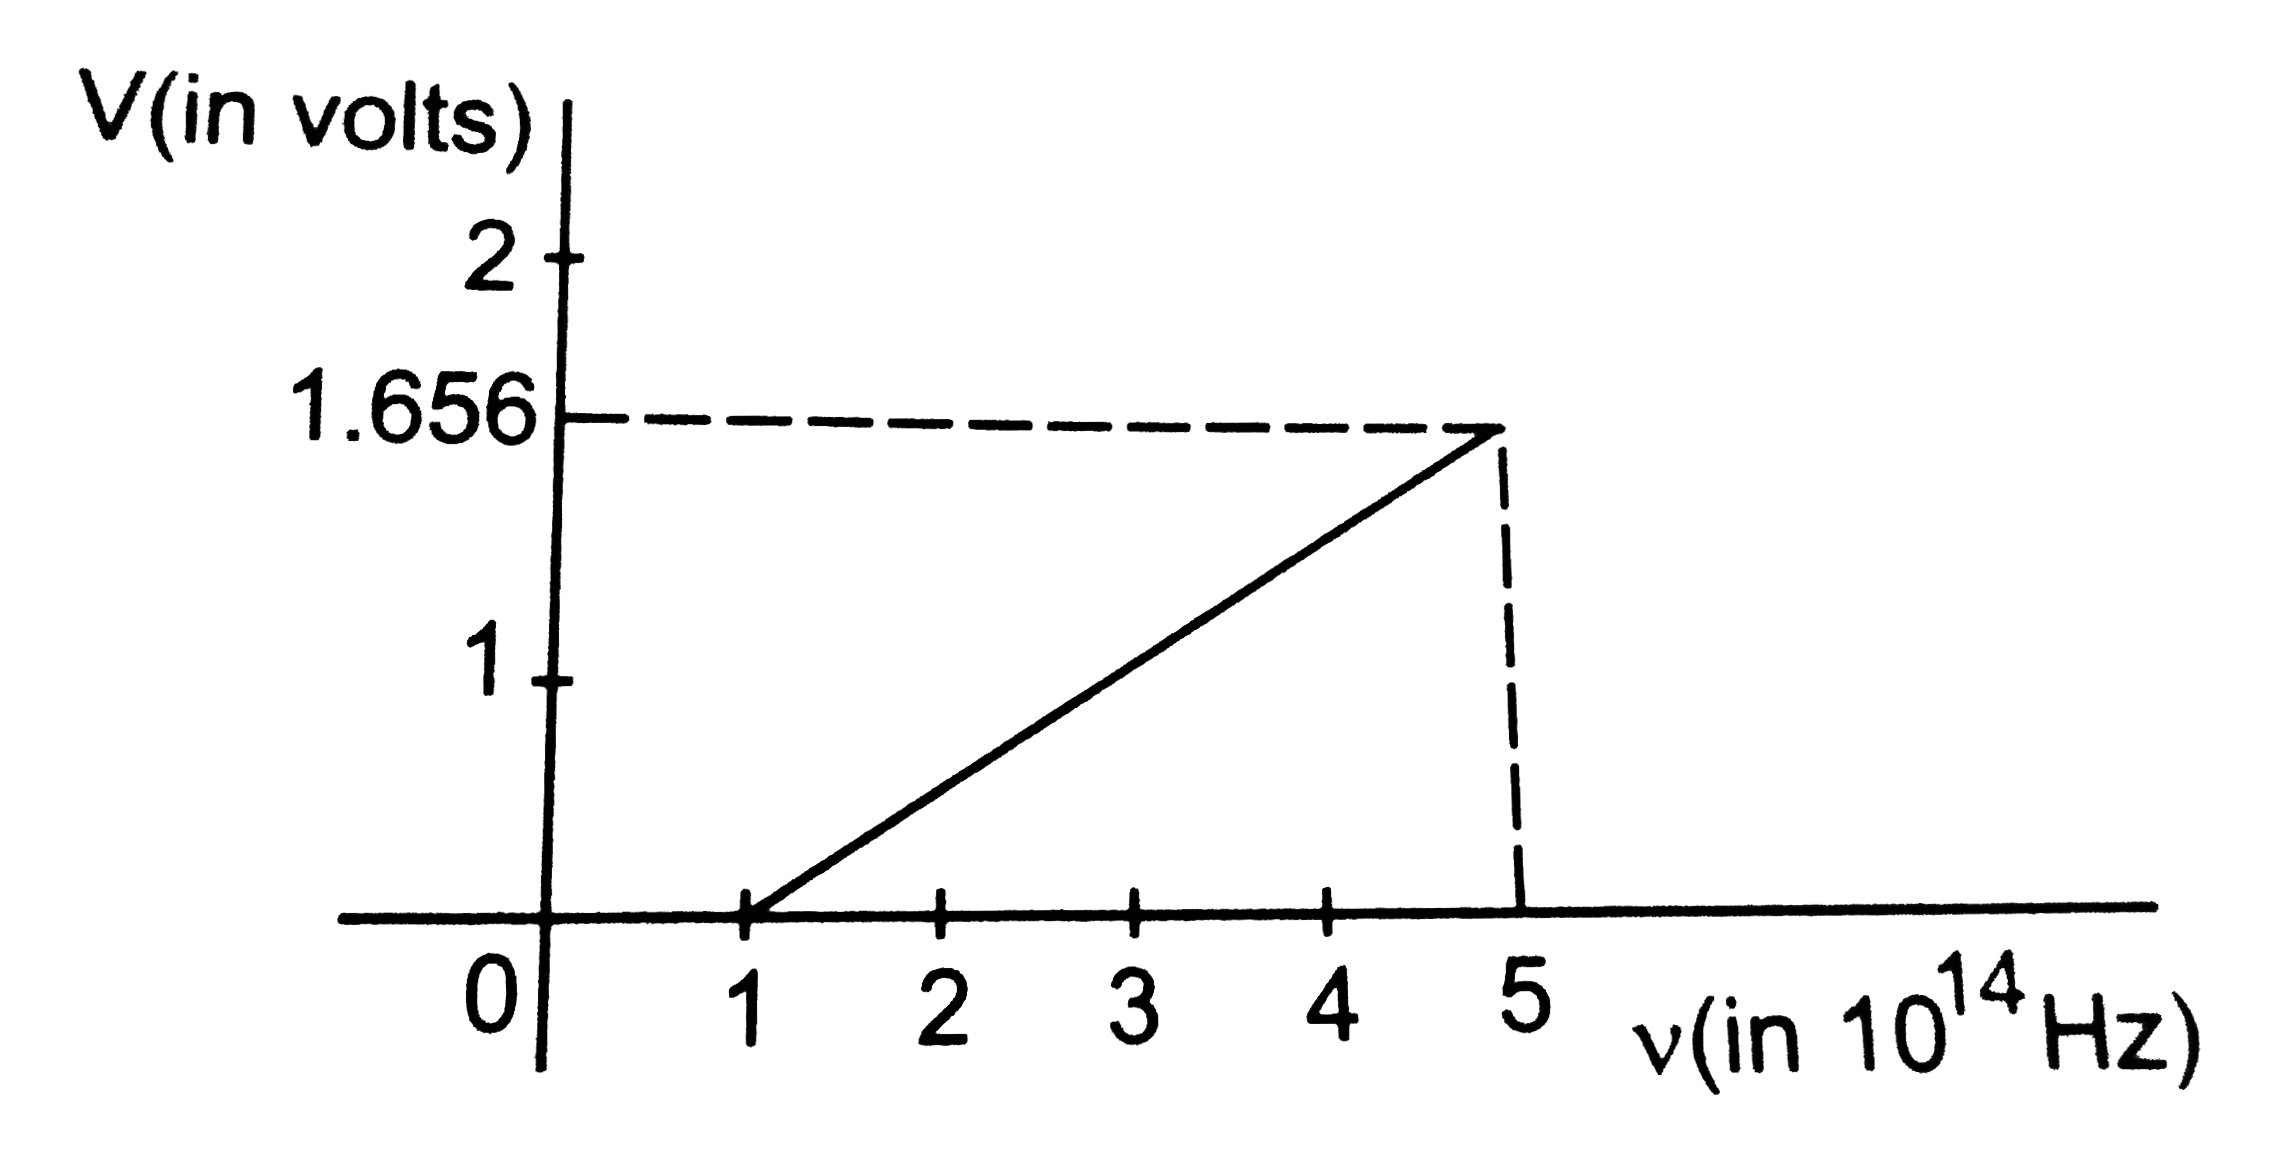
View SolutionThe photoelectric work function
View SolutionIf the frequency of incident light is tripled, the stopping potential will
View SolutionThe slope of the graph drawn between stopping potential and frequency of incident radiation will be
View SolutionPlot a graph showing the variation of stopping potential with the frequency of incident radiation for two different photosensitive having work functions W1andW2(W1>W2) . On what factors does the (i) slope and (ii) intercept of the lines depend ?
View SolutionFigure is the plot of the stopping potential versus the frequency of the light used in an experiment on photoelectric effect. Find (a) the ratio h/e and (b) the work function.
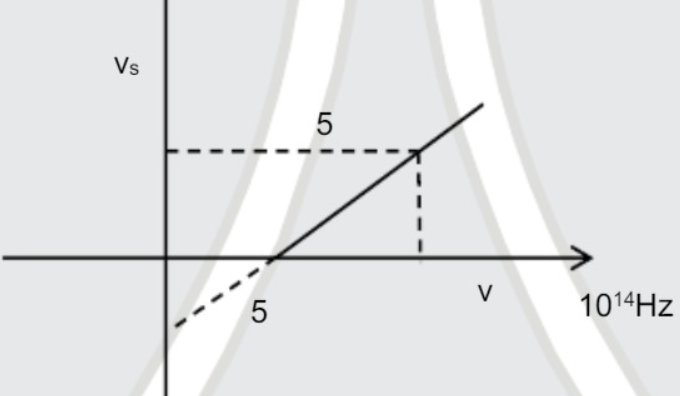
View SolutionGraph between stopping potential and frequency of light as shown find the work function
View SolutionExplain giving reasons for the following :
(a) Photoelectric current in a photocell increases with the increase in intensity of the incident radiation.
(b) The stopping potential V0 varies linearly with the frequency ν of the incident radiation for a given photosensitive surface with the slope remaining the same for different surfaces.
(c) Maximum kinetic energy of the photoelectrons is independent of the intensity of incident radiation.
View SolutionThe graph shows variation of stopping potential V0 versus frequency of incident radiation v for two photosensitive metals A and B. Which of two metals has higher threshold frequency and why?
View Solution

