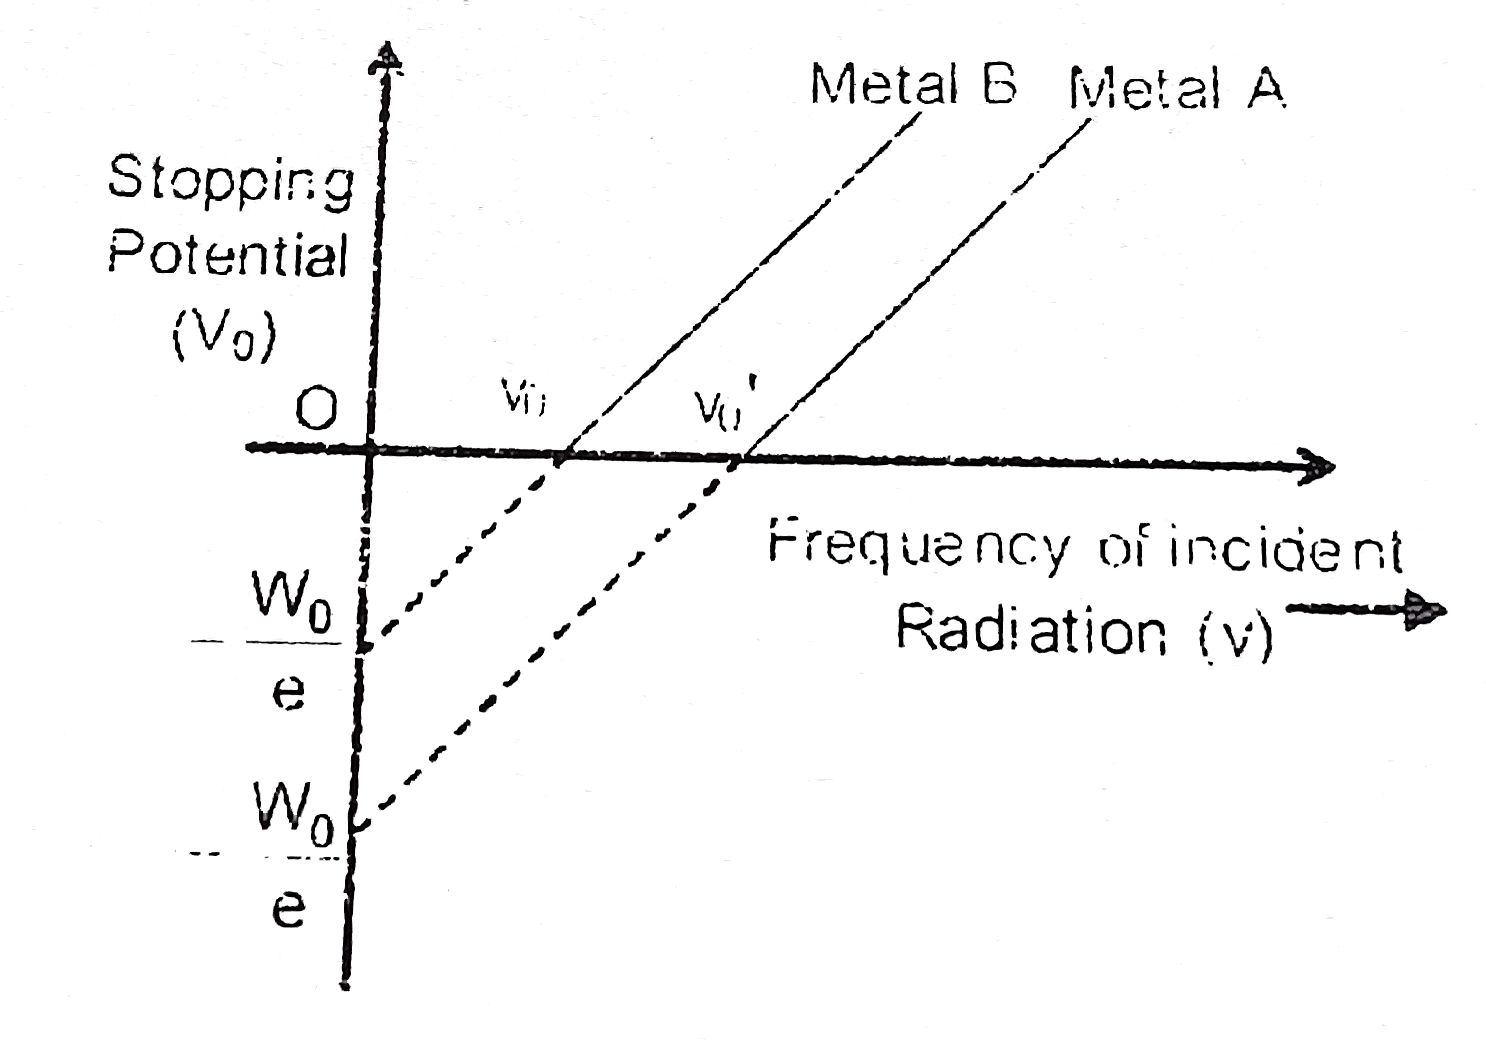
Plot a graph showing the variation of stopping potential with the frequency of incident radiation for two different photosensitive having work functions W1andW2(W1>W2) . On what factors does the (i) slope and (ii) intercept of the lines depend ?
To solve the problem of plotting a graph showing the variation of stopping potential with the frequency of incident radiation for two different photosensitive materials with work functions W1 and W2 (where W1>W2), we can follow these steps:
Step 1: Understand the Photoelectric Effect
The photoelectric effect is described by Einstein's photoelectric equation:
V0=heν−We
where:
- V0 is the stopping potential,
- h is Planck's constant,
- e is the charge of an electron,
- ν is the frequency of the incident radiation,
- W is the work function of the material.
Step 2: Write the Equations for Two Different Work Functions
For the two photosensitive materials, we can write the equations for the stopping potential as follows:
1. For the material with work function W1:
V0=heν−W1e
2. For the material with work function W2:
V0=heν−W2e
Step 3: Identify the Slope and Intercept
From the equations, we can identify:
- The slope of both lines is he.
- The y-intercept for the first line (work function W1) is −W1e.
- The y-intercept for the second line (work function W2) is −W2e.
Step 4: Plot the Graph
1. On the x-axis, plot the frequency ν.
2. On the y-axis, plot the stopping potential V0.
3. Draw two straight lines:
- The first line (for W1) will start lower on the y-axis because W1>W2.
- The second line (for W2) will start higher on the y-axis.
Both lines will have the same slope, indicating that they are parallel.
Step 5: Analyze the Graph
- The slope of the lines is constant and equal to he, which depends on Planck's constant and the charge of an electron.
- The y-intercepts depend on the work functions W1 and W2 of the materials.
Conclusion
- The slope of the graph depends on the constants h and e, and is therefore constant for all such materials.
- The intercepts depend on the respective work functions of the materials used.
The photoelectric effect is described by Einstein's photoelectric equation:
V0=heν−We
where:
- V0 is the stopping potential,
- h is Planck's constant,
- e is the charge of an electron,
- ν is the frequency of the incident radiation,
- W is the work function of the material.
For the two photosensitive materials, we can write the equations for the stopping potential as follows:
1. For the material with work function W1:
V0=heν−W1e
2. For the material with work function W2:
V0=heν−W2e
From the equations, we can identify:
- The slope of both lines is he.
- The y-intercept for the first line (work function W1) is −W1e.
- The y-intercept for the second line (work function W2) is −W2e.
1. On the x-axis, plot the frequency ν.
2. On the y-axis, plot the stopping potential V0.
3. Draw two straight lines:
- The first line (for W1) will start lower on the y-axis because W1>W2.
- The second line (for W2) will start higher on the y-axis.
- The slope of the lines is constant and equal to he, which depends on Planck's constant and the charge of an electron.
- The y-intercepts depend on the work functions W1 and W2 of the materials.
- The slope of the graph depends on the constants h and e, and is therefore constant for all such materials.
- The intercepts depend on the respective work functions of the materials used.
Topper's Solved these Questions
- BOOK - XII BOARD PREVIOUS YEAR PAPER ENGLISHCHAPTER - XII BOARDSEXERCISE - [Set- II]4videos
XII BOARDS
- BOOK - XII BOARD PREVIOUS YEAR PAPER ENGLISHCHAPTER - XII BOARDSEXERCISE - [Set-III]3videos
XII BOARDS
- BOOK - XII BOARD PREVIOUS YEAR PAPER ENGLISHCHAPTER - XII BOARDSEXERCISE - SET-III, DELHI BOARD4videos
XII BOARDS
- BOOK - XII BOARD PREVIOUS YEAR PAPER ENGLISHCHAPTER - SAMPLE PAPER 2019EXERCISE - SECTION D6videos
SAMPLE PAPER 2019
Similar Questions
The graph shows variation of stopping potential V0 versus frequency of incident radiation v for two photosensitive metals A and B. Which of two metals has higher threshold frequency and why?
 View Solution
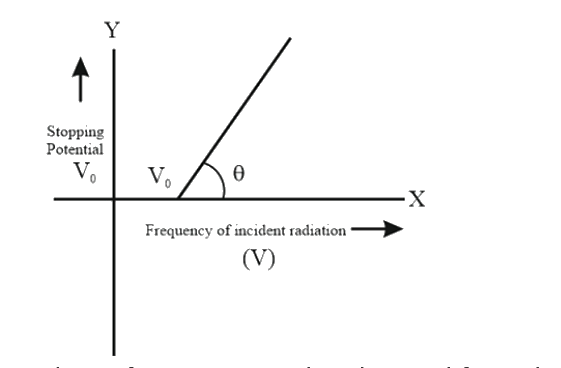
Sketch the graphs, showing the variation of stopping potential Vs with frequency v of the incident radiations for two photosensitive materials A and B having threshold frequencies v0>v'0 respectively.
(i) which of the two metals A or B has higher work function?
(ii) What information do you get from the slope of the graphs?
(iii) What does the value of the intercept of graph A on the potential axis represent?View Solution
Knowledge Check
- Question 1 - Select One
The stopping potential as a function of the frequency of the incident radiation is plotted for two different photoelectric surfaces A and B . The graphs show that work function of A is
 AlessBmoreCequalDnothing can be said
Ultraviolet light is incident on two photosensitive materials having work function W1 and W2(W1>W2). In which case will the kintic enrgy of the emitted electrons be greater? Why?
View SolutionThe graph between frequency of incident radiations and stopping potential for a given photosensitive material as follows.

What information can be obtained from the value of the intercept on the potential axis ?View SolutionIn a series LCR circuit connected to an ac source of variable frequency and voltage v=vmsinωt, draw a plot showing the variation of current (I) with angular frequency (ω) for two different values of resistance R1andR2(R1>R2). Write the condition under which the phenomenon of resonance occurs. For which value of the resistance out of the two curves, a sharper resonance is produced ? Define Q-factor of the circuit and give its significance.
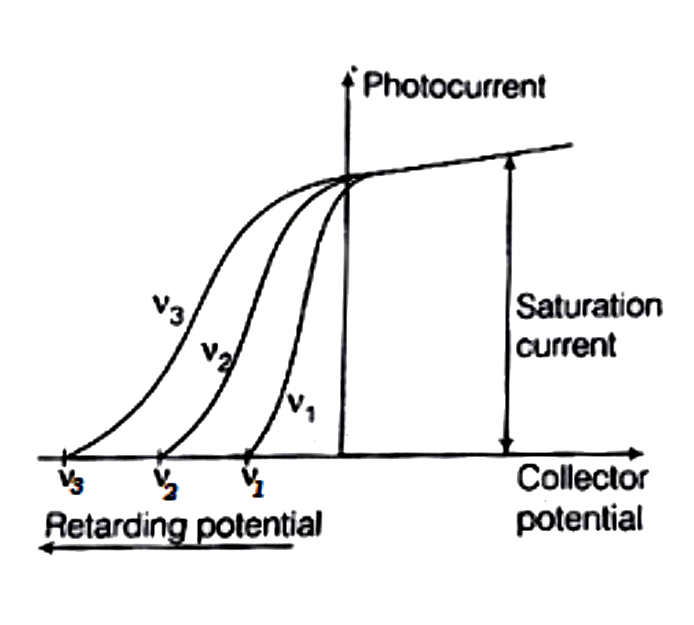
View SolutionThe variation of photocurrent with collector potential for different frequencies of incident radiation v1,v2,v3 is as shown in the the graph , then
 View Solution
(i) Plot a labelled graph of |Vs| where Vs is stopping potential versus frequency f of the incident radiation.
(ii) State how will you use this graph to determine the value of Planck.s constant.View SolutionThe work function of a surface of a photosensitive material is 6.2eV. The wavelength of the incident radiation for which the stopping potential is 5V lies in the
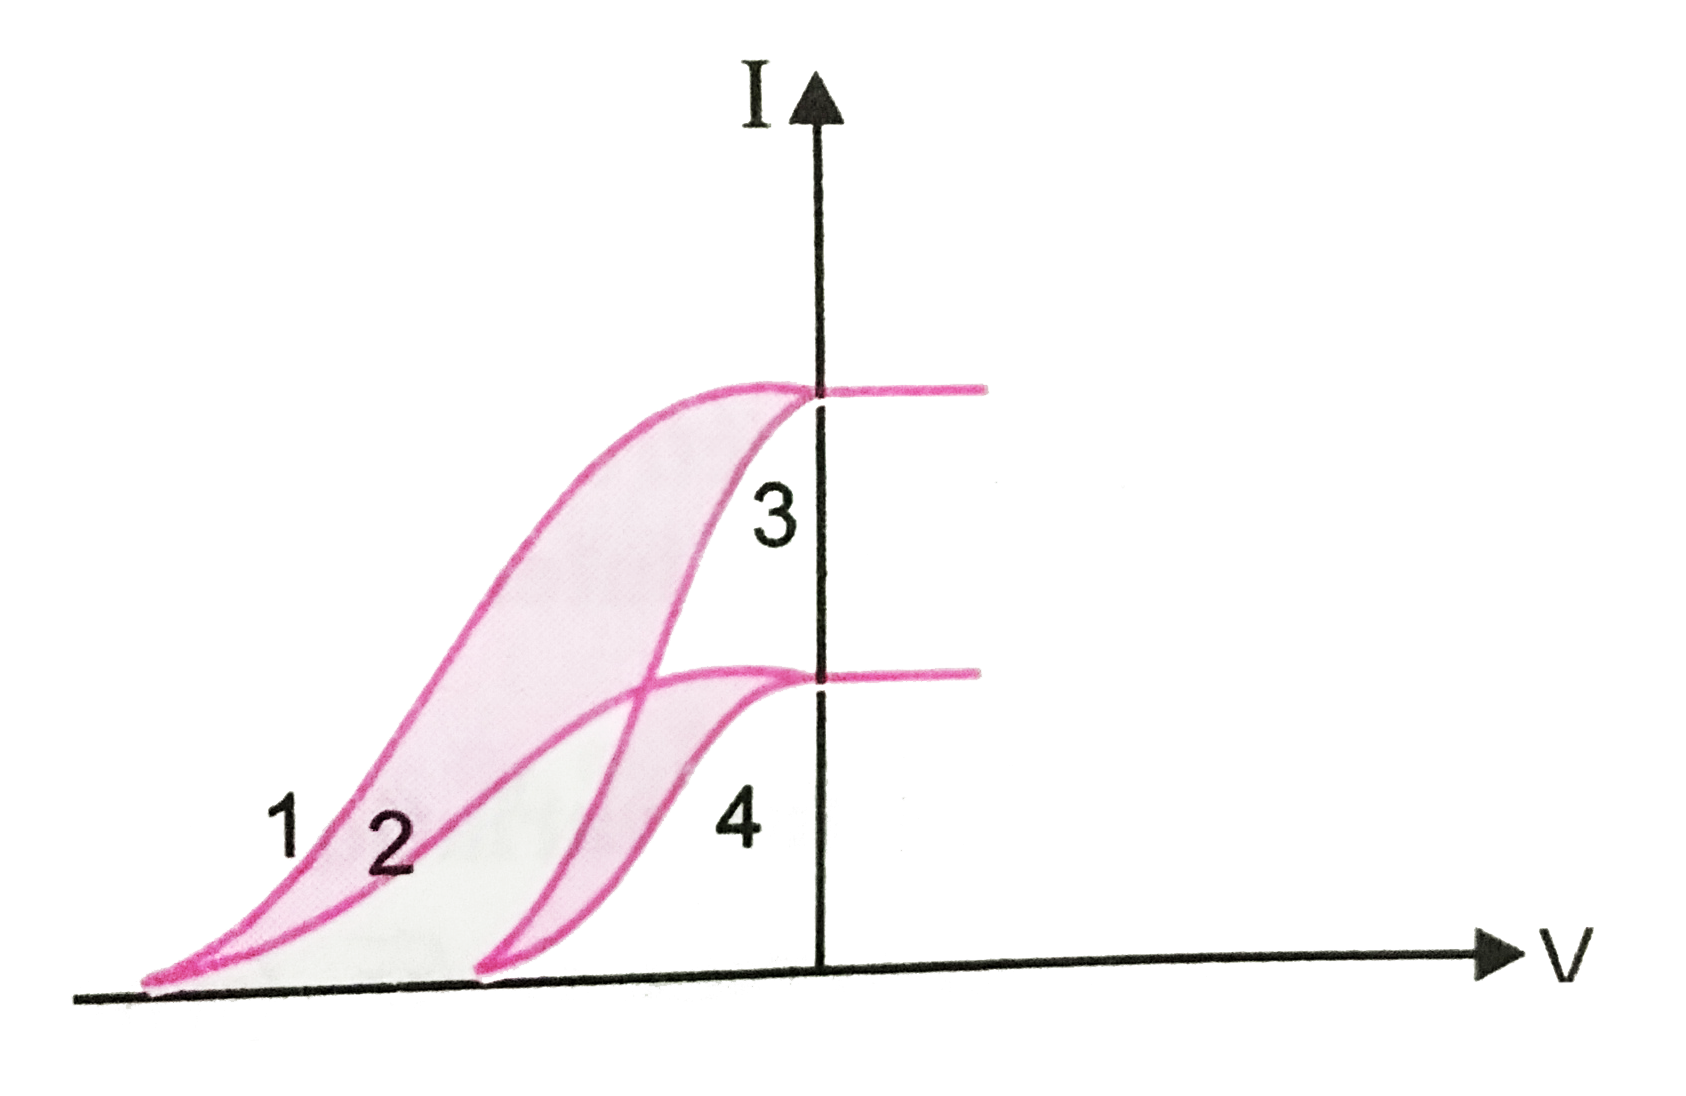
View SolutionThe graph of Fig. shows the variation of photoelectric current (I) versus applied voltage (V) for the two different photosensitive materials for two different intensities of the incident radiation. Identify the pairs of curves that correspond to different materials but same intensity of incident radiation.
 View Solution
