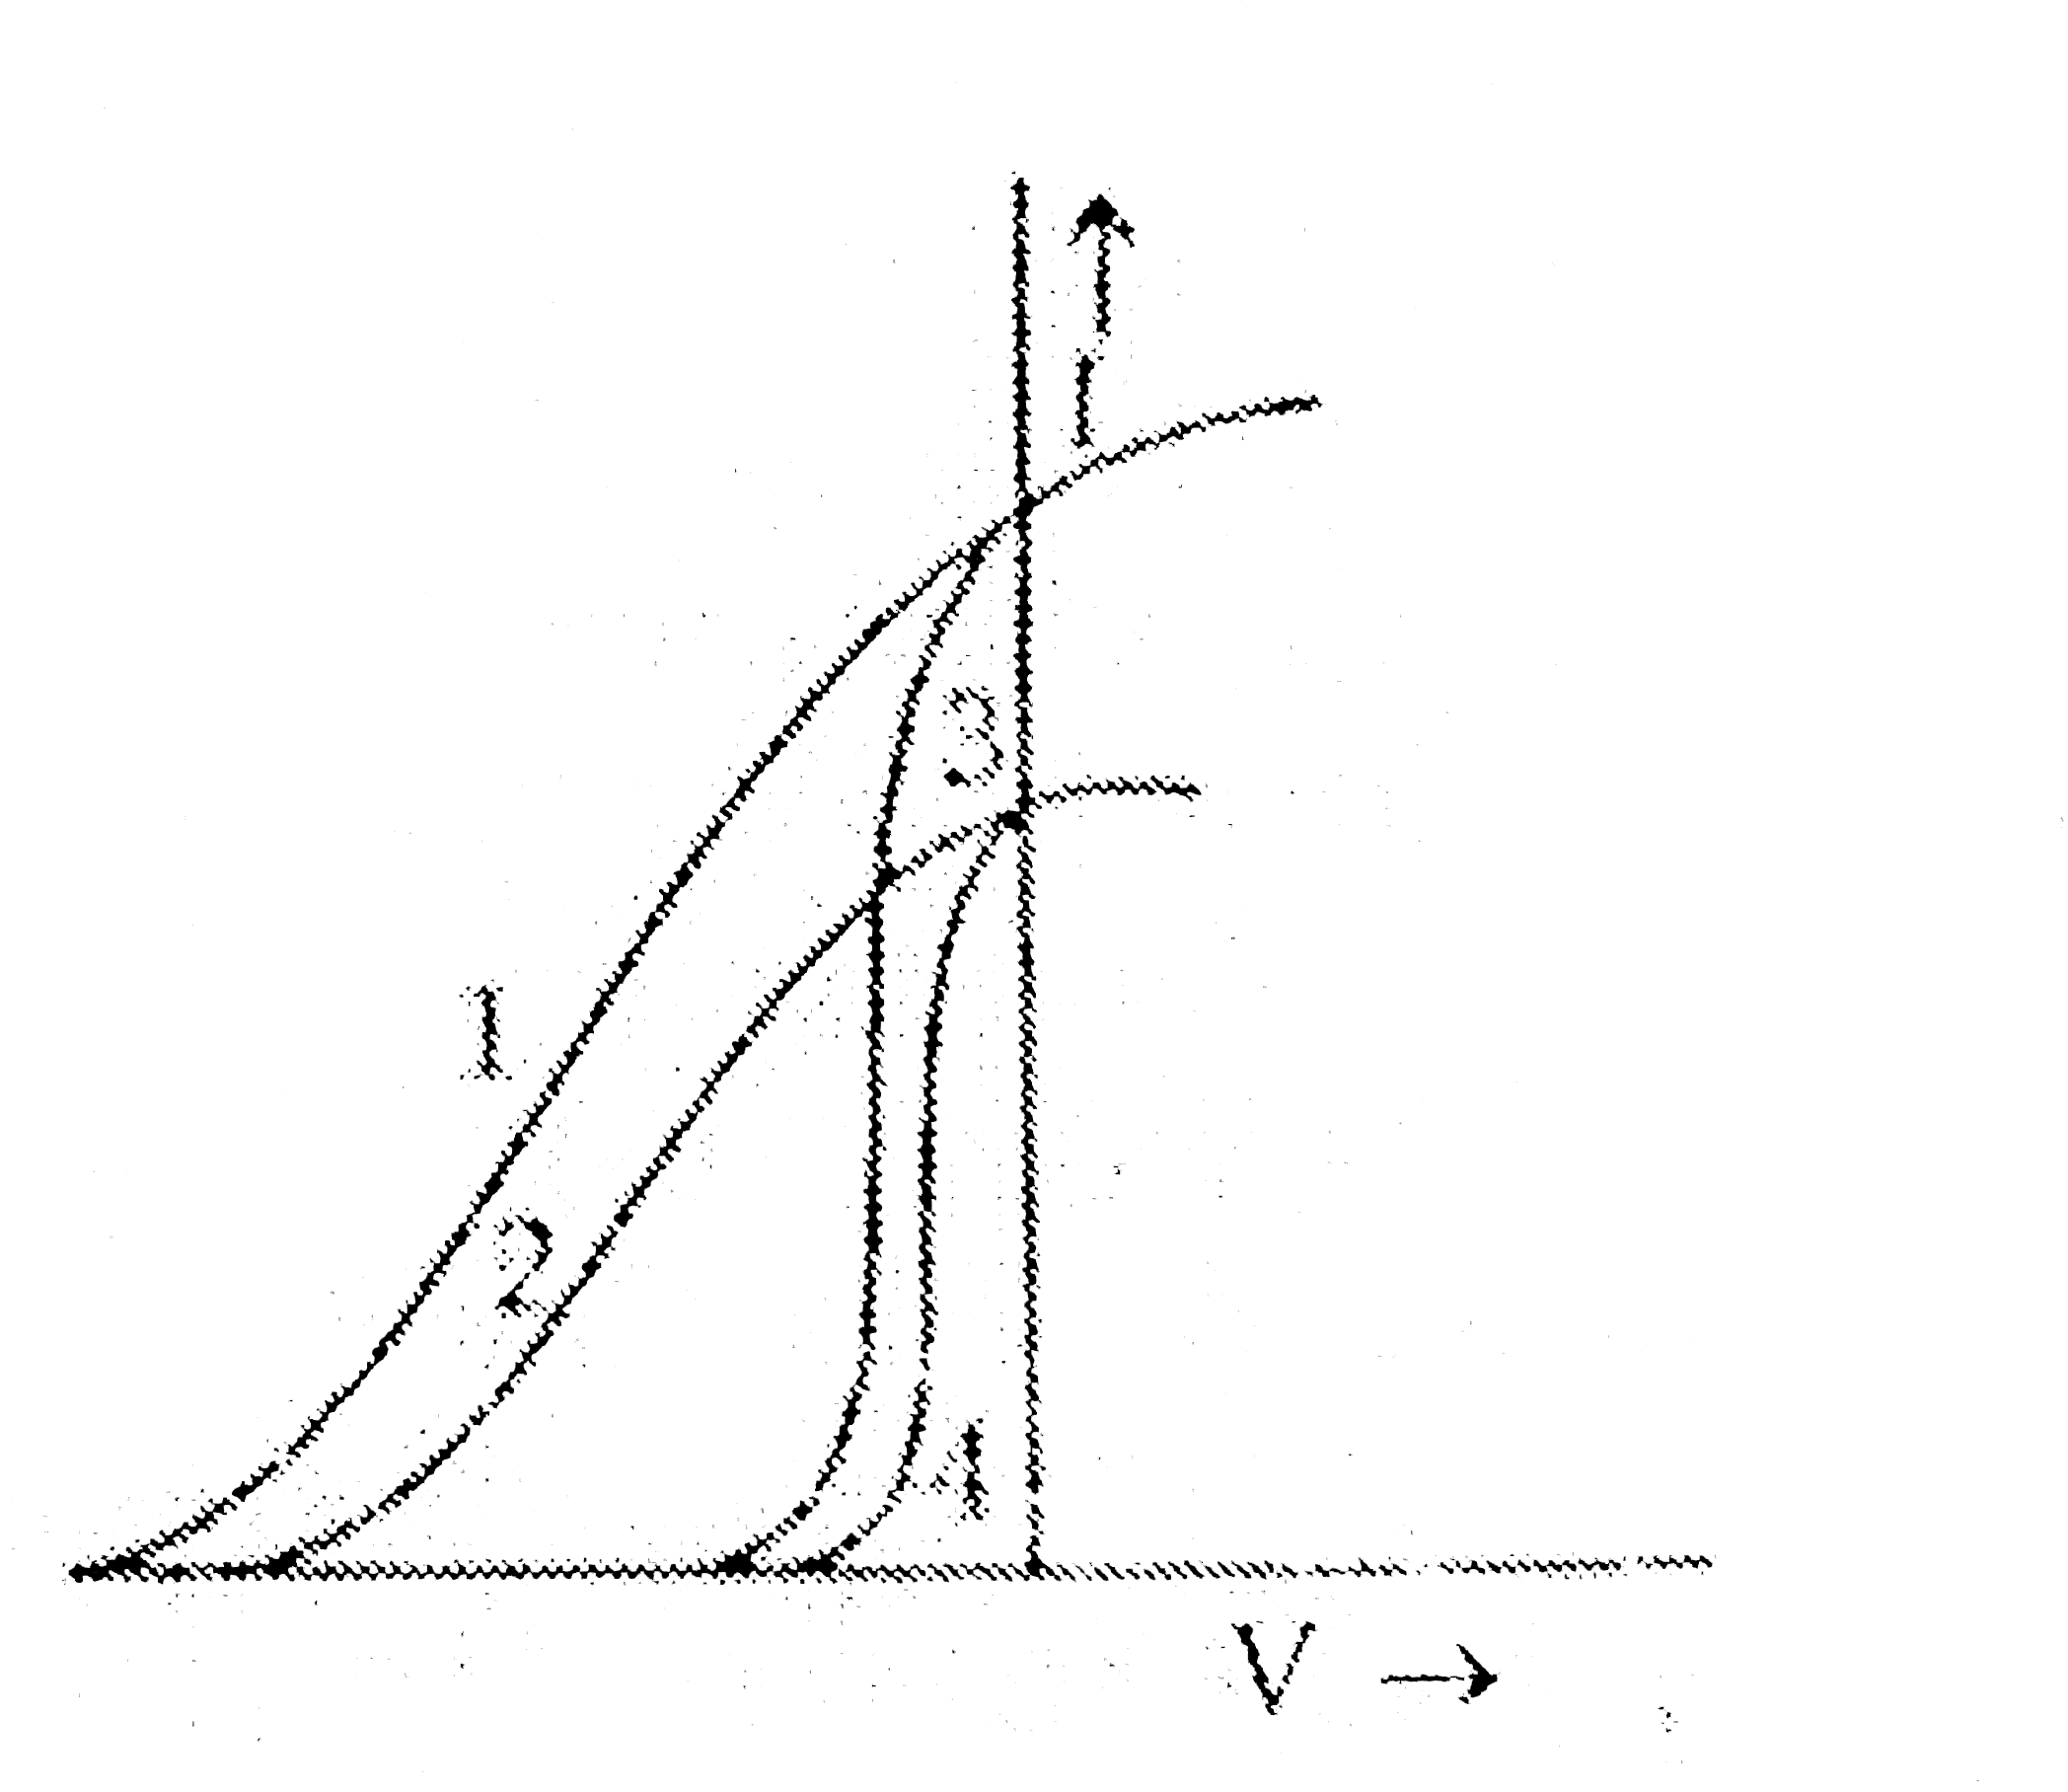
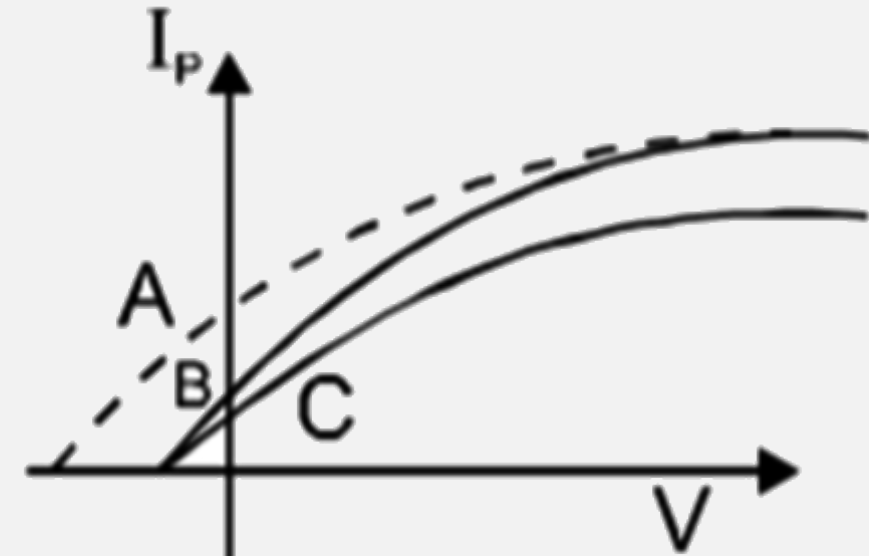
The graph of Fig. shows the variation of photoelectric current (I) versus applied voltage (V) for the two different photosensitive materials for two different intensities of the incident radiation. Identify the pairs of curves that correspond to different materials but same intensity of incident radiation.
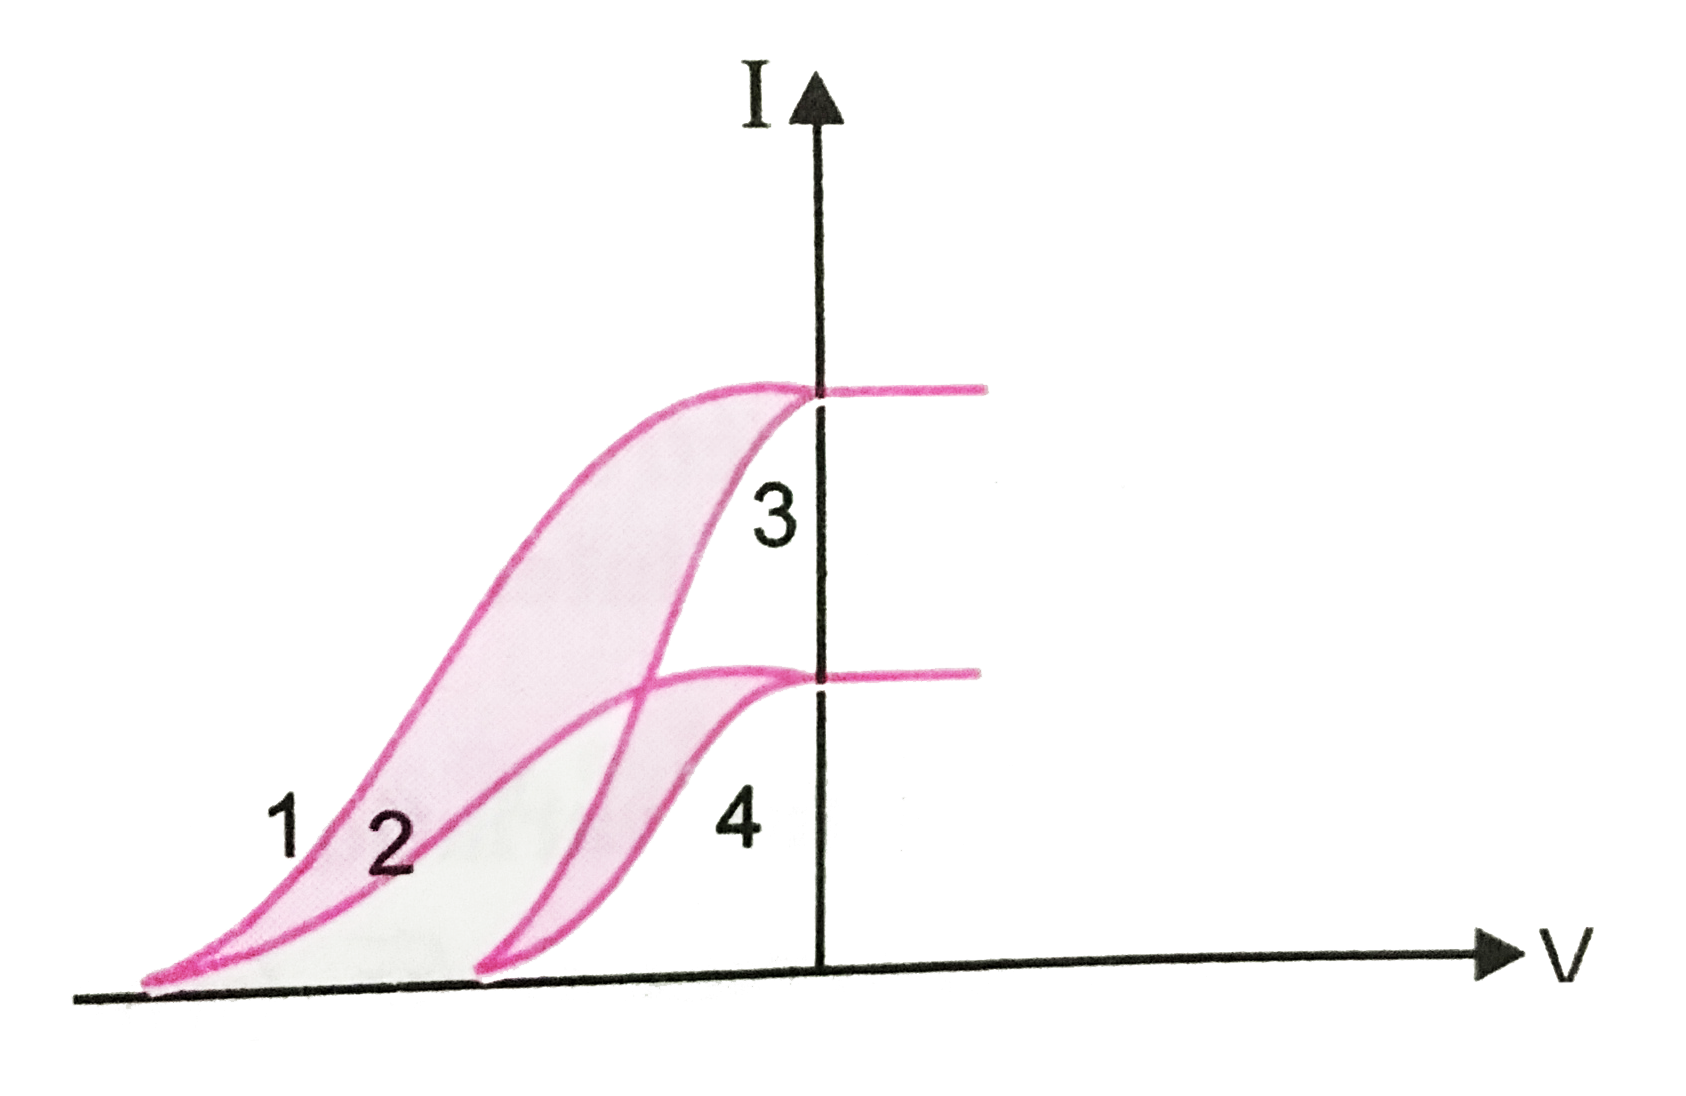
Curves 1 and 2 correspond to similar materials while curves 3 and 4 represent different materials, since the value of stopping potential for the pair of curves 1 and 2 and 3 and 4 are the same. For given frequency of the incident radiation the stopping potential is independent of its intensity.
So, the pairs of curves (1, 3) and (2, 4) correspond to different materials but same intensity of incident radiation.
Topper's Solved these Questions
- XII BOARDSBook:XII BOARD PREVIOUS YEAR PAPER ENGLISHChapter:XII BOARDSExercise:SET - II (Delhi Board)
Explore 7 Videos
- XII BOARDSBook:XII BOARD PREVIOUS YEAR PAPER ENGLISHChapter:XII BOARDSExercise:SET - III (Delhi Board)
Explore 6 Videos
- XII BOARDSBook:XII BOARD PREVIOUS YEAR PAPER ENGLISHChapter:XII BOARDSExercise:PHYSICS (Theory) [SET - III]
Explore 9 Videos
- SAMPLE PAPER 2019Book:XII BOARD PREVIOUS YEAR PAPER ENGLISHChapter:SAMPLE PAPER 2019Exercise:SECTION D
Explore 6 Videos
Similar Questions
Darw graphs showing variation of photoelctric current with applied voltage for two incident radiations of equal frequecny and different intensities. Mark the graph for the radiaiton of higher intensity.
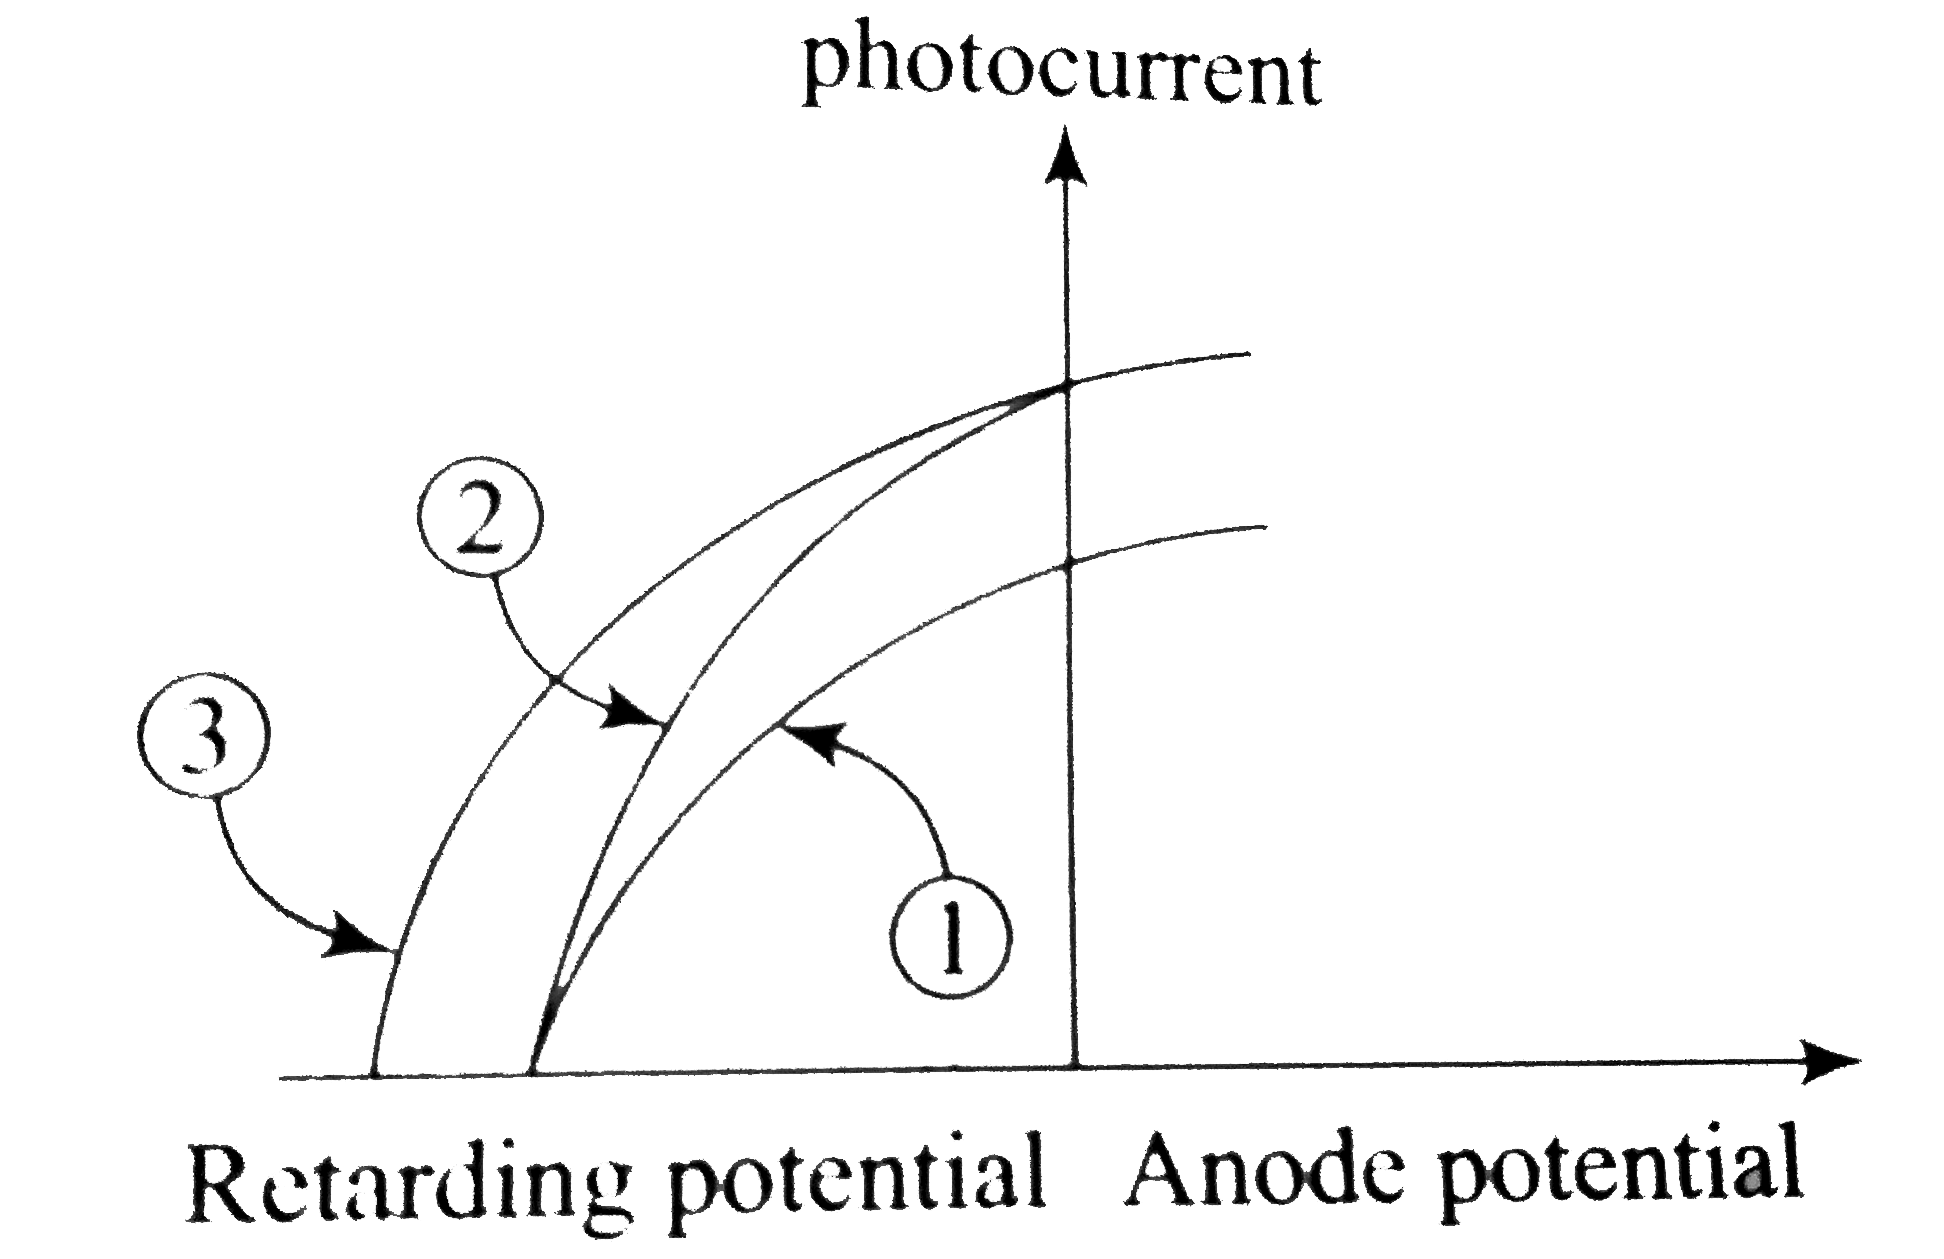
View SolutionThe figure shows a plot of photo current versus anode potential for a photosensitive surface for three different radiations. Which one of the following is a correct statement ?
View Solution
Knowledge Check
The fig. shows the variation of photon current with anode potential for a photo-sensitive surface for three different radiation. Let Ia,IbandIc be the intensities and fa,fbandfc be the frequency for the curves a,b and c respectively.
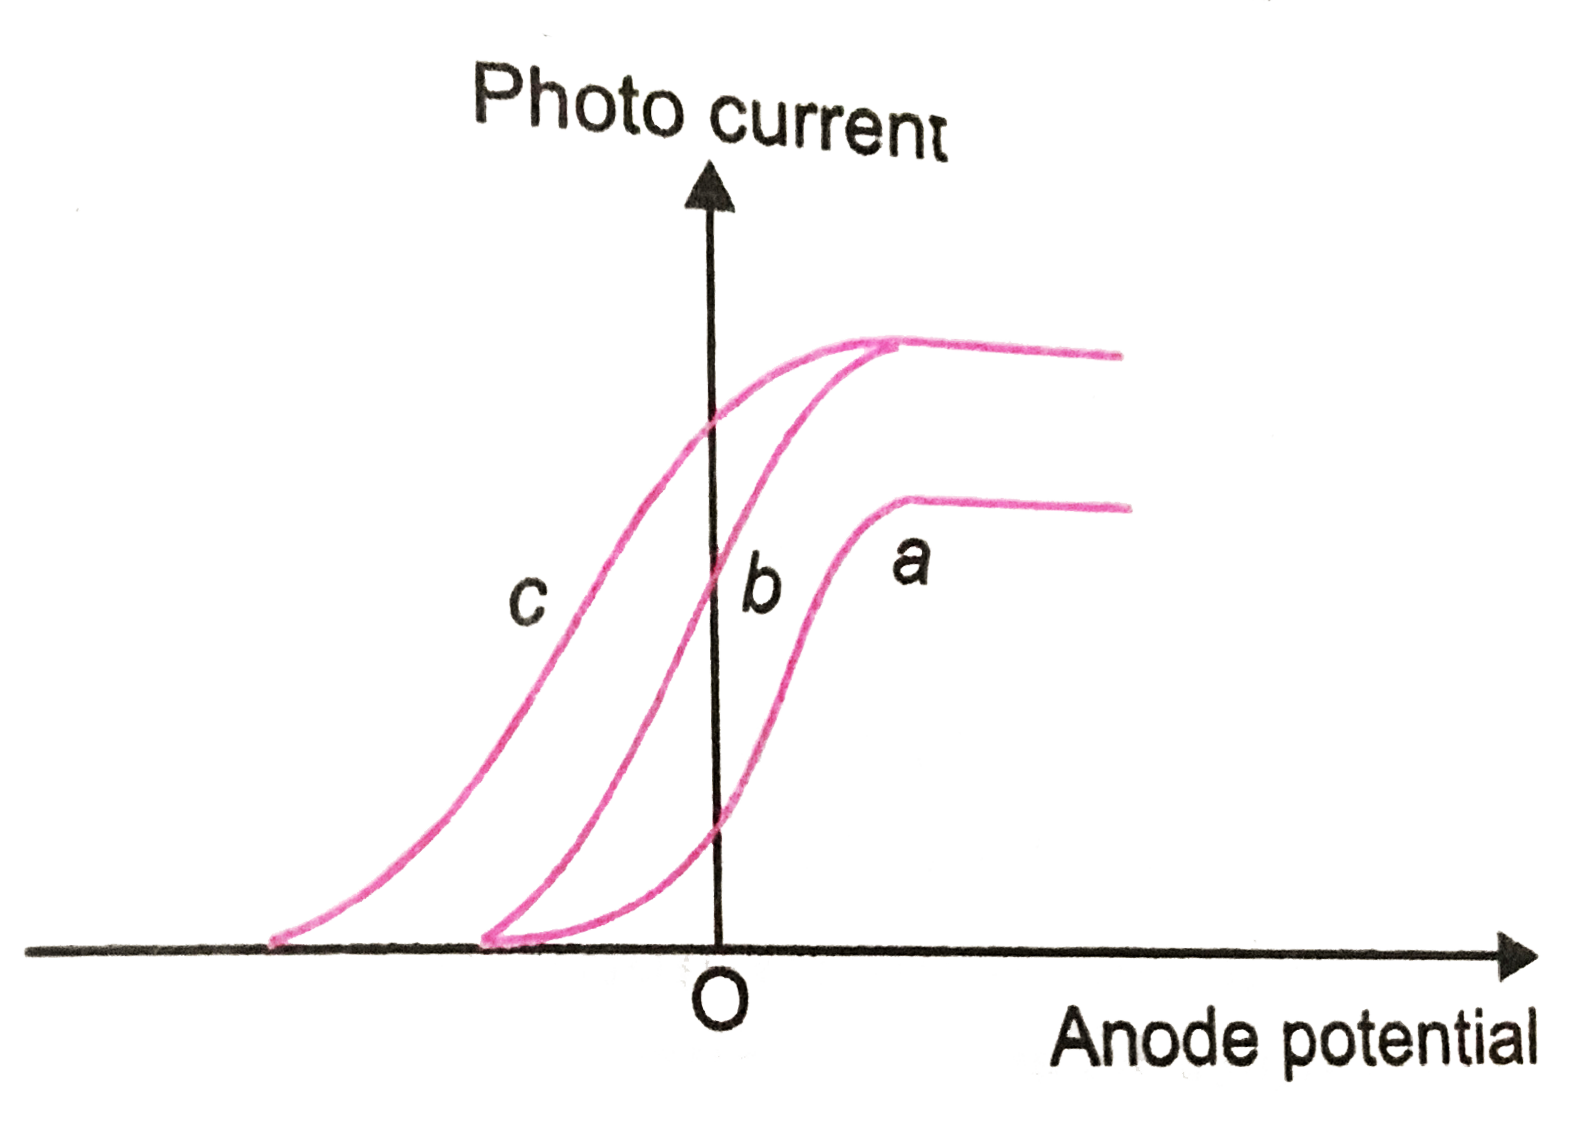 Ava=vbandIa≠IbBva=vcandIa=IcCva=vbandIa=IbDvb=vcandIb=Ic
The graph shows the variation of photocurrent with the applied voltage in a photoelectric effect experiment for three different beams of light falling on identical metal surfaces, then which among the following is correct ?
View SolutionDraw a plot showing the variation of photoelectric current with collector plate potential for two different frequencies, v1>v2 of incident radiation having the same intensity. In which case will the stopping potential be higher? Justify your answer.
View SolutionThe graph between photo electric current and cathode potential when the anode is kept at zero potential, for light of two different intensities out of the same frequency looks like the one:
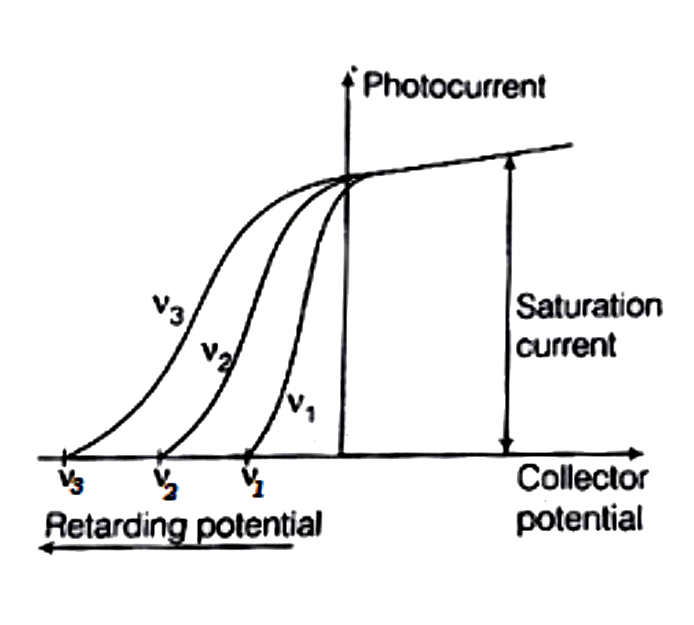
View SolutionThe variation of photocurrent with collector potential for different frequencies of incident radiation v1,v2,v3 is as shown in the the graph , then
View SolutionTwo wires of the same material but of different diameters carry the same current i. If the ratio of their diameters is 2:1 , then the corresponding ratio of their mean drift velocities will be
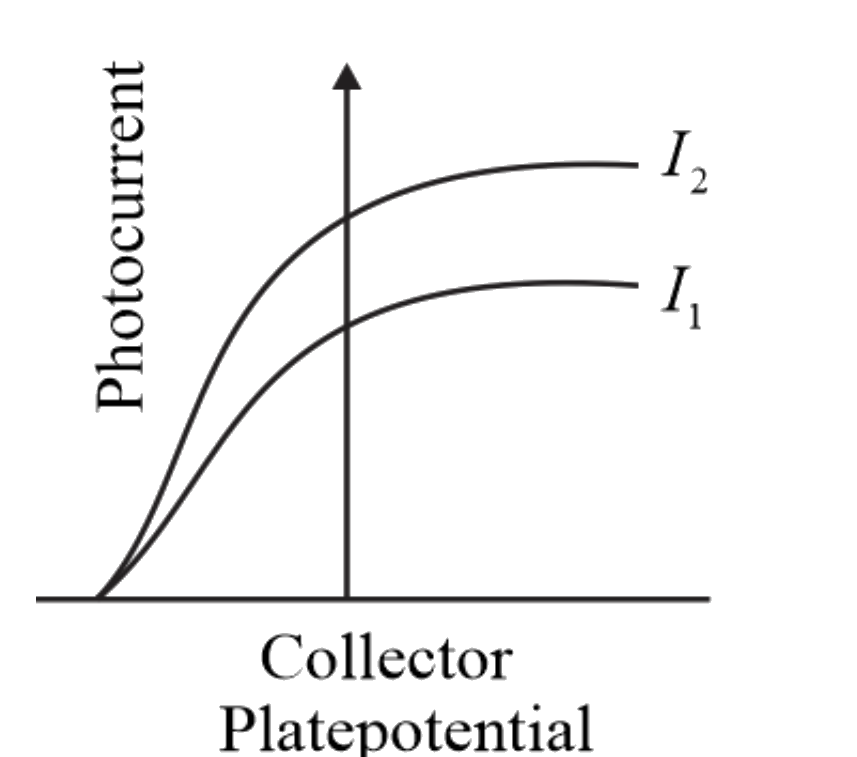
View SolutionFrom the following graph of photocurrent against collector plate potential for two different intensities of light I1andI2 one can , conclude
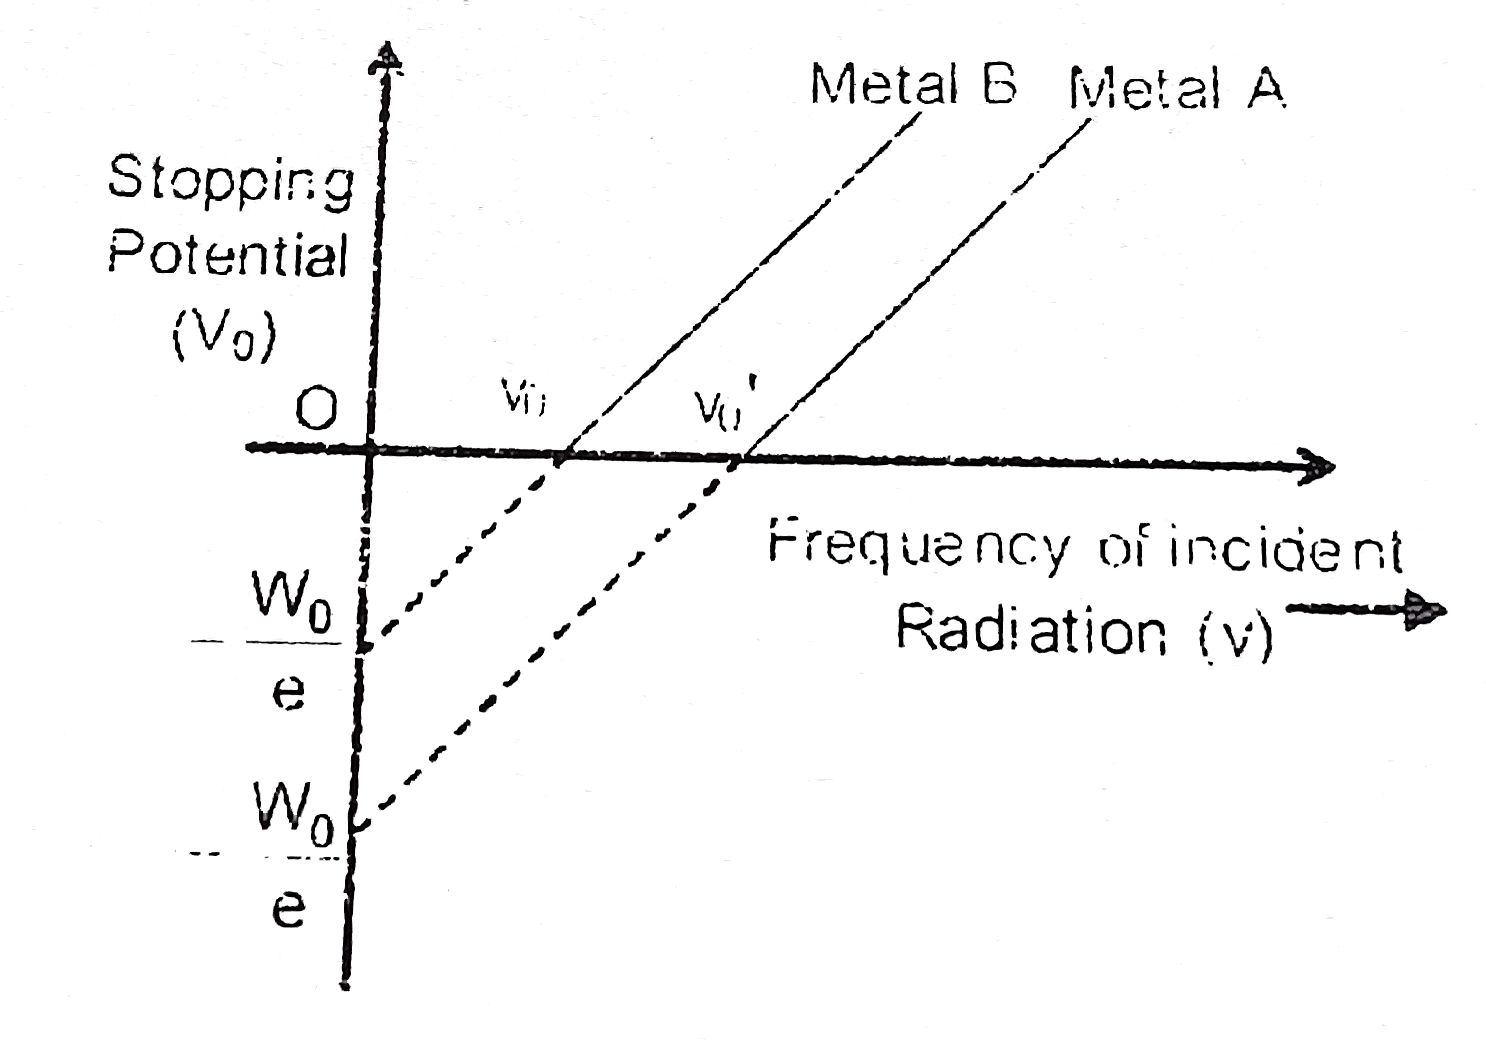
View SolutionThe graph shows variation of stopping potential V0 versus frequency of incident radiation v for two photosensitive metals A and B. Which of two metals has higher threshold frequency and why?
View Solution