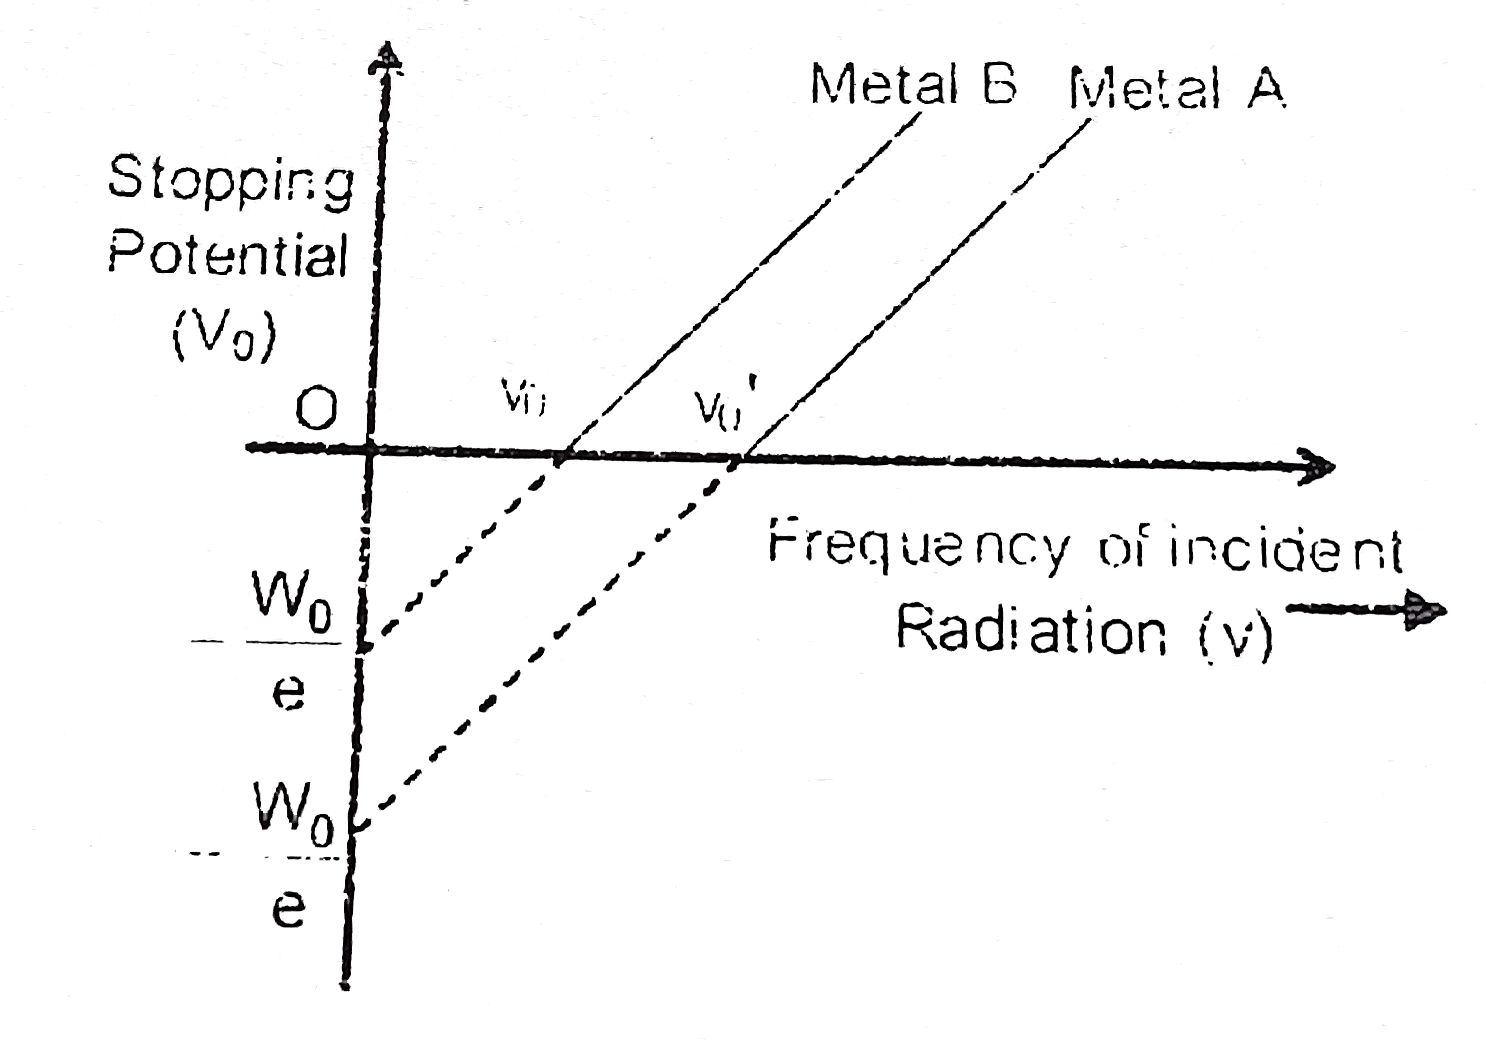
Sketch the graphs, showing the variation of stopping potential Vs with frequency v of the incident radiations for two photosensitive materials A and B having threshold frequencies v0>v'0 respectively.
(i) which of the two metals A or B has higher work function?
(ii) What information do you get from the slope of the graphs?
(iii) What does the value of the intercept of graph A on the potential axis represent?
To solve the problem step by step, we will sketch the graphs and analyze the information provided.
Step 1: Sketch the Graphs
1. Draw the axes:
- The x-axis represents the frequency (ν) of the incident radiation.
- The y-axis represents the stopping potential (Vs).
2. Identify the threshold frequencies:
- For material A, the threshold frequency is ν0.
- For material B, the threshold frequency is ν′0 where ν0>ν′0.
3. Plot the graphs:
- For material A, the graph will start at ν0 and rise linearly, indicating that for frequencies above ν0, the stopping potential increases.
- For material B, the graph will start at ν′0 and also rise linearly, but it will be at a lower frequency than material A.
4. Label the graphs:
- The graph for material A can be labeled as Vs vs. ν for material A.
- The graph for material B can be labeled as Vs vs. ν for material B.
Step 2: Determine the Work Function
- The work function ϕ is related to the threshold frequency by the equation ϕ=hν0.
- Since ν0>ν′0, it follows that ϕA>ϕB.
- Conclusion: Material A has a higher work function than material B.
Step 3: Analyze the Slope of the Graphs
- The slope of the graph dVsdν represents the ratio he, where h is Planck's constant and e is the charge of the electron.
- Conclusion: The slope of the graphs provides the value of he, which is a constant.
Step 4: Interpret the Intercept of Graph A
- The intercept of graph A on the potential axis occurs at Vs=−ϕAe.
- This value represents the negative of the work function divided by the charge of the electron.
- Conclusion: The intercept of graph A on the potential axis represents the work function of material A in terms of stopping potential.
Summary of Answers:
1. Higher Work Function: Material A has a higher work function than material B.
2. Slope Information: The slope of the graphs gives he.
3. Intercept Meaning: The intercept of graph A on the potential axis represents the work function of material A.
1. Draw the axes:
- The x-axis represents the frequency (ν) of the incident radiation.
- The y-axis represents the stopping potential (Vs).
- For material A, the threshold frequency is ν0.
- For material B, the threshold frequency is ν′0 where ν0>ν′0.
- For material A, the graph will start at ν0 and rise linearly, indicating that for frequencies above ν0, the stopping potential increases.
- For material B, the graph will start at ν′0 and also rise linearly, but it will be at a lower frequency than material A.
- The graph for material A can be labeled as Vs vs. ν for material A.
- The graph for material B can be labeled as Vs vs. ν for material B.
- The work function ϕ is related to the threshold frequency by the equation ϕ=hν0.
- Since ν0>ν′0, it follows that ϕA>ϕB.
- Conclusion: Material A has a higher work function than material B.
- The slope of the graph dVsdν represents the ratio he, where h is Planck's constant and e is the charge of the electron.
- Conclusion: The slope of the graphs provides the value of he, which is a constant.
- The intercept of graph A on the potential axis occurs at Vs=−ϕAe.
- This value represents the negative of the work function divided by the charge of the electron.
- Conclusion: The intercept of graph A on the potential axis represents the work function of material A in terms of stopping potential.
1. Higher Work Function: Material A has a higher work function than material B.
2. Slope Information: The slope of the graphs gives he.
3. Intercept Meaning: The intercept of graph A on the potential axis represents the work function of material A.
Similar Questions
The graph shows variation of stopping potential V0 versus frequency of incident radiation v for two photosensitive metals A and B. Which of two metals has higher threshold frequency and why?

View Solution(i) Plot a labelled graph of |Vs| where Vs is stopping potential versus frequency f of the incident radiation.
(ii) State how will you use this graph to determine the value of Planck.s constant.
View Solution
Knowledge Check
The stopping potential as a function of the frequency of the incident radiation is plotted for two different photoelectric surfaces A and B . The graphs show that work function of A is
 AlessBmoreCequalDnothing can be said
The slope of the graph drawn between stopping potential and frequency of incident radiation will be
View SolutionFor a photoelectric cell the graph showing the variation of cut of voltage (V0) with frequency (v) of incident light is best represented by

View SolutionPlot a graph showing the variation of stopping potential with the frequency of incident radiation for two different photosensitive having work functions W1andW2(W1>W2) . On what factors does the (i) slope and (ii) intercept of the lines depend ?
View SolutionThe slope of the graph showing the variation of potential difference V on X-axis and current Y-axis gives conductor
View SolutionFigure shows the graph of stopping potential verus that frequency of a photosensitive metal. The plank's constant and work funcation of the metal are
_S01_035_Q01.png)
View Solution
Using the graph shown in the figure for stopping potential vs. the incident frequency of photons, calculate Planck.s constant.
View SolutionGraph between stopping potential and frequency of light as shown find the work function

View Solution
