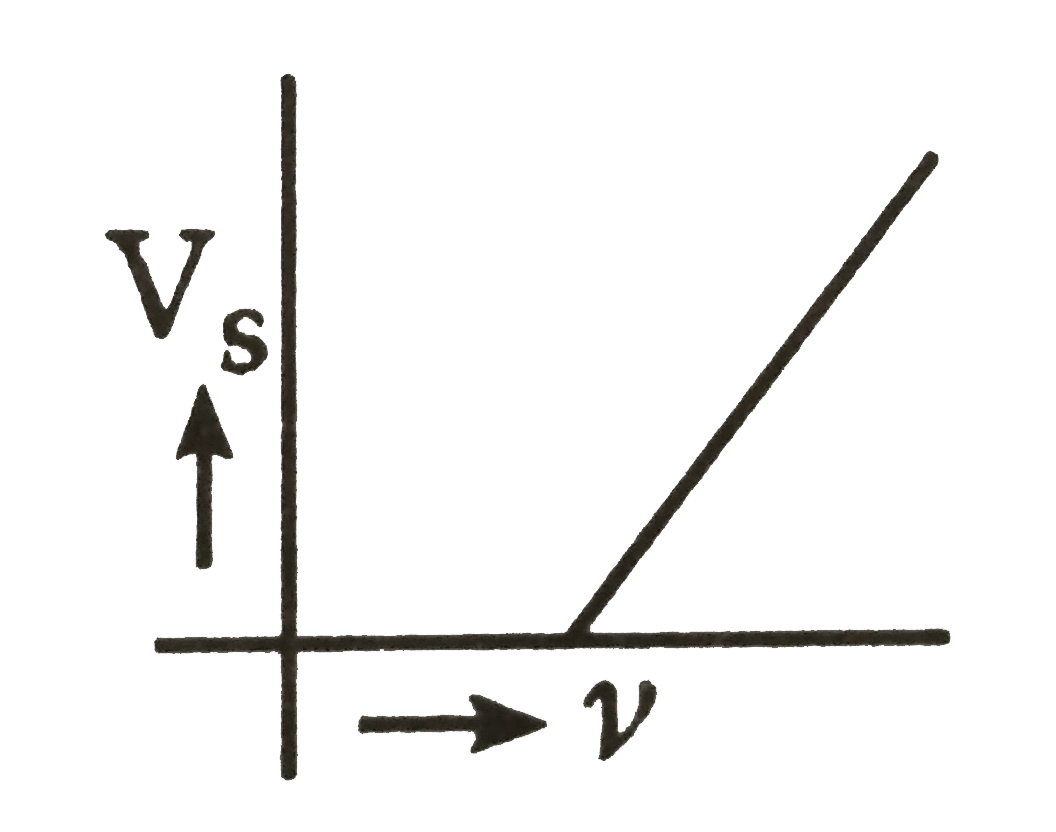
The slope of the graph drawn between stopping potential and frequency of incident radiation will be
he
The correct Answer is:A
To find the slope of the graph drawn between stopping potential (V₀) and frequency (ν) of incident radiation, we can follow these steps:
Step 1: Understand the Photoelectric Effect
In the photoelectric effect, when light of frequency ν strikes a metal surface, it imparts energy to electrons. The energy of the incident radiation can be expressed using Planck's equation:
E=hν
where E is the energy of the photon, h is Planck's constant, and ν is the frequency of the incident radiation.
Step 2: Relate Stopping Potential to Energy
The stopping potential (V₀) is the potential needed to stop the most energetic photoelectrons emitted from the surface. The kinetic energy (KE) of the emitted electrons can be expressed as:
KE=eV₀
where e is the charge of the electron.
Step 3: Set Up the Energy Equation
According to the conservation of energy, the energy of the incident photon is used to overcome the work function (φ) of the metal and provide kinetic energy to the emitted electrons:
hν=φ+eV₀
Step 4: Rearranging the Equation
Rearranging the equation gives us:
eV₀=hν−φ
This can be rewritten as:
V₀=heν−φe
Step 5: Identify the Slope
From the equation V₀=heν−φe, we can see that this is in the form of a linear equation y=mx+c, where:
- y is the stopping potential V₀
- x is the frequency ν
- m (the slope) is he
Conclusion
Thus, the slope of the graph drawn between stopping potential (V₀) and frequency (ν) of incident radiation is:
Slope=he
---
In the photoelectric effect, when light of frequency ν strikes a metal surface, it imparts energy to electrons. The energy of the incident radiation can be expressed using Planck's equation:
E=hν
where E is the energy of the photon, h is Planck's constant, and ν is the frequency of the incident radiation.
The stopping potential (V₀) is the potential needed to stop the most energetic photoelectrons emitted from the surface. The kinetic energy (KE) of the emitted electrons can be expressed as:
KE=eV₀
where e is the charge of the electron.
According to the conservation of energy, the energy of the incident photon is used to overcome the work function (φ) of the metal and provide kinetic energy to the emitted electrons:
hν=φ+eV₀
Rearranging the equation gives us:
eV₀=hν−φ
This can be rewritten as:
V₀=heν−φe
From the equation V₀=heν−φe, we can see that this is in the form of a linear equation y=mx+c, where:
- y is the stopping potential V₀
- x is the frequency ν
- m (the slope) is he
Thus, the slope of the graph drawn between stopping potential (V₀) and frequency (ν) of incident radiation is:
Slope=he
Topper's Solved these Questions
- DUAL NATURE OF RADIATION AND MATTERBOOK - AAKASH SERIESCHAPTER - DUAL NATURE OF RADIATION AND MATTEREXERCISE - EXERCISE-I ASSERTION AND REASON
4 Videos
- DUAL NATURE OF RADIATION AND MATTERBOOK - AAKASH SERIESCHAPTER - DUAL NATURE OF RADIATION AND MATTEREXERCISE - EXERCISE=II
42 Videos
- DUAL NATURE OF RADIATION AND MATTERBOOK - AAKASH SERIESCHAPTER - DUAL NATURE OF RADIATION AND MATTEREXERCISE - PRACTICE EXERCISEX
42 Videos
- CURRENT ELECTRICITYBOOK - AAKASH SERIESCHAPTER - CURRENT ELECTRICITYEXERCISE - EXERCISE - IA
2 Videos
- ELECTRIC CHARGES AND FIELDSBOOK - AAKASH SERIESCHAPTER - ELECTRIC CHARGES AND FIELDSEXERCISE - Practice Exercise
57 Videos
Similar Questions
In photoelectric effect the slope of straight line graph between stopping potential (Vs) and frequency of incident light (v) gives

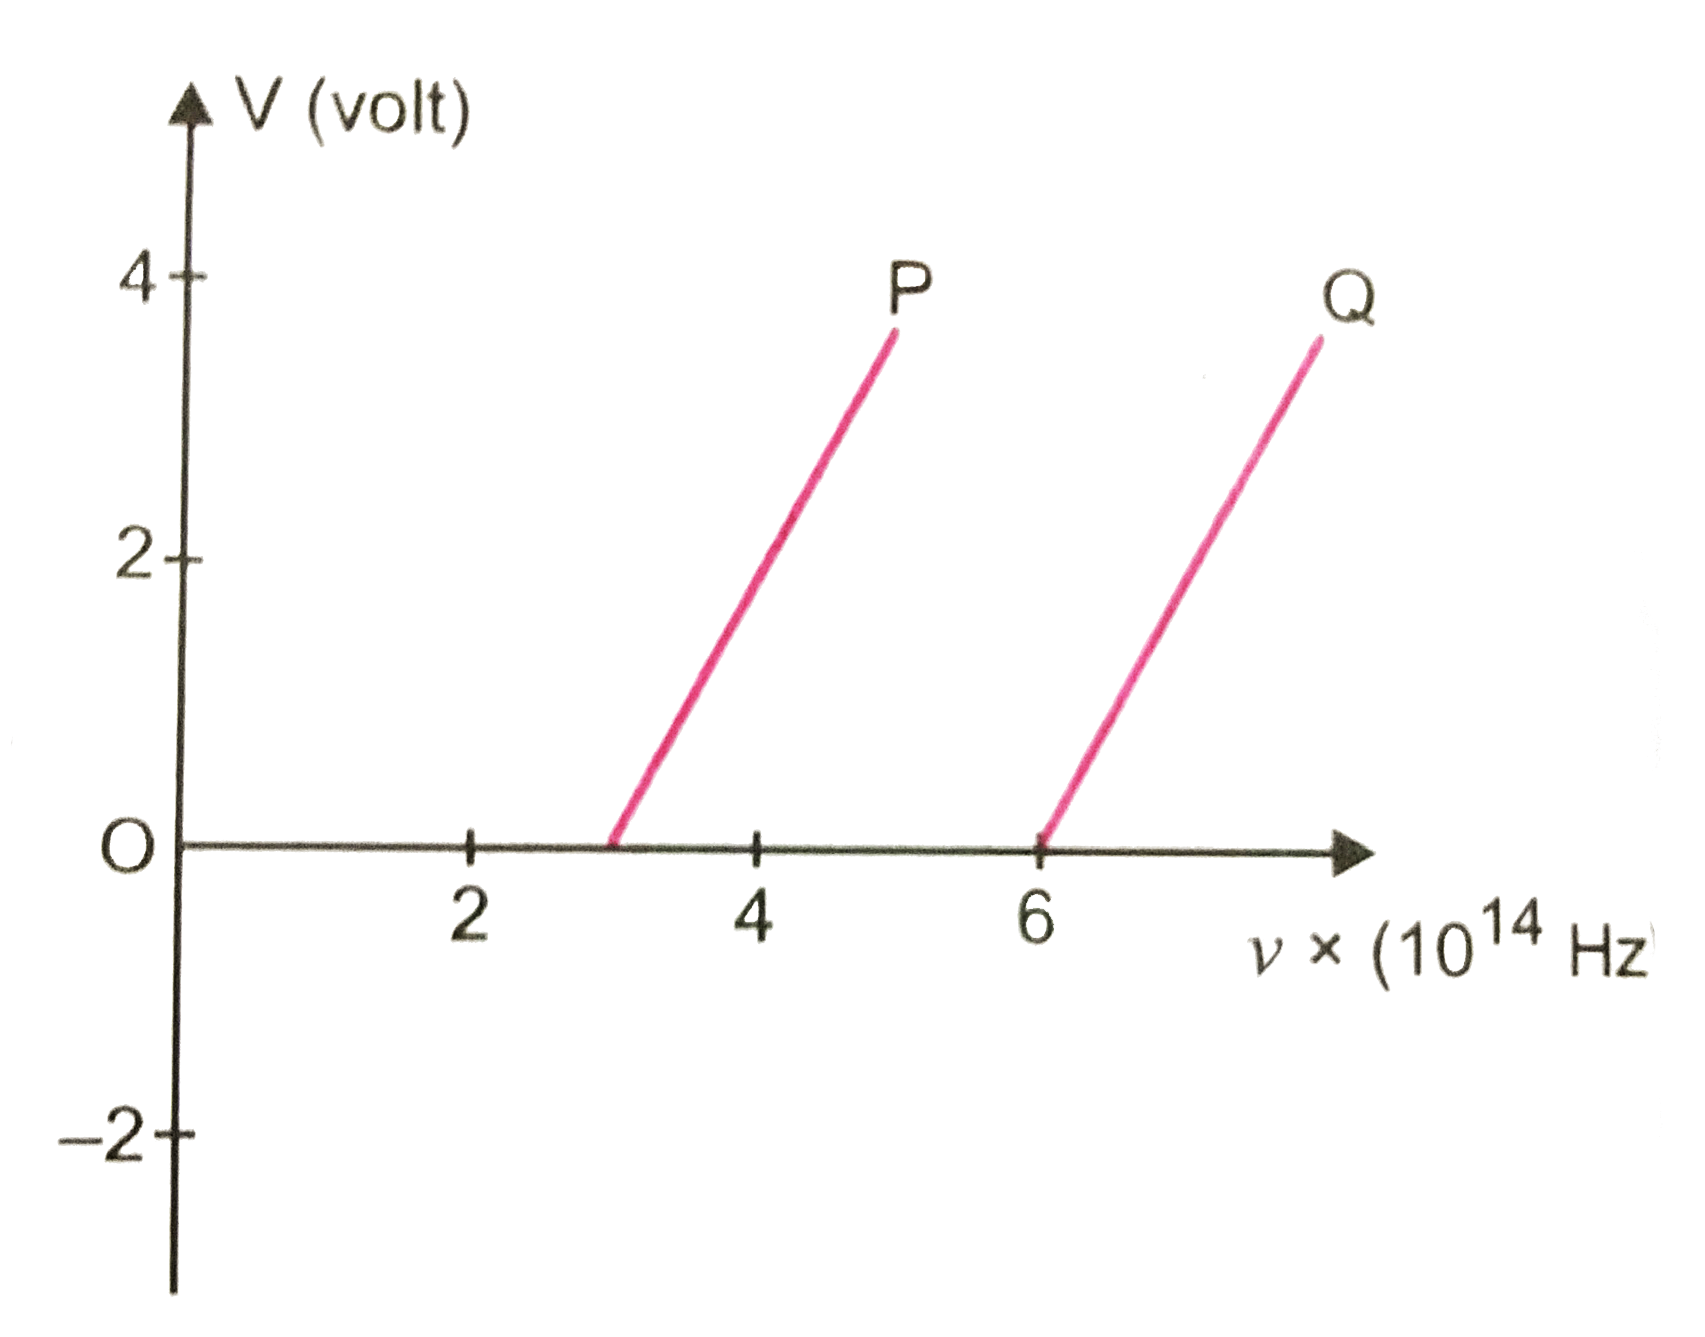
View SolutionIn the study of a photoelectric effect the graph between the stopping potential V and frequency ν of the incident radiation on two different metals P and Q is shown in fig.
(i) which one of two metals have higher threshold frequency
(ii) Determine the work function of the metal which has greater value
(iii) Find the maximum kinetic energy of electron emitted by light of frequency 8×10¹⁴Hz for this metal.

View Solution
Knowledge Check
In photoelectric effect experiment, the slope of the graph of the stopping potential versus frequency gives the value of :
AheBhCehDhce
When a high frequency electromagnetic radiation is incident on a metallic surface, electrons are emitted from the surface. Energy of emitted photoelectrons depends only on the frequency of incident electromagnetic radiation and the number of emitted electrons depends only on the intensity of incident light.
Einstein's protoelectron equation [Kmax=hv−ϕ} correctly explains the PE, where υ= frequency of incident light and ϕ= work function.
Q. The slope of the graph between stopping potential and frequency is [here h is the Planck's constant and e is the charge of an electron] is
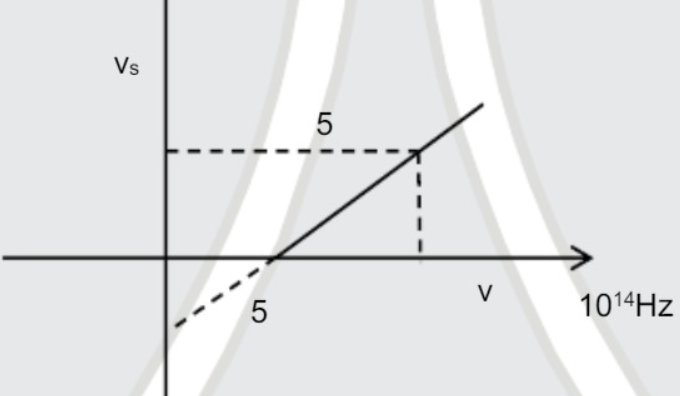
View SolutionGraph between stopping potential and frequency of light as shown find the work function

View SolutionPlot a graph showing the variation of stopping potential with the frequency of incident radiation for two different photosensitive having work functions W1andW2(W1>W2) . On what factors does the (i) slope and (ii) intercept of the lines depend ?
View SolutionIn photoelectric effect the slope of stop of stopping potential versus frequency of incident light for a given surface will be
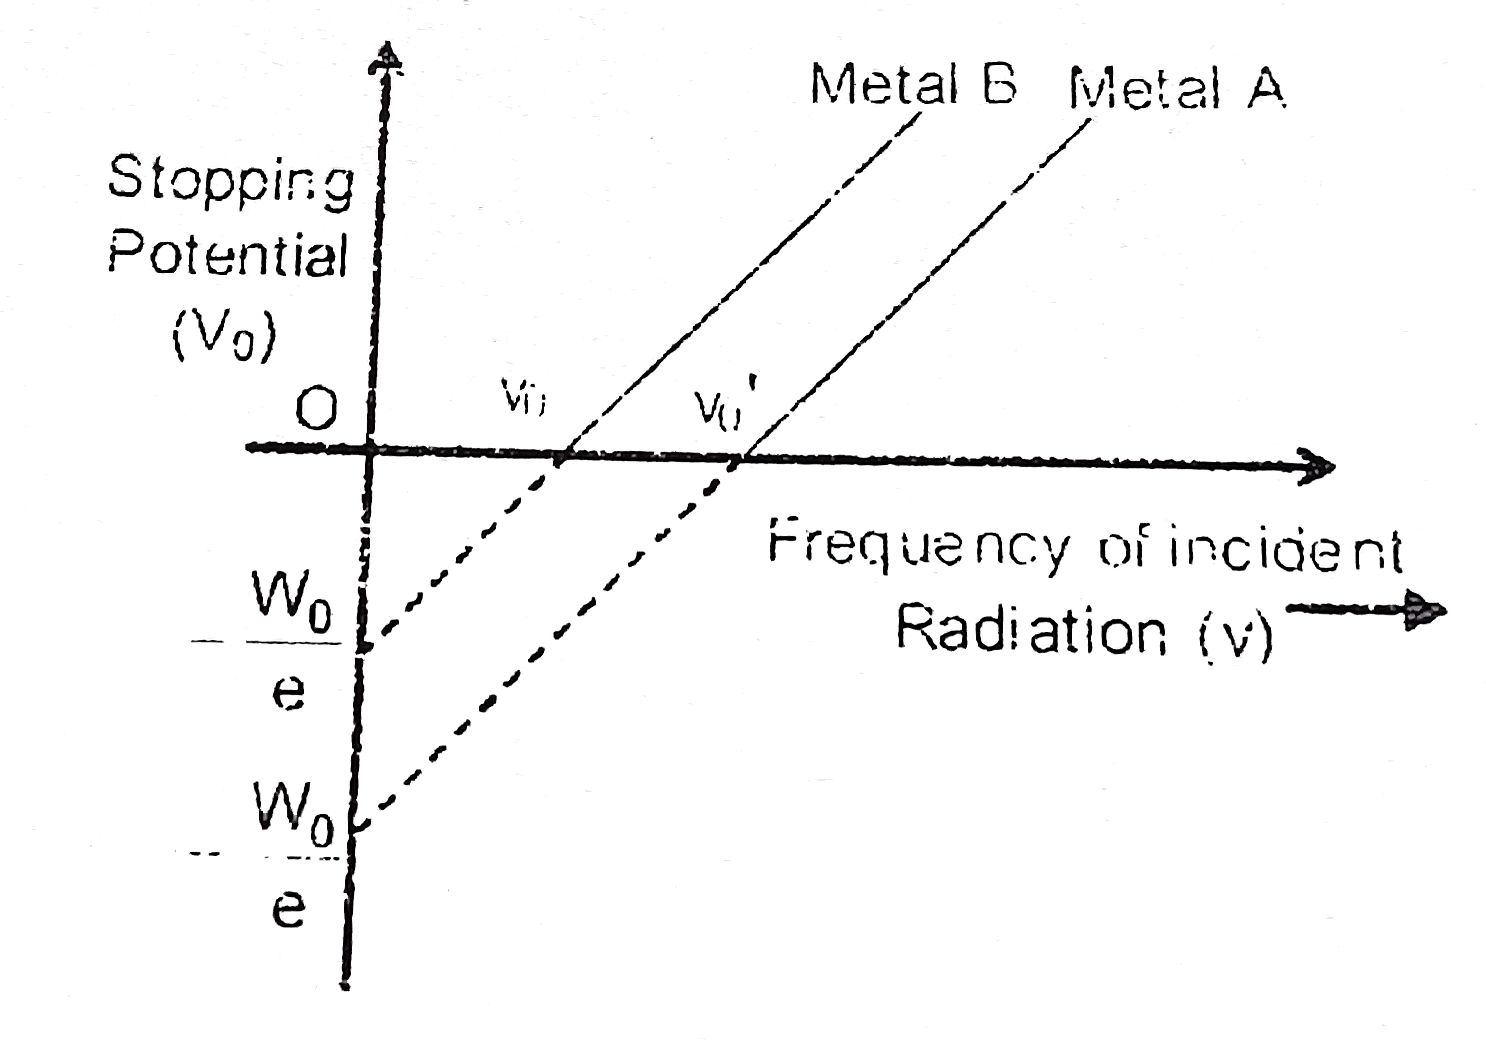
View SolutionThe graph shows variation of stopping potential V0 versus frequency of incident radiation v for two photosensitive metals A and B. Which of two metals has higher threshold frequency and why?

View SolutionSketch the graphs, showing the variation of stopping potential Vs with frequency v of the incident radiations for two photosensitive materials A and B having threshold frequencies v0>v'0 respectively.
(i) which of the two metals A or B has higher work function?
(ii) What information do you get from the slope of the graphs?
(iii) What does the value of the intercept of graph A on the potential axis represent?
View Solution(i) Plot a labelled graph of |Vs| where Vs is stopping potential versus frequency f of the incident radiation.
(ii) State how will you use this graph to determine the value of Planck.s constant.
View Solution
