Figure shows the graph of stopping potential verus that frequency of a photosensitive metal. The plank's constant and work funcation of the metal are
_S01_035_Q01.png)
(V2+V1v2+v2)e,(V2v1+V1v2v2+v1)e
(V2+V1v2−v1)e,(V2v1+V1v2v2−v1)e
(V2−V1v2+v1)e,(V2v1−V1v2v2+v1)e
(V2−V1v2−v1)e,(V2v1−V1v2v2−v1)e
The correct Answer is:D
Equation of straight line V−V1v−v1=V2−V1v2−v1⇒V=(V2−V1v2−v1)v−(V2v1−V1v2v2−v1)
But V=(he)v−ϕe⇒h=(V2−V1v2−v1)e and ϕ0=(V2v1−V1v2v2−v1)e
Topper's Solved these Questions
- SIMPLE HARMONIC MOTIONBook:ALLENChapter:SIMPLE HARMONIC MOTIONExercise:Exercise-01
Explore 117 Videos
- SIMPLE HARMONIC MOTIONBook:ALLENChapter:SIMPLE HARMONIC MOTIONExercise:Exercise-02
Explore 19 Videos
- SIMPLE HARMONIC MOTIONBook:ALLENChapter:SIMPLE HARMONIC MOTIONExercise:Example
Explore 1 Video
- RACEBook:ALLENChapter:RACEExercise:Basic Maths (Wave Motion & Dopplers Effect) (Stationary waves & doppler effect, beats)
Explore 24 Videos
- TEST PAPERBook:ALLENChapter:TEST PAPERExercise:PHYSICS
Explore 4 Videos
Similar Questions
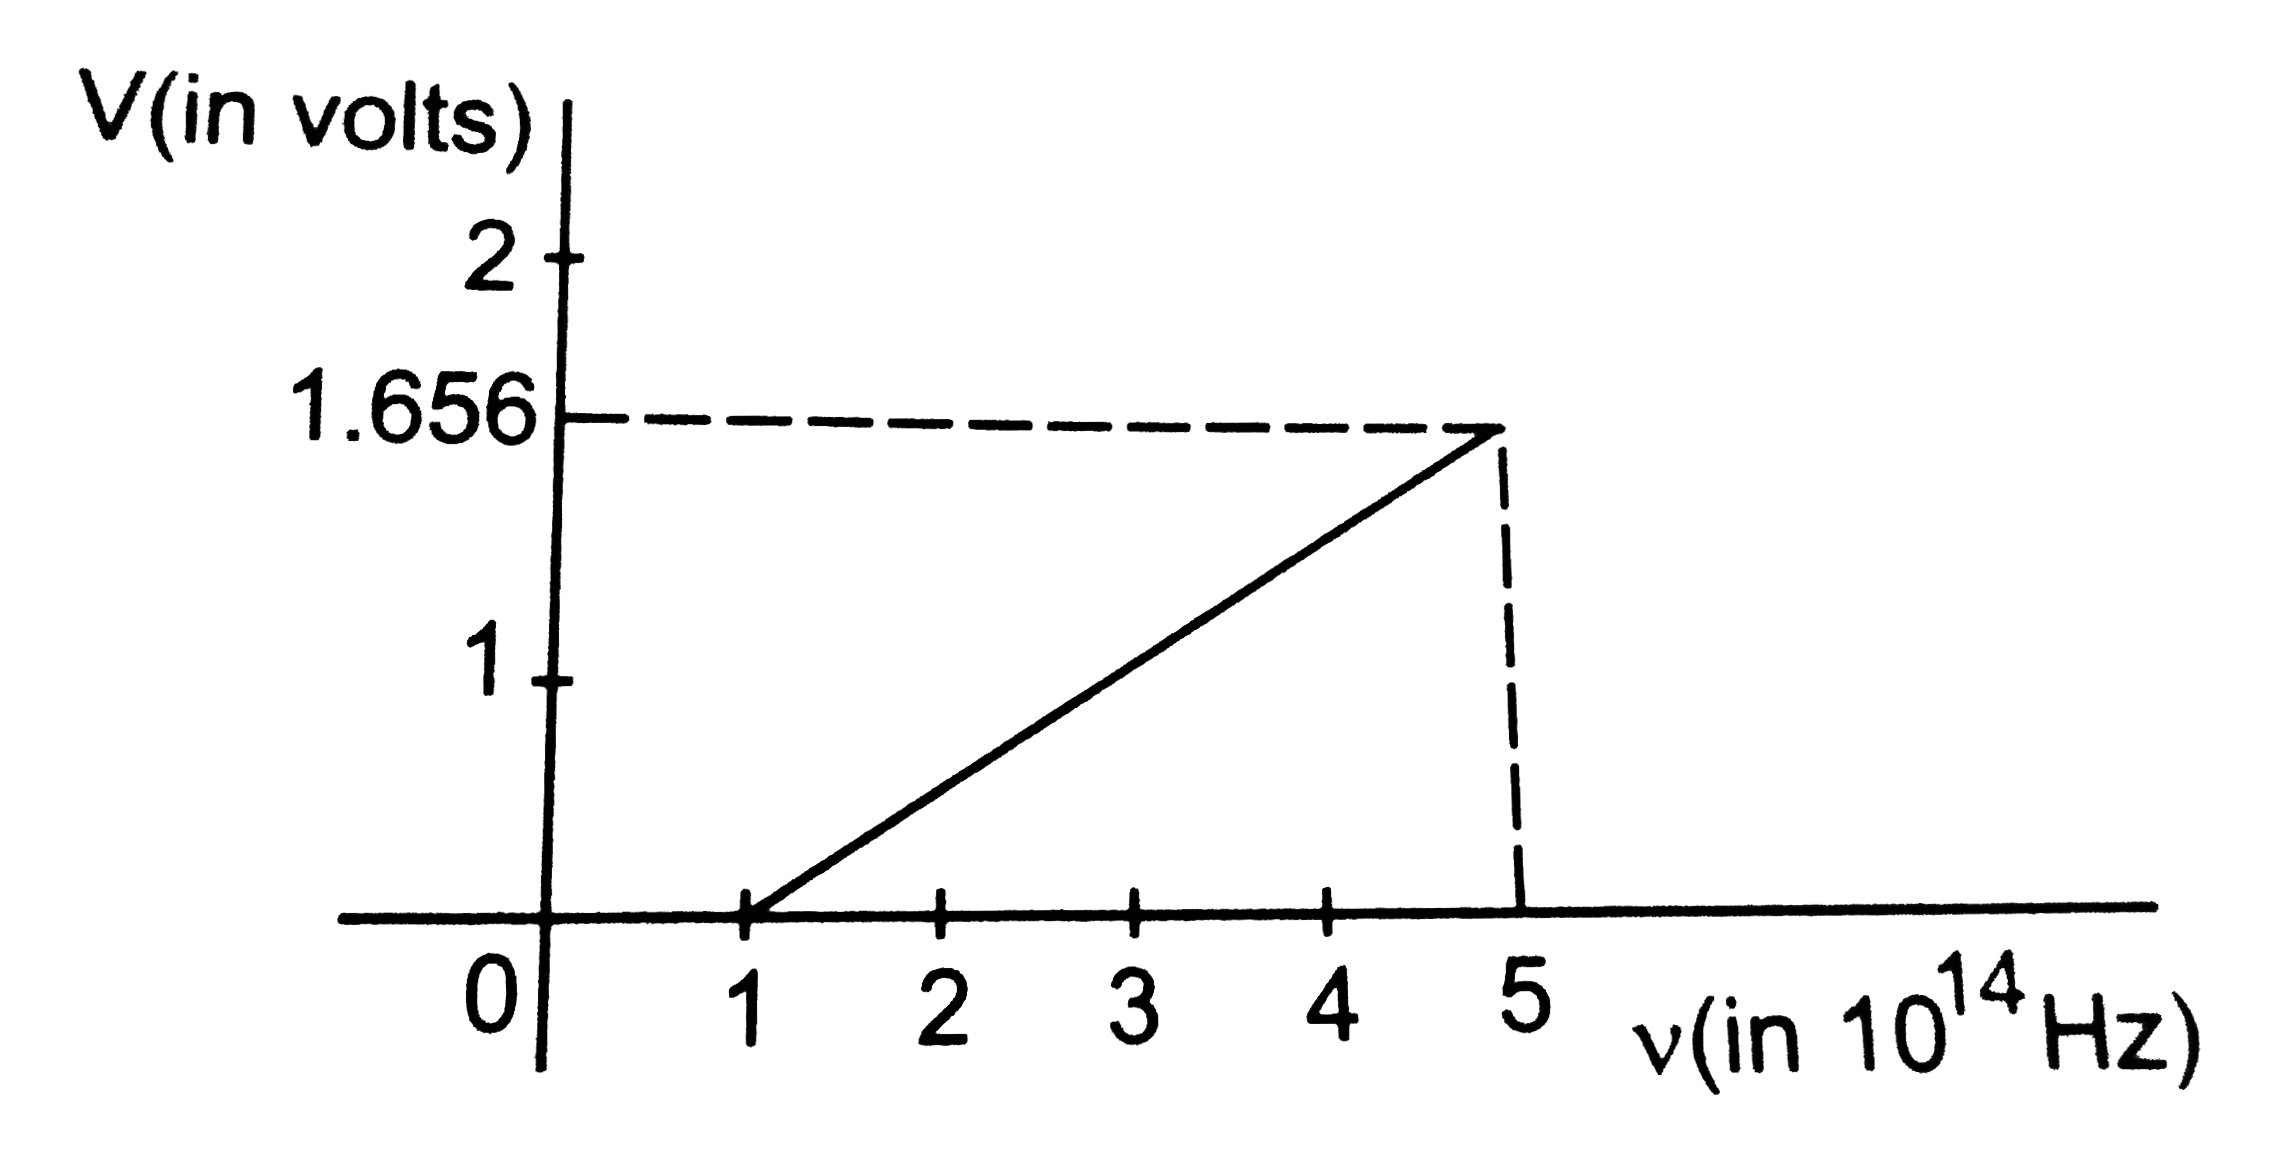
Using the graph shown in the figure for stopping potential vs. the incident frequency of photons, calculate Planck.s constant.
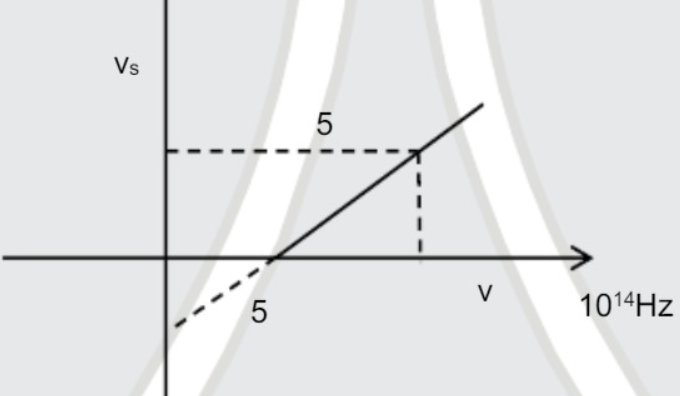
View SolutionGraph between stopping potential and frequency of photon is given in figure
_2019_CBT7_E01_021_Q01.png)
Find out work function of metal:
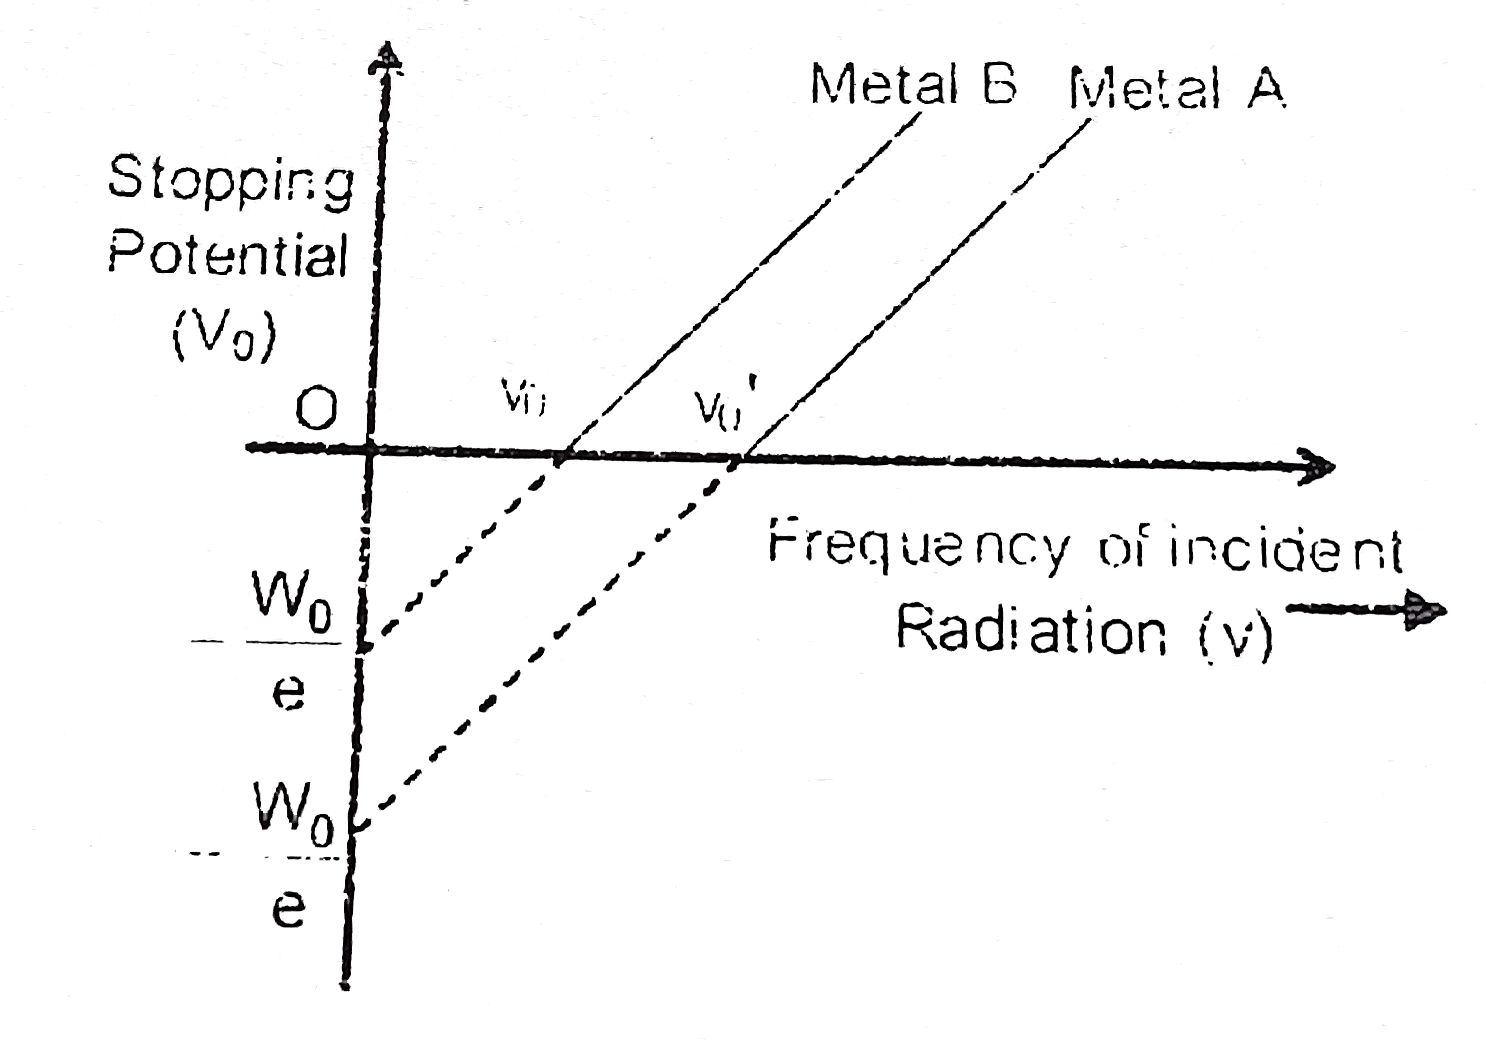
View SolutionThe graph shows variation of stopping potential V0 versus frequency of incident radiation v for two photosensitive metals A and B. Which of two metals has higher threshold frequency and why?

View SolutionFigure is the plot of the stopping potential versus the frequency of the light used in an experiment on photoelectric effect. Find (a) the ratio h/e and (b) the work function.

View SolutionGraph between stopping potential and frequency of light as shown find the work function

View SolutionSketch the graphs, showing the variation of stopping potential Vs with frequency v of the incident radiations for two photosensitive materials A and B having threshold frequencies v0>v'0 respectively.
(i) which of the two metals A or B has higher work function?
(ii) What information do you get from the slope of the graphs?
(iii) What does the value of the intercept of graph A on the potential axis represent?
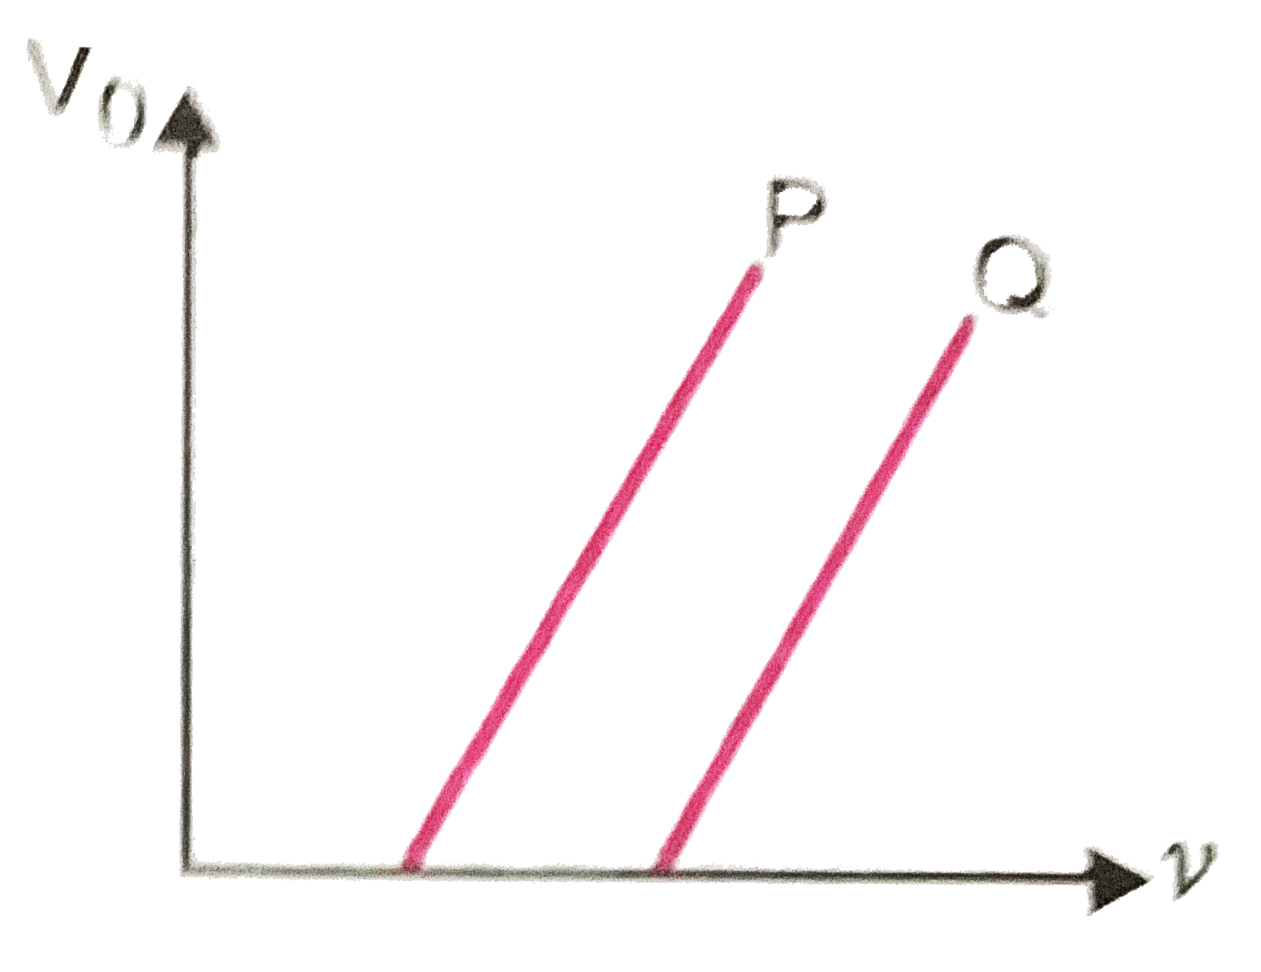
View SolutionFig. shows the variation of stopping potential V0 with the frequency v of the incident radiation for two photosensitive metal P and Q:
(i) Explain which metal has smaller threshold wavelength

(ii) Explain, giving reason, which metal emits photoelectrons having smaller kinetic energy, for the same wavelength of incident radiation.
(iii) If the distance between the light source and metal P is doubled, how will the stopping potential change.
View SolutionPlot a graph showing the variation of stopping potential with the frequency of incident radiation for two different photosensitive having work functions W1andW2(W1>W2) . On what factors does the (i) slope and (ii) intercept of the lines depend ?
View SolutionThe slope of the graph drawn between stopping potential and frequency of incident radiation will be
View SolutionWhen a high frequency electromagnetic radiation is incident on a metallic surface, electrons are emitted from the surface. Energy of emitted photoelectrons depends only on the frequency of incident electromagnetic radiation and the number of emitted electrons depends only on the intensity of incident light.
Einstein's protoelectron equation [Kmax=hv−ϕ} correctly explains the PE, where υ= frequency of incident light and ϕ= work function.
Q. The slope of the graph between stopping potential and frequency is [here h is the Planck's constant and e is the charge of an electron] is
View Solution
