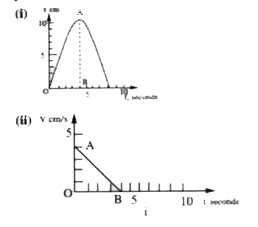
The graphs in (i) and (ii) show the S-t graph and V -t graph of a body. Are the motions shown in the graphs represented by OAB the same ?
 Solution in Telugu
The motion shown by the two graphs are not same.
(i) In the given s-t graph OA, is a uniform retardation motion.
Here, displacement =(average velocity)×(time)
10=(u+02)×4∴u=5ms−1
using v2−u2=2as
a=−1.25ms−2
(ii) In the given V-t graph,
OA is a uniform retardation of motion
a=slope of the line =OAOB=−4ms−14s=−1ms−2
Thus the two graphs, even through represent uniform retardation motions, the magnitudes are not equals.
Topper's Solved these Questions
- MOTION IN A STRAIGHT LINEBOOK - AAKASH SERIESCHAPTER - MOTION IN A STRAIGHT LINEEXERCISE - Problems Based On Calculus
28 Videos
- MOTION IN A STRAIGHT LINEBOOK - AAKASH SERIESCHAPTER - MOTION IN A STRAIGHT LINEEXERCISE - Exercise 1A
62 Videos
- MOTION IN A PLANE BOOK - AAKASH SERIESCHAPTER - MOTION IN A PLANE EXERCISE - Practice Exercise
84 Videos
- NEWTONS LAWS OF MOTION BOOK - AAKASH SERIESCHAPTER - NEWTONS LAWS OF MOTION EXERCISE - ADDITIONAL PRACTICE EXERCISE PRACTICE SHEET (ADVANECED) (Matrix Matching Type Questions)
1 Video
Similar Questions
The motion of a particle along a straight line is described by the function s=6+4t2−t4
in SI units.Find the velocity ,acceleration ,at t=2s,and the average velocity during 3rd second.
View SolutionA particle starts from the origin ,goes along the x-axis to the point (20m,0) and then returns along the same line to the point (-20 m,0).The distance and displacement of the particle during the trip are
View SolutionA person runs along a circular path of radius 5m. Find the magnitude of the displacement if he runs all the way around the circle ?
View SolutionThe system shown in the figure is given an acceleration 'a' towards left. Assume all contact surfaces to be smooth (m: mass of the sphere) The magnitude of the contact force between wedge and sphere between wedge and sphere at A is xmg√3 then 'x' is

View Solution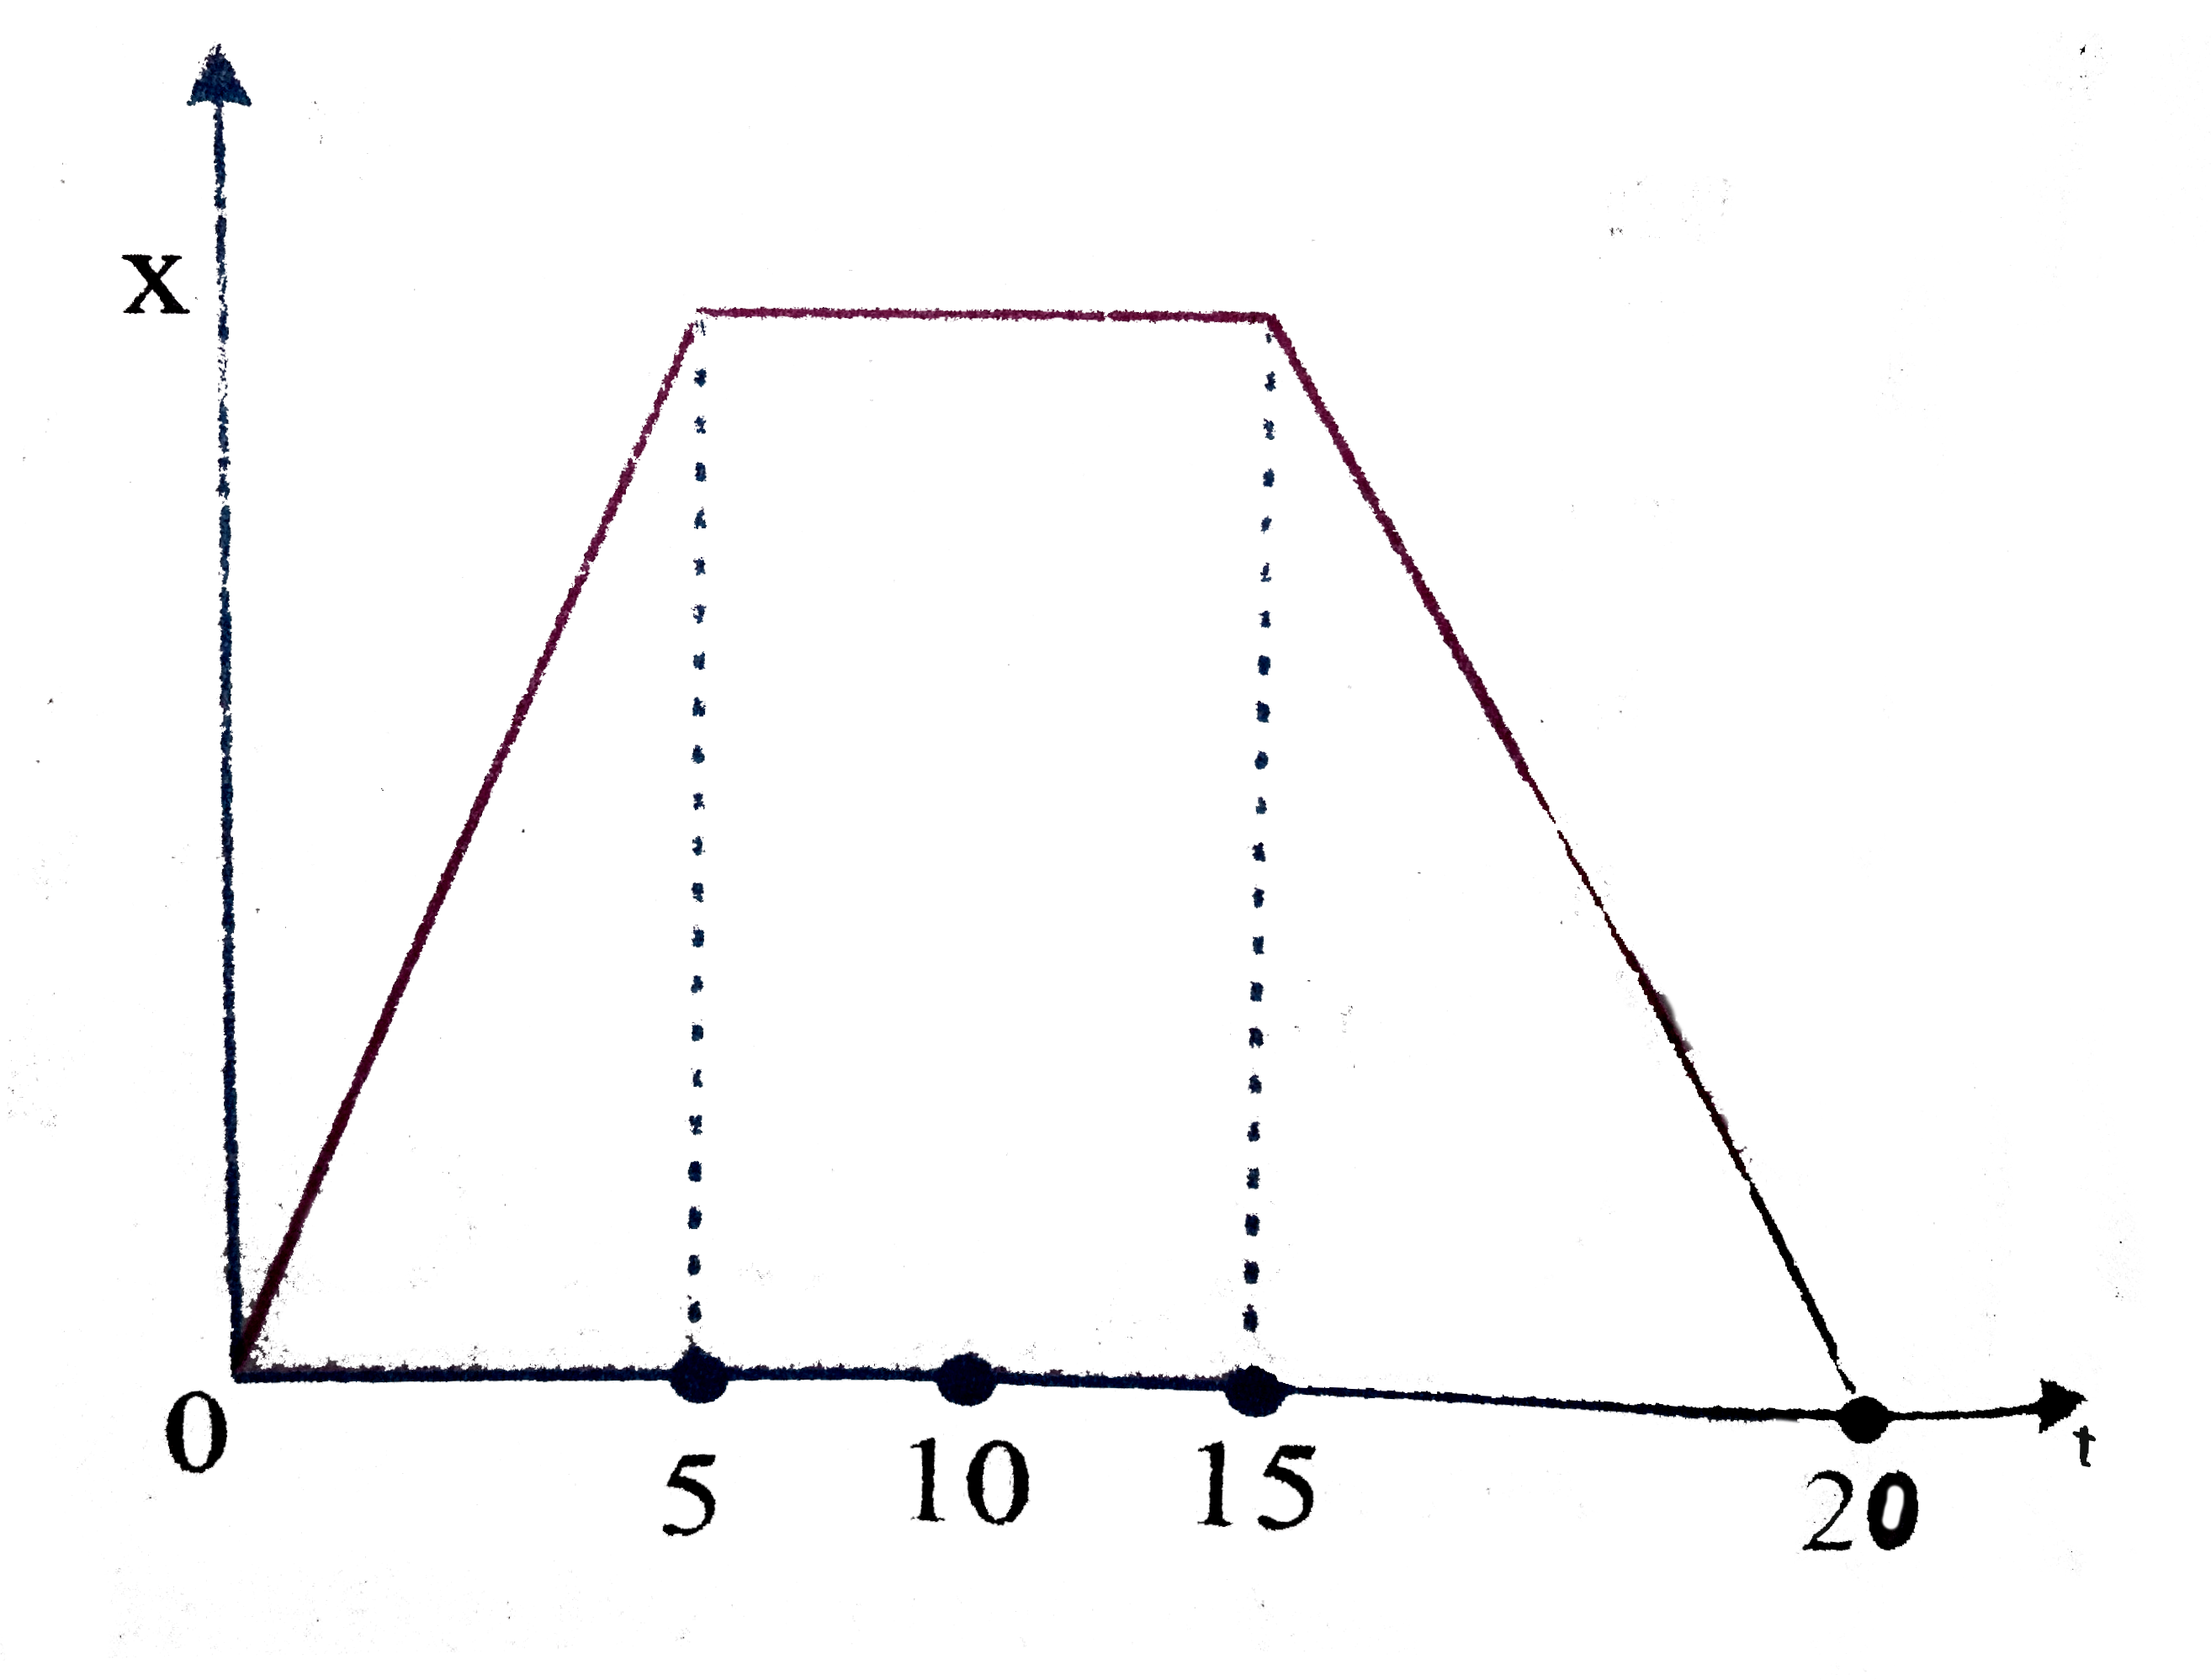
Figure shows the displacement tiime (x-t) graph of a body moving in a straight line which one of the graph shown in figure represents the velocity- time (v-t) graph of the motion of the body.
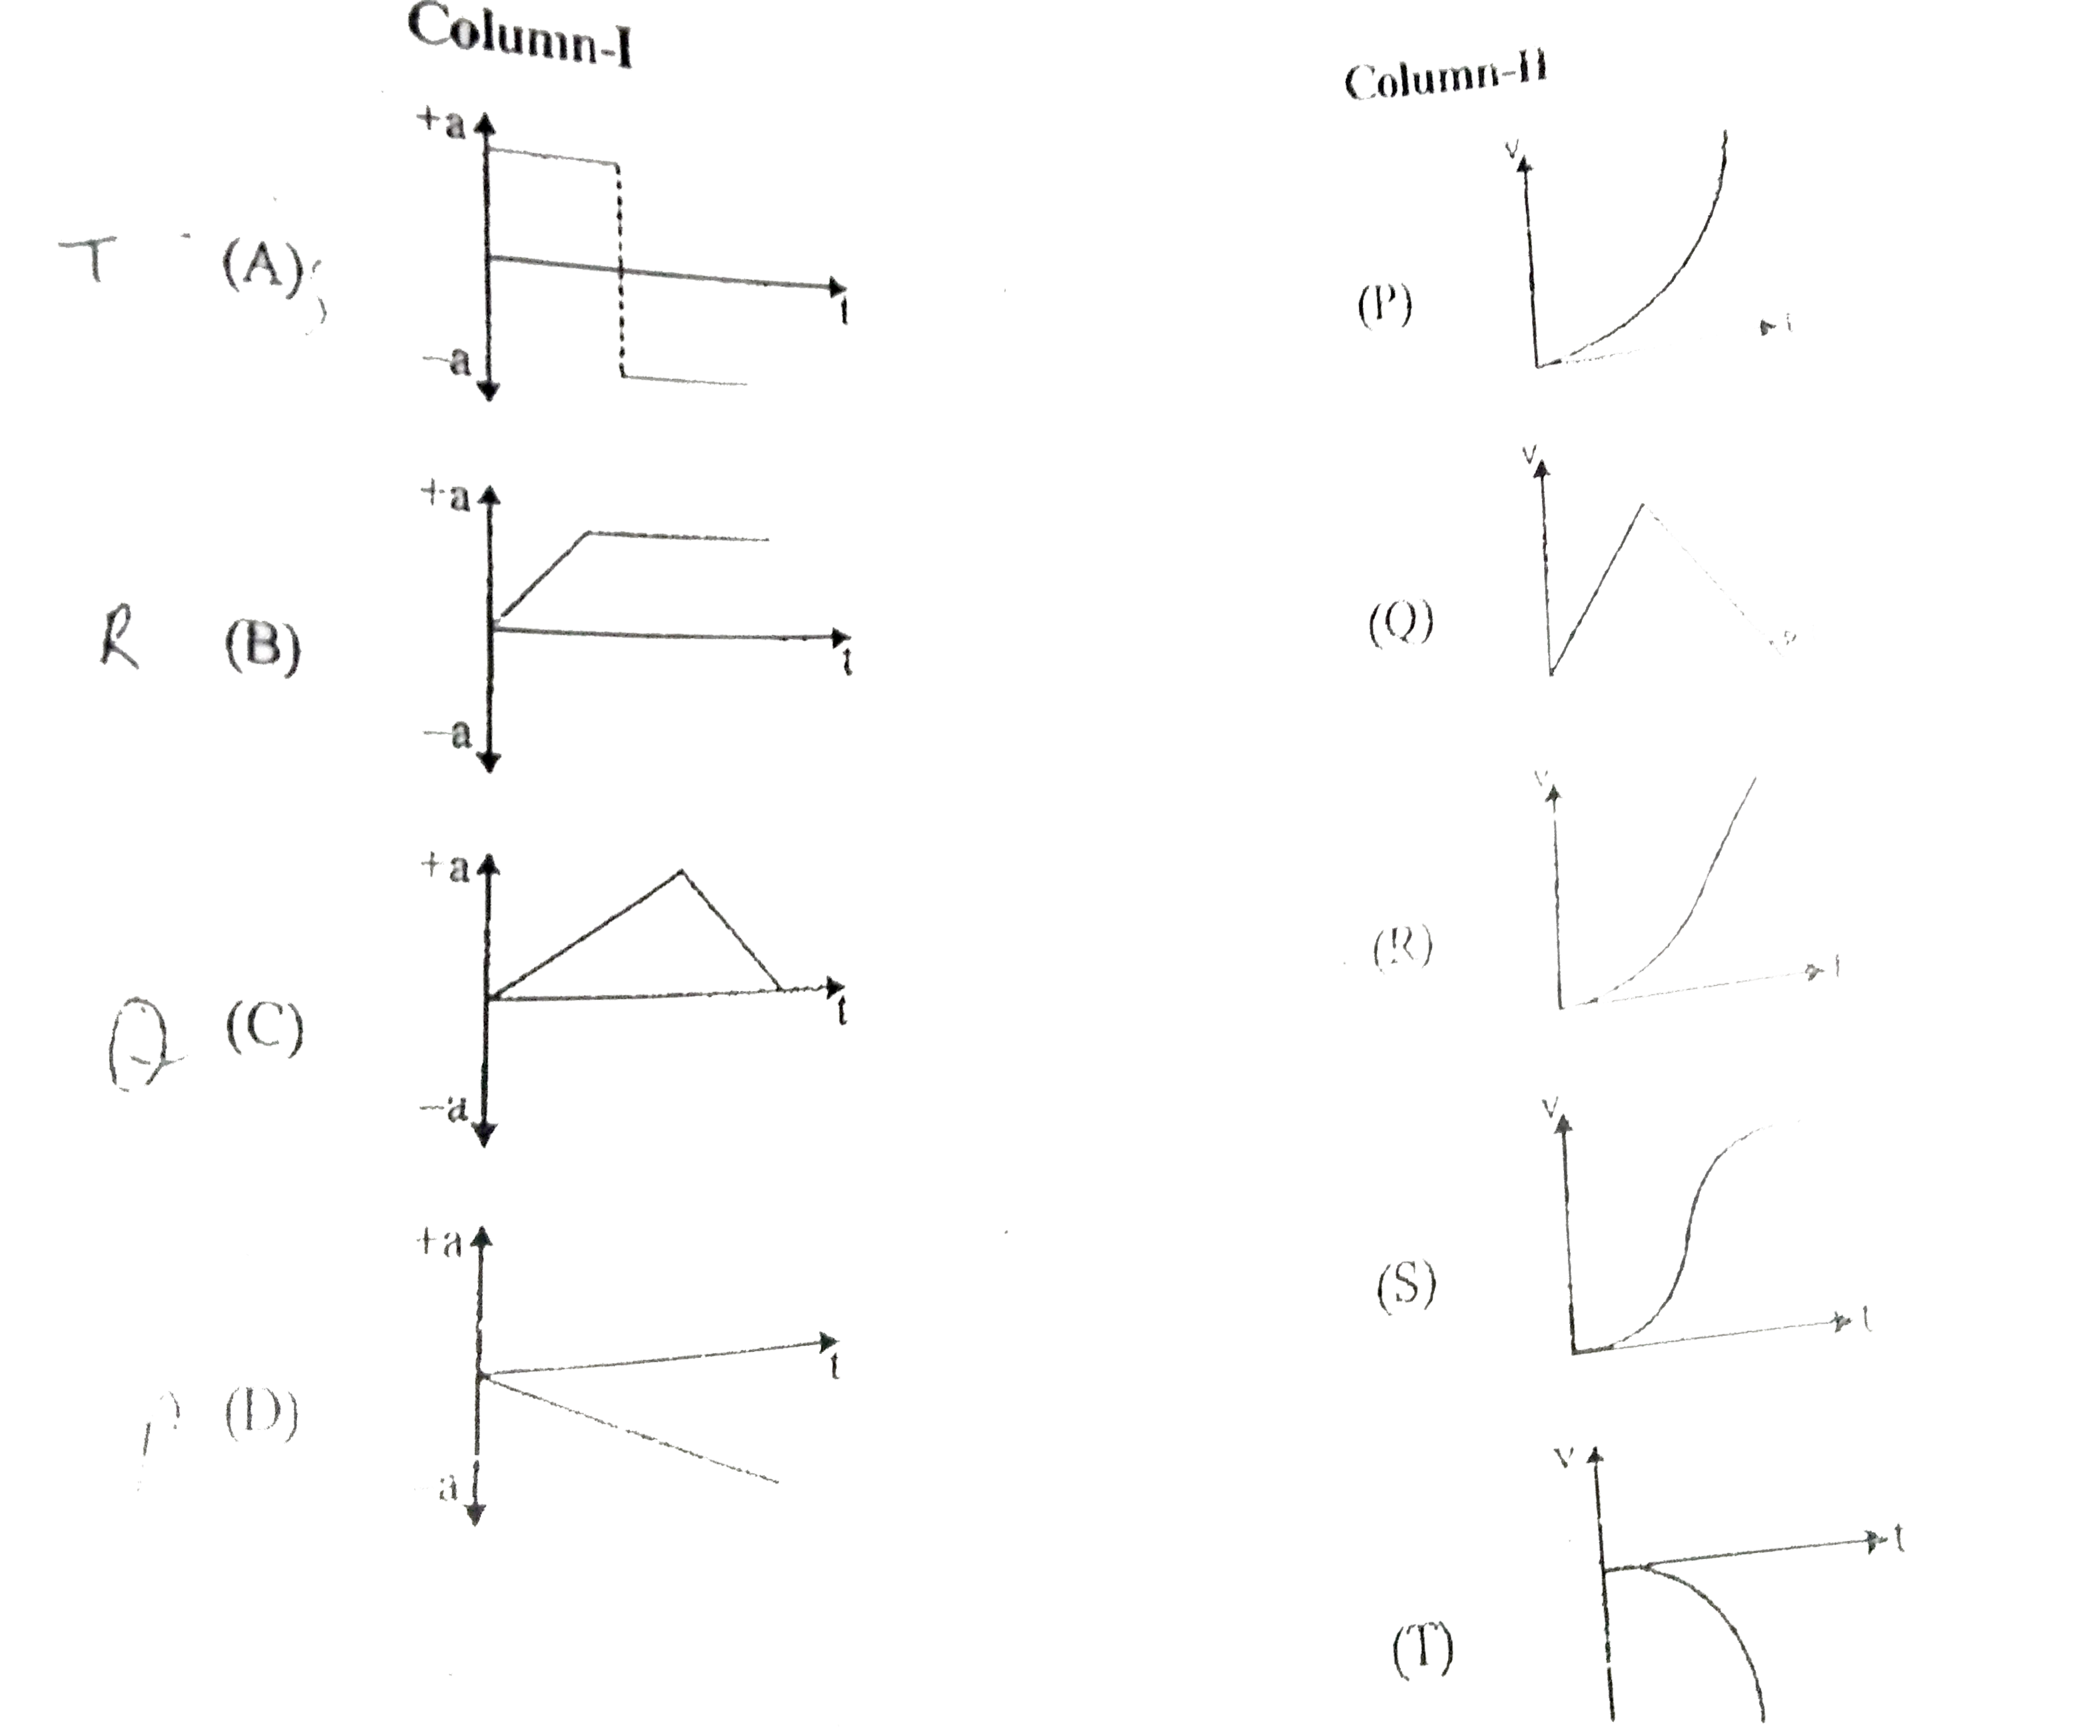
View SolutionColumn-I shows a-t graph and column-II shows v-t graph. Mathc the column-I and column-II.
View SolutionRepresent uniform motion on a v - t graph.
View SolutionRepresent uniform accelerated motion on a s-t graph.
View SolutionRepresent a body in uniform accelerated motion on a a - t graph.
View SolutionRepresent the following v - t graph on a a - t graph.
View SolutionRepresent the following a-t graph on a v-t graph.
View SolutionRepresent the following a-t graph on a v-t graph.
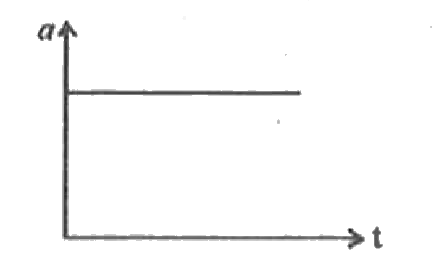
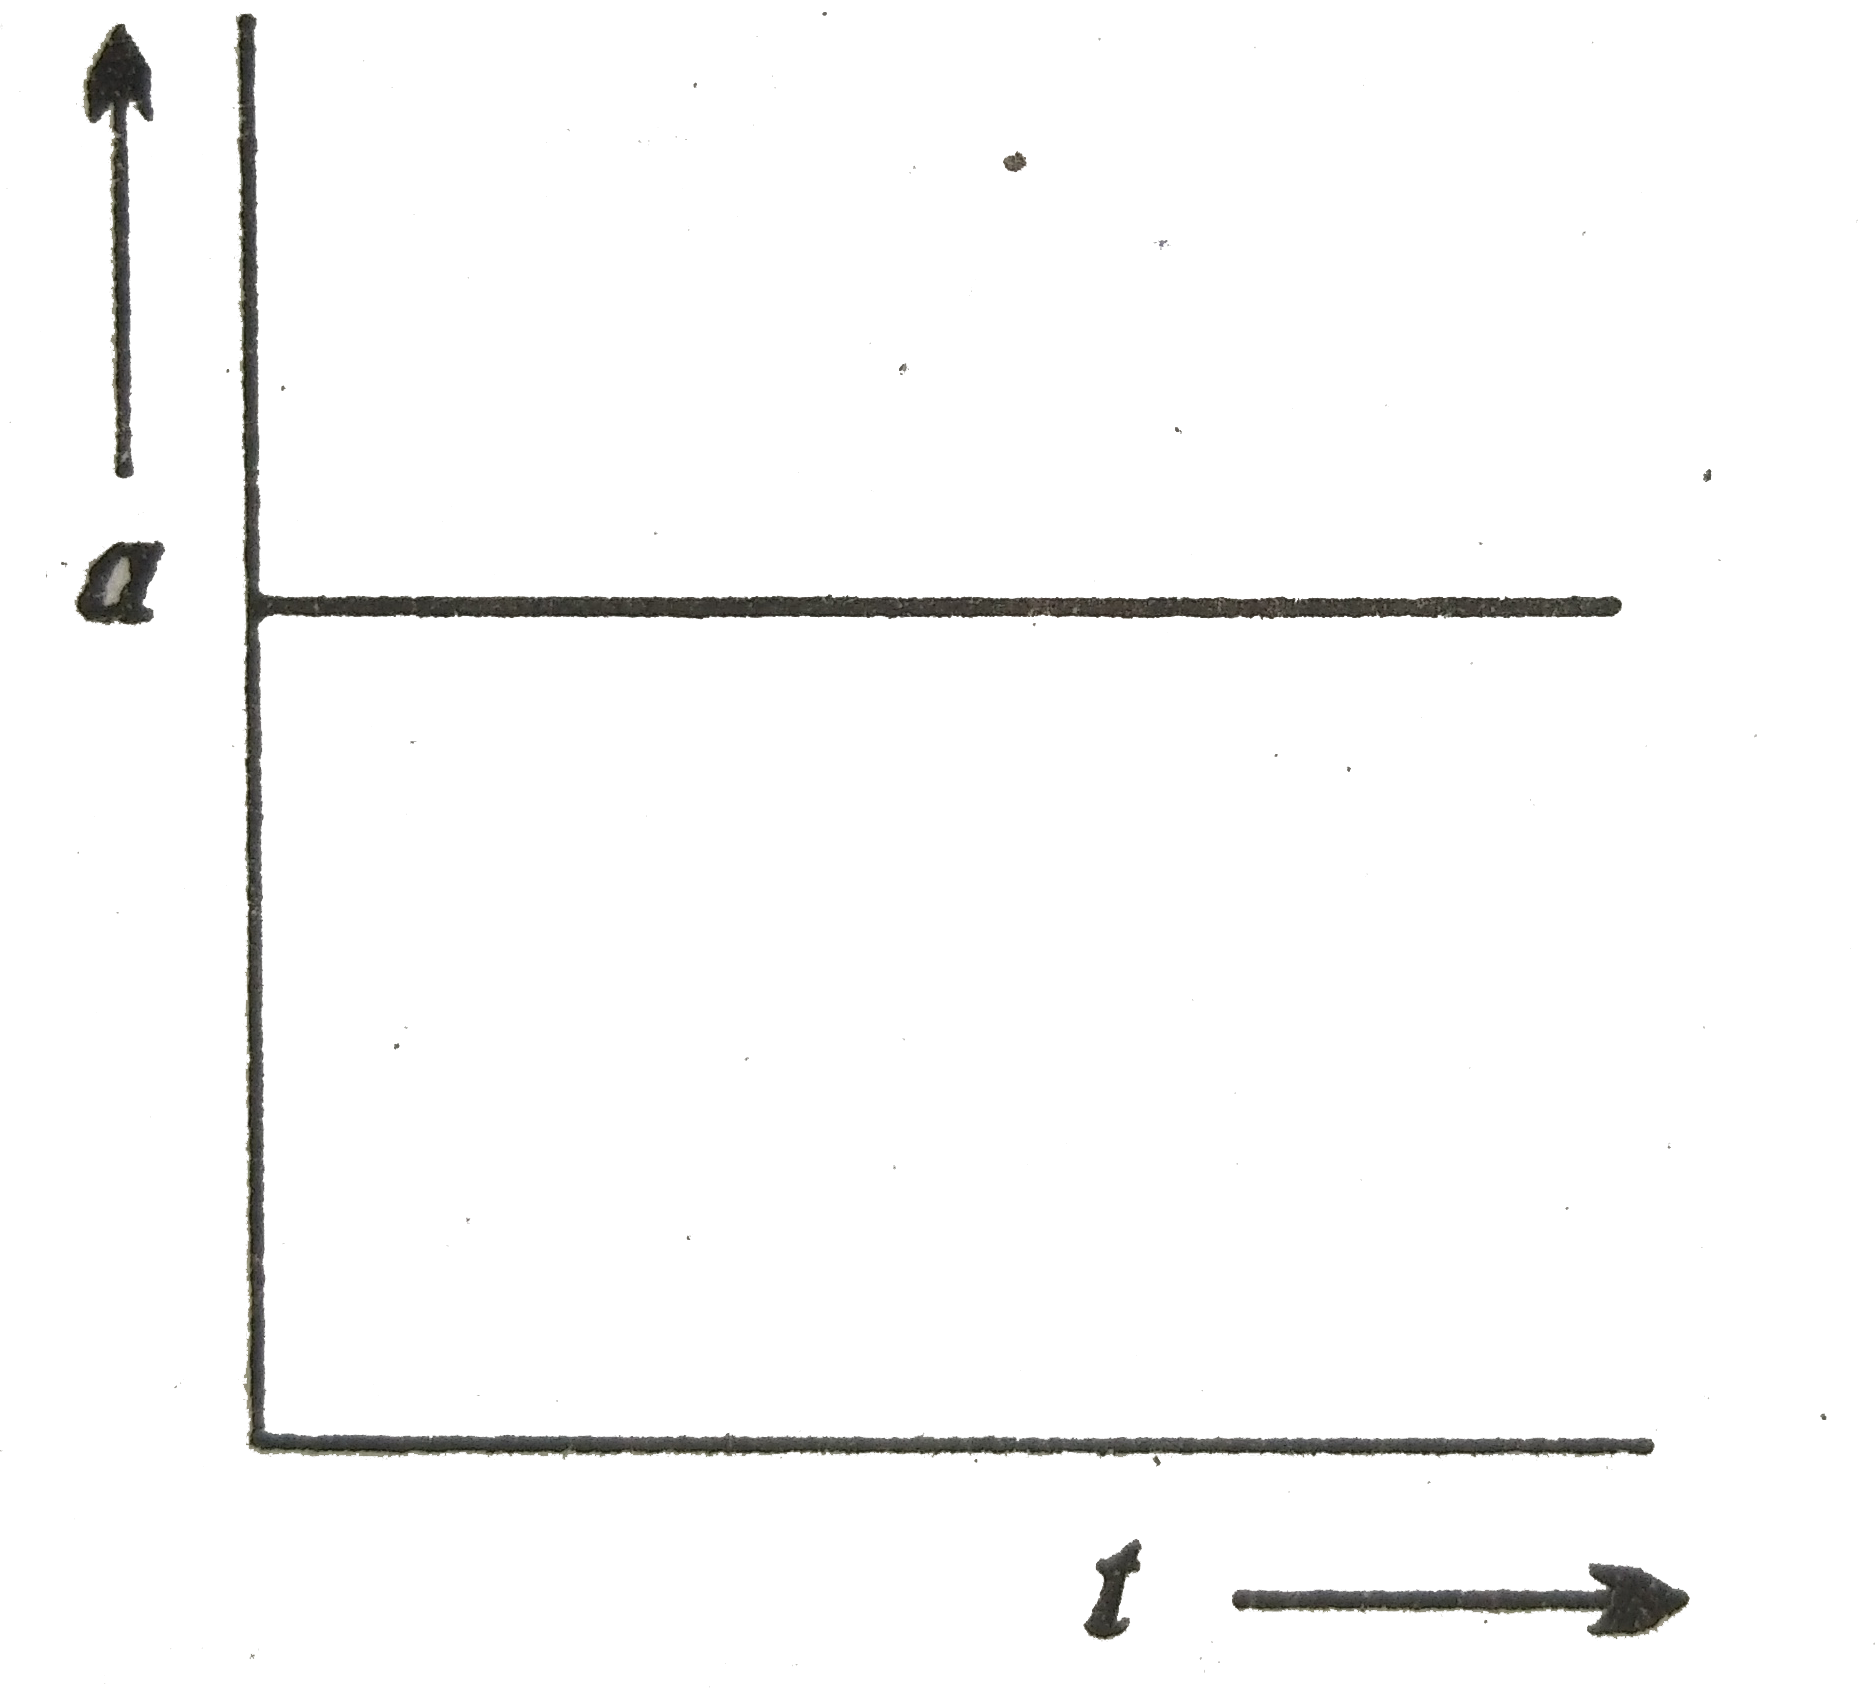
View Solutionसंलग्न चित्र में विरामावस्था से एक गतिमान पिंड के लिए a−t ग्राफ प्रदर्शित किया गया है। उस पिंड के लिए
(i) v−t ग्राफ तथा (ii ) x−t ग्राफ खींचिये।
View SolutionThe graph in figure shows the velocity v versus time t for a body. Which of the graphs shown in figure represents the correesponding acceleration versus time graphs ?
View SolutionThe graphs in (i) and (ii) show the S-t graph and V -t graph of a body. Are the motions shown in the graphs represented by OAB the same ?

View SolutionCorresponding to (p - T) graph as shown in figure, draw (a) P - V graph (b) V - T graph ( c) rho - T graph and (d) U - T graph.
View Solution
