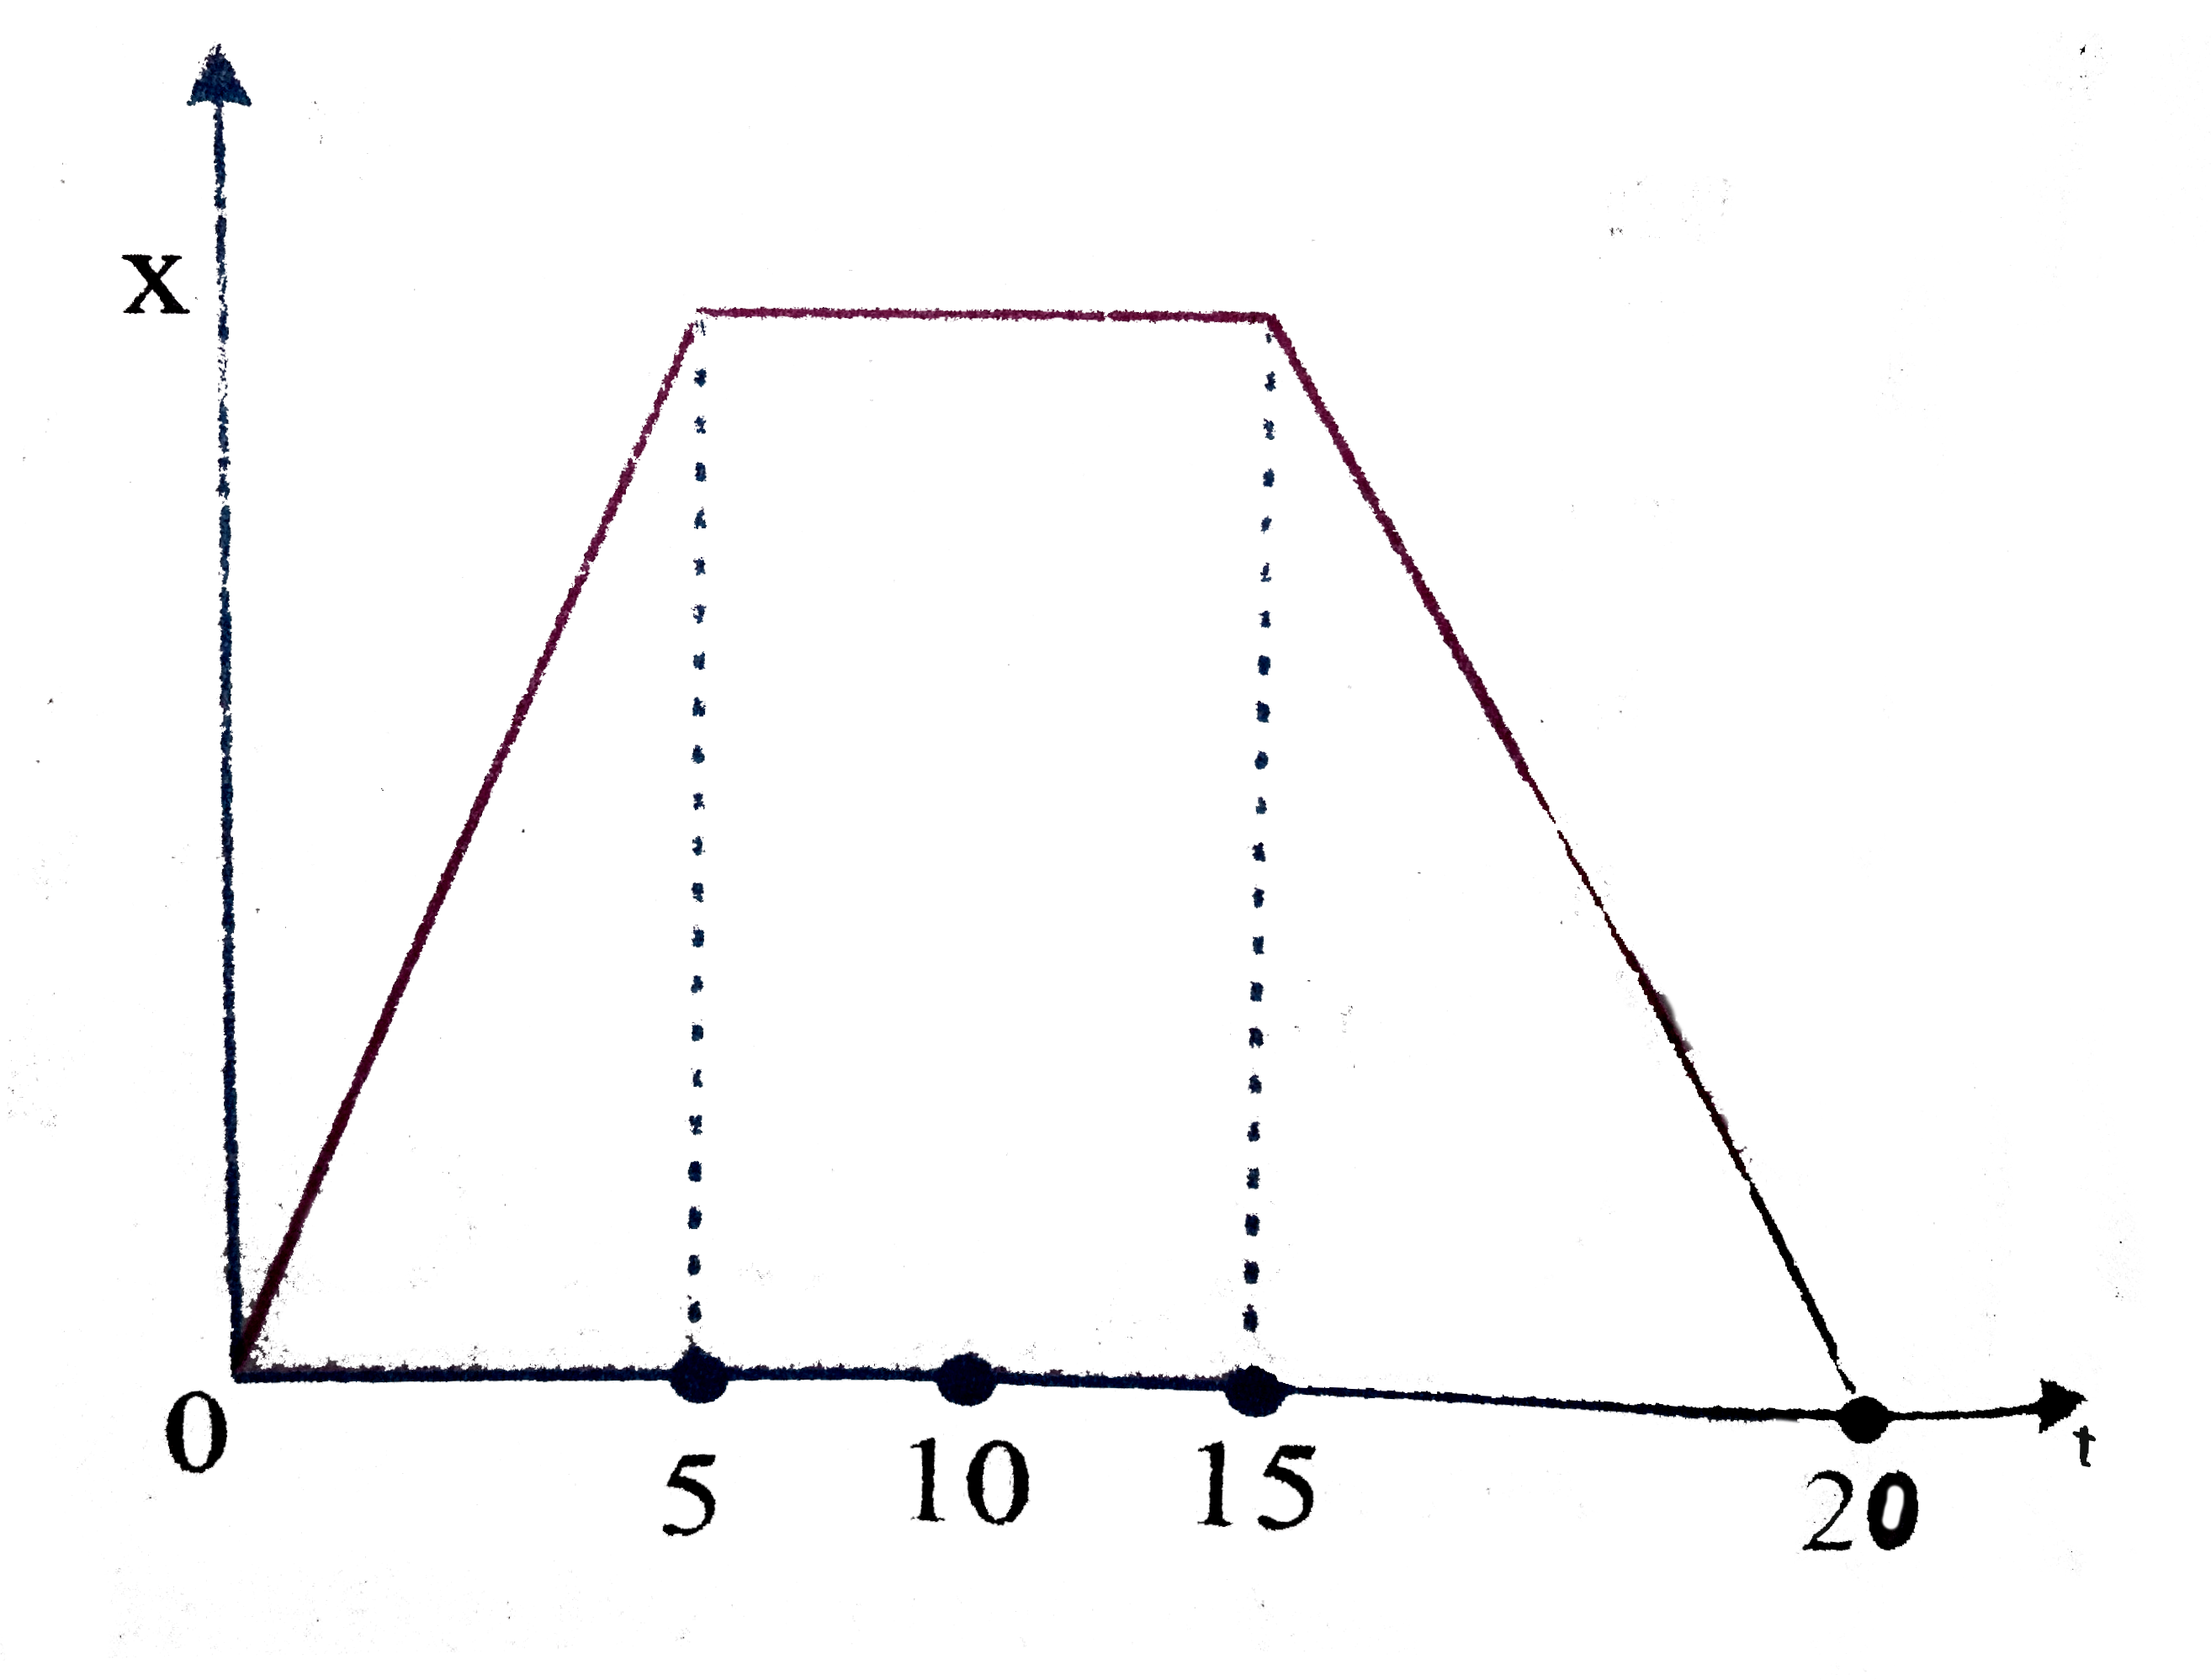
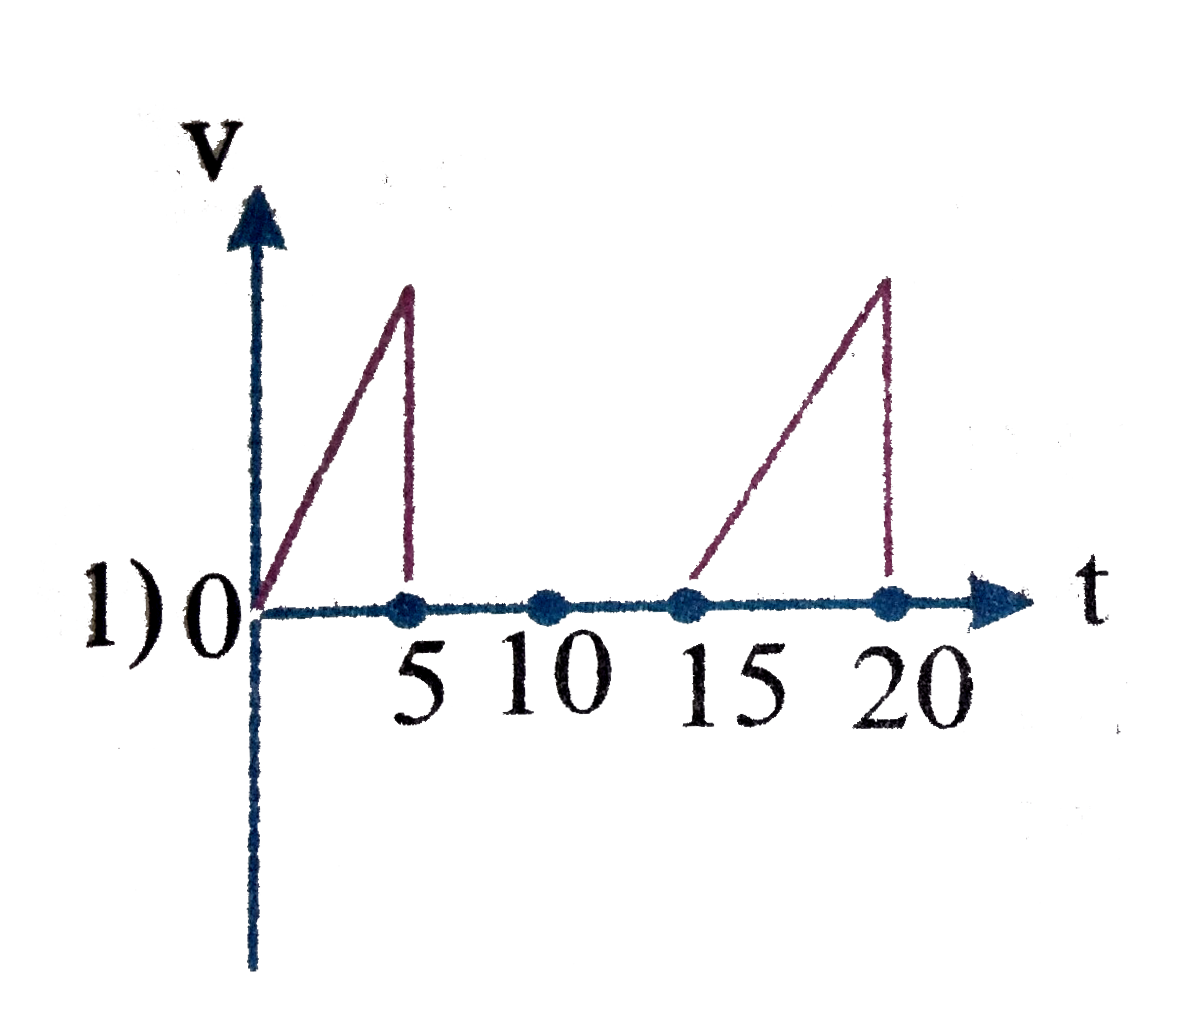
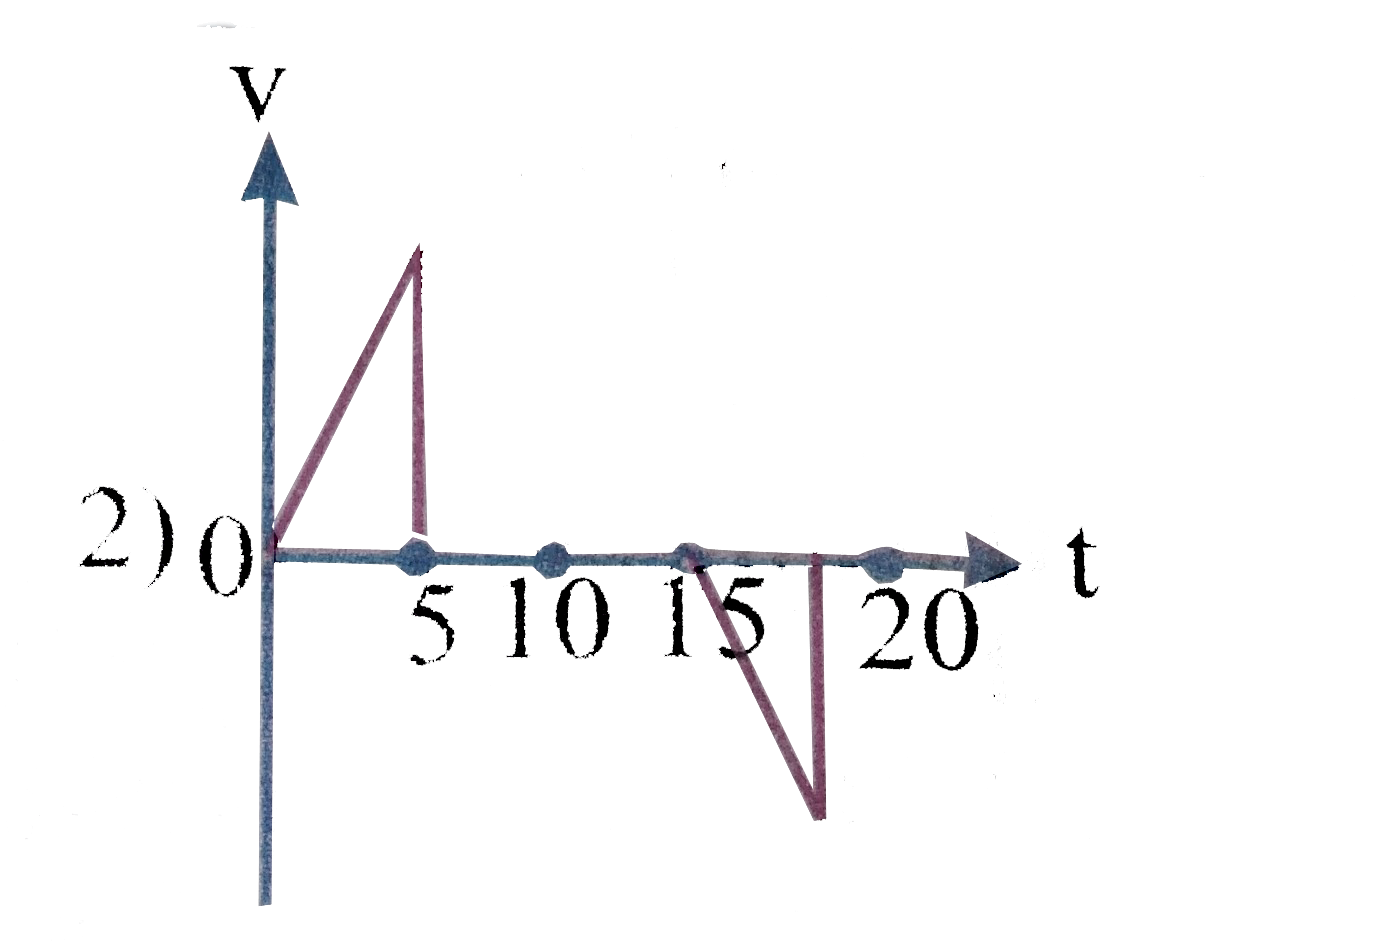
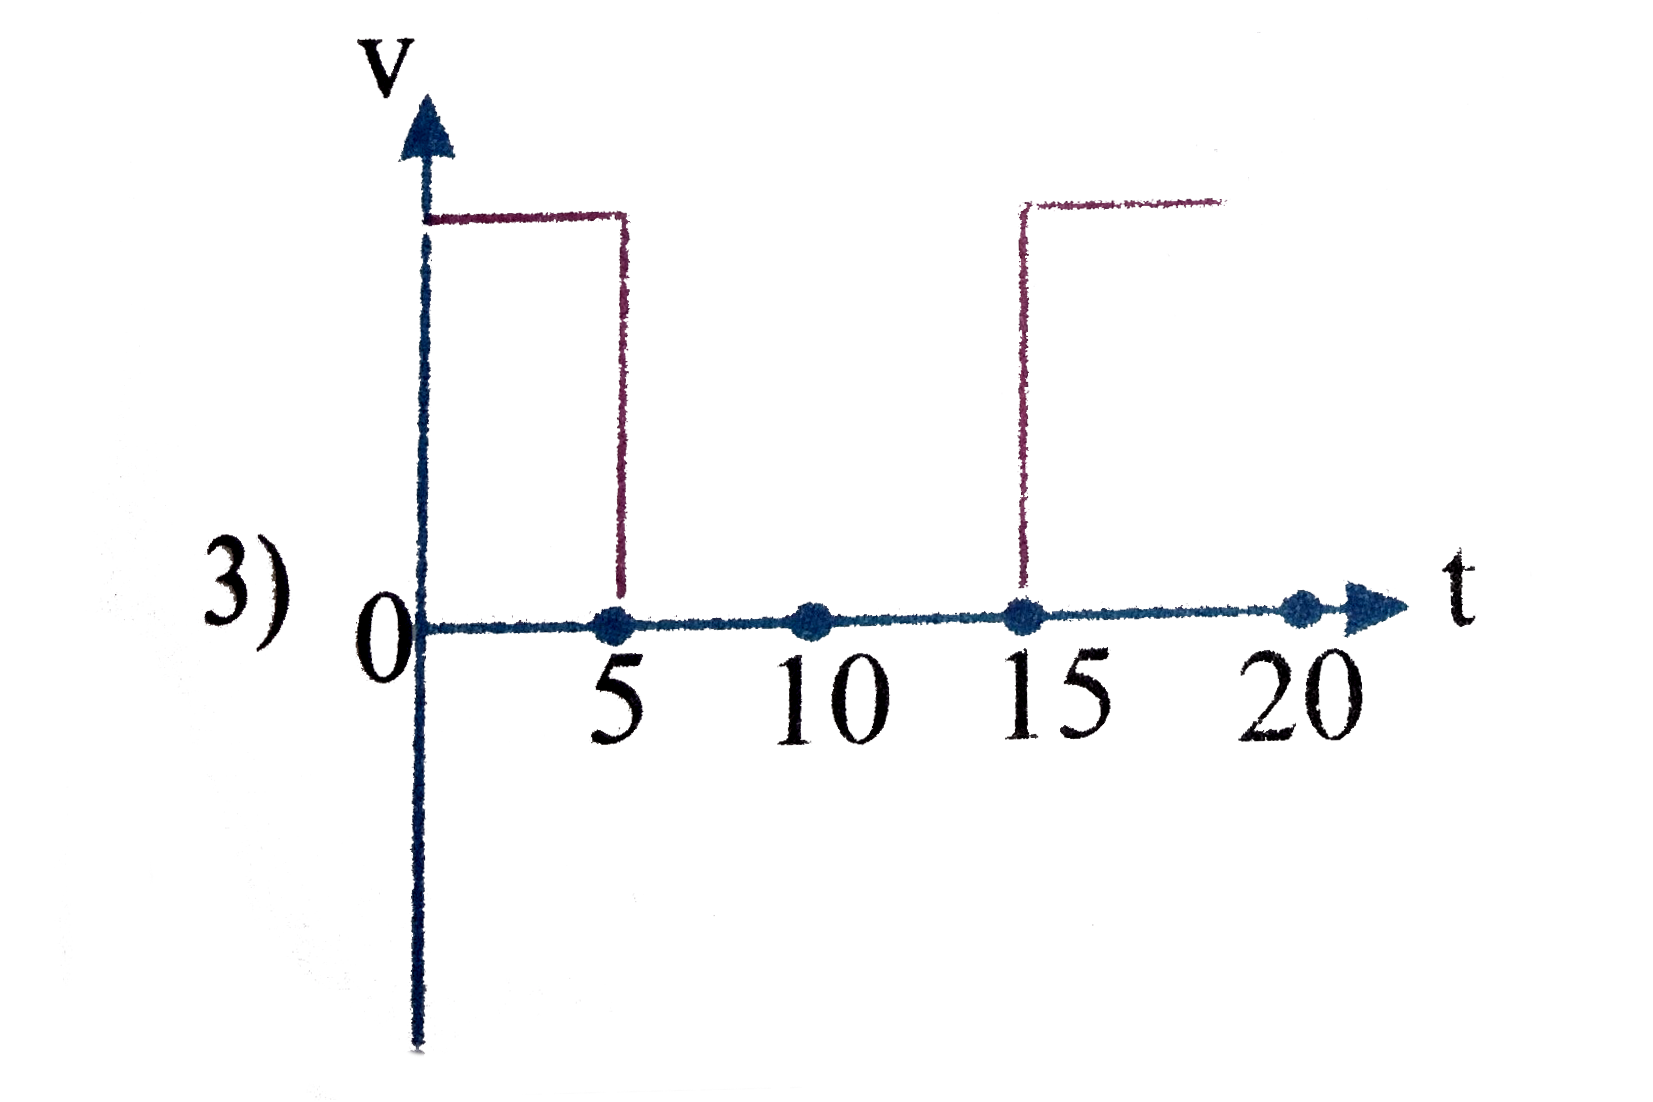
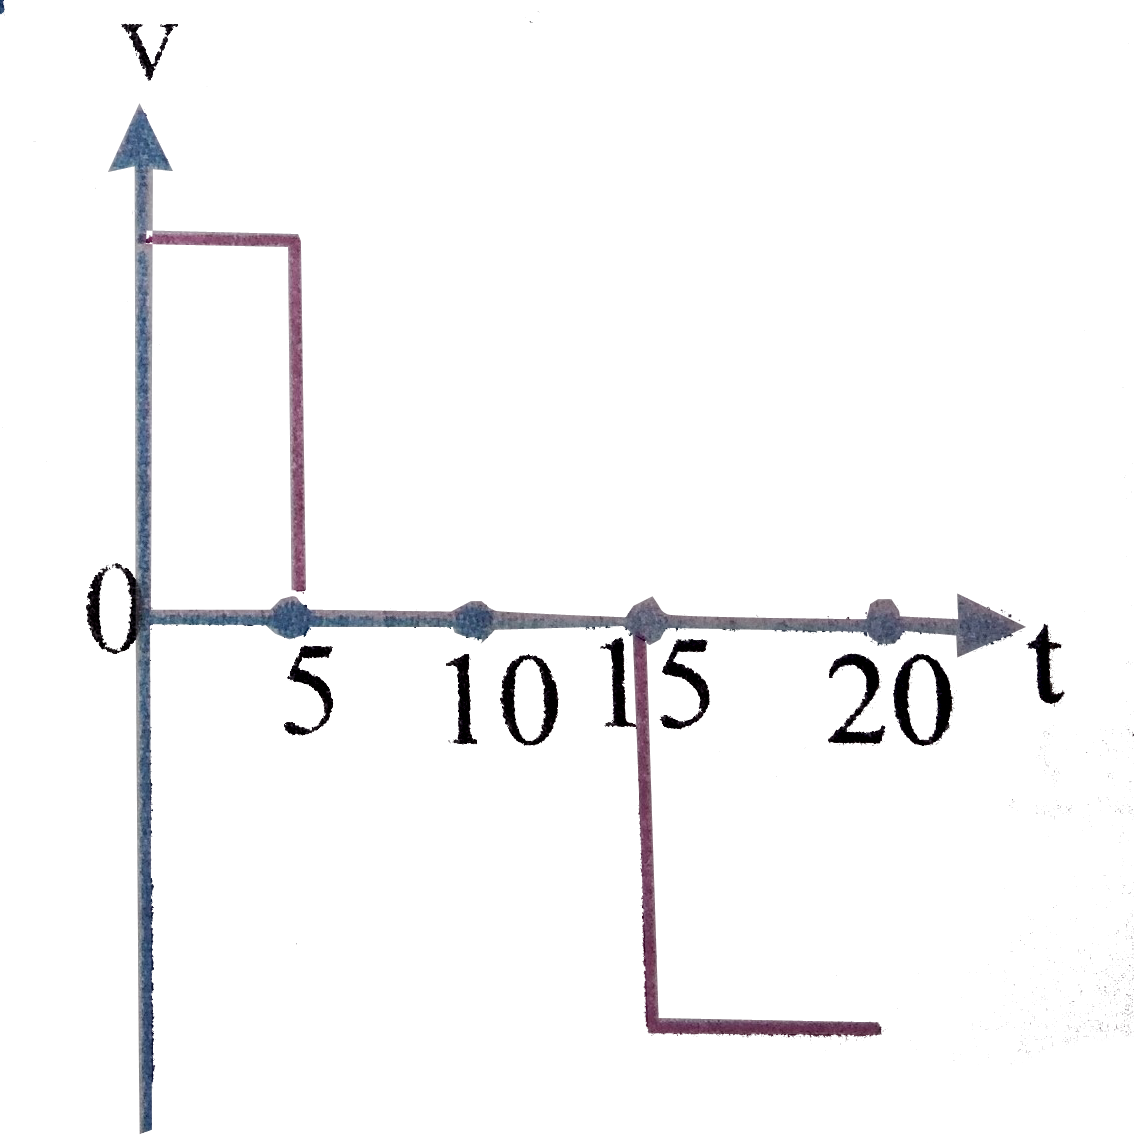
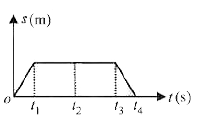
Figure shows the displacement tiime (x-t) graph of a body moving in a straight line which one of the graph shown in figure represents the velocity- time (v-t) graph of the motion of the body.
A
B
C
D
Video Solution
Text Solution
The correct Answer is:D
0 to 5s- velocity is +ve and constant
5 to 15s -slope is zero
15 to 20s-velocity −ve and constant
|
Topper's Solved these Questions
- MOTION IN A STRAIGHT LINEBOOK - NARAYNACHAPTER - MOTION IN A STRAIGHT LINEEXERCISE - Single Type Question
23 Videos
- MOTION IN A STRAIGHT LINEBOOK - NARAYNACHAPTER - MOTION IN A STRAIGHT LINEEXERCISE - More than One Option Question
7 Videos
- MOTION IN A STRAIGHT LINEBOOK - NARAYNACHAPTER - MOTION IN A STRAIGHT LINEEXERCISE - Level 2 C.W
25 Videos
- MOTION IN A PLANEBOOK - NARAYNACHAPTER - MOTION IN A PLANEEXERCISE - Level-II(H.W)
31 Videos
- NEWTONS LAWS OF MOTIONBOOK - NARAYNACHAPTER - NEWTONS LAWS OF MOTIONEXERCISE - PASSAGE TYPE QUESTION
6 Videos
Similar Questions
Knowledge Check
The velocity-time graph of a body moving in a straight line is shown in the figure.
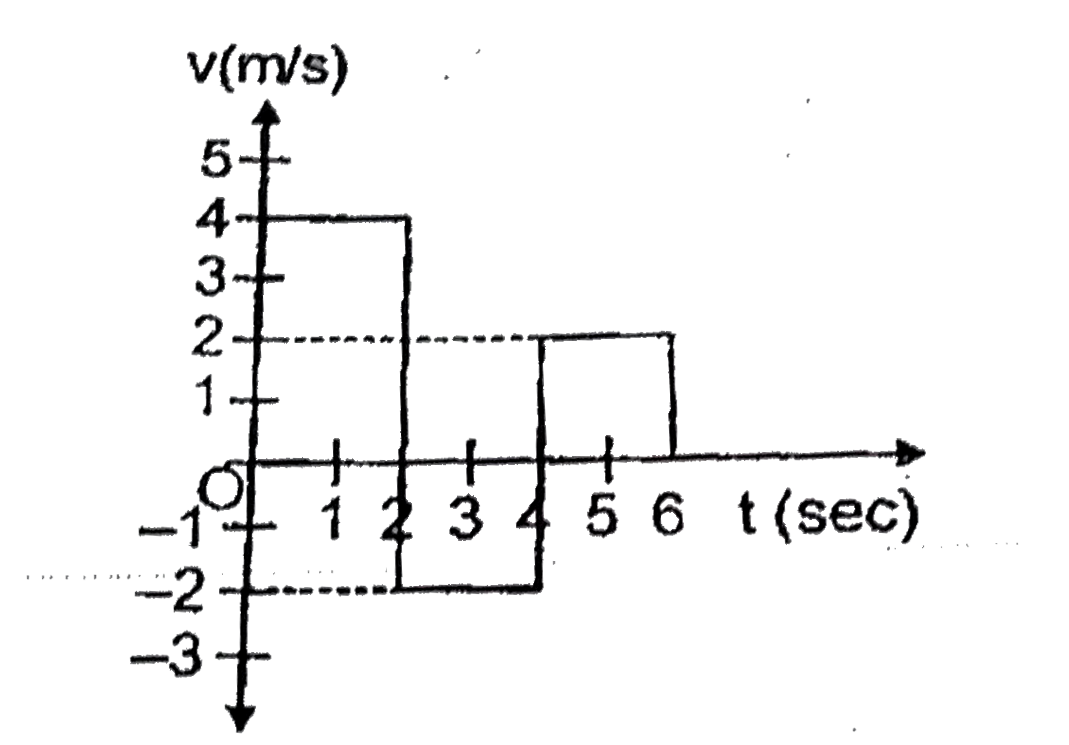 AThe magnitude of displacement of the body in 1st 2 sec is 8 mBThe magnitude of displacement of the body in 1st 4 sec is 4 mCThe distance travelled in 1st 2 sec is 8 mDThe distance travelled in 1st 4 sec is 12 m
Displacement time graph of a particle moving in a straight line is a shown in figure.
 Ain region A acceleration is positiveBin region B acceleration is negativeCin region C acceleration is positiveDin region D acceleration is negative
The displacement time graph of a body is shown in figure. The velocity-time graph of the motion of the body will be
 A
A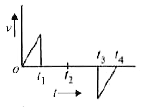 B
B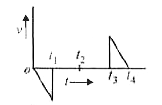 C
C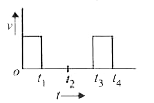 D
D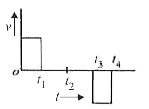
The velocity-time graph of a body moving in a straight line is shown below:

Which one of the following represents its acceleration time graph?
View SolutionVelocity displacement graph of a particle moving in a straight line is as shown in figure.

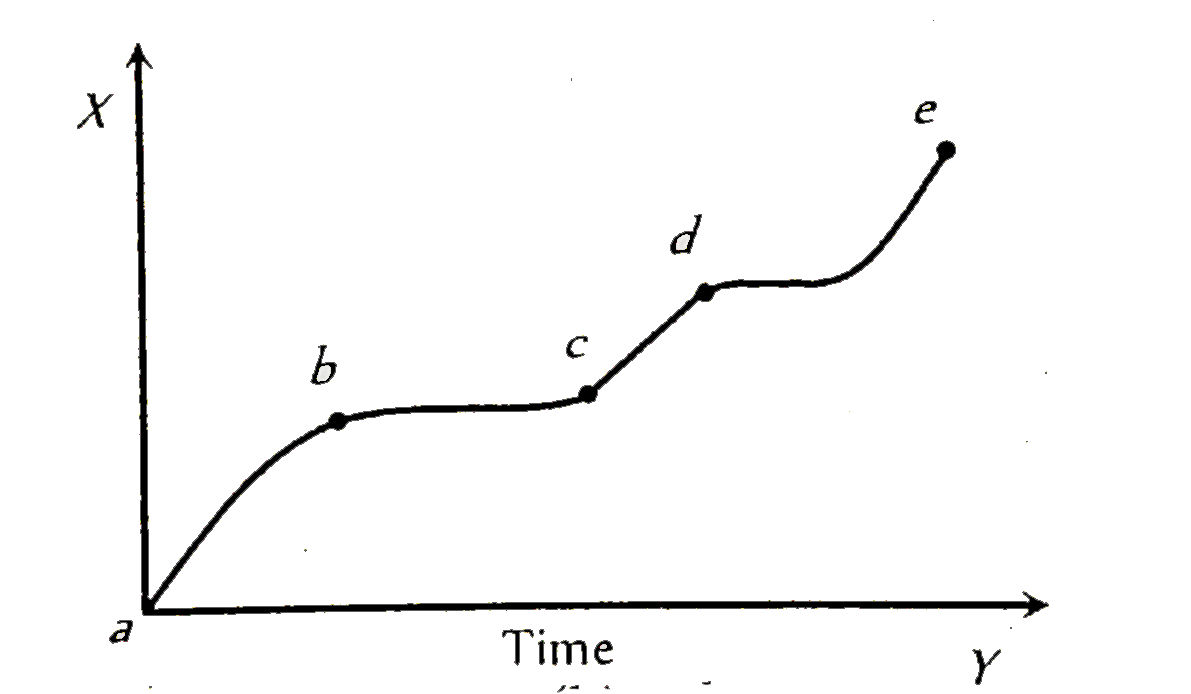
View SolutionThe displacement versus time graph for a body moving in a straight line is shown in figure. Which of the following regions represents the motion when no force is acting on the body
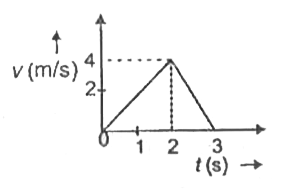
View SolutionThe velocity versus time graph of a body moving in a straight line is as shown in the figure below
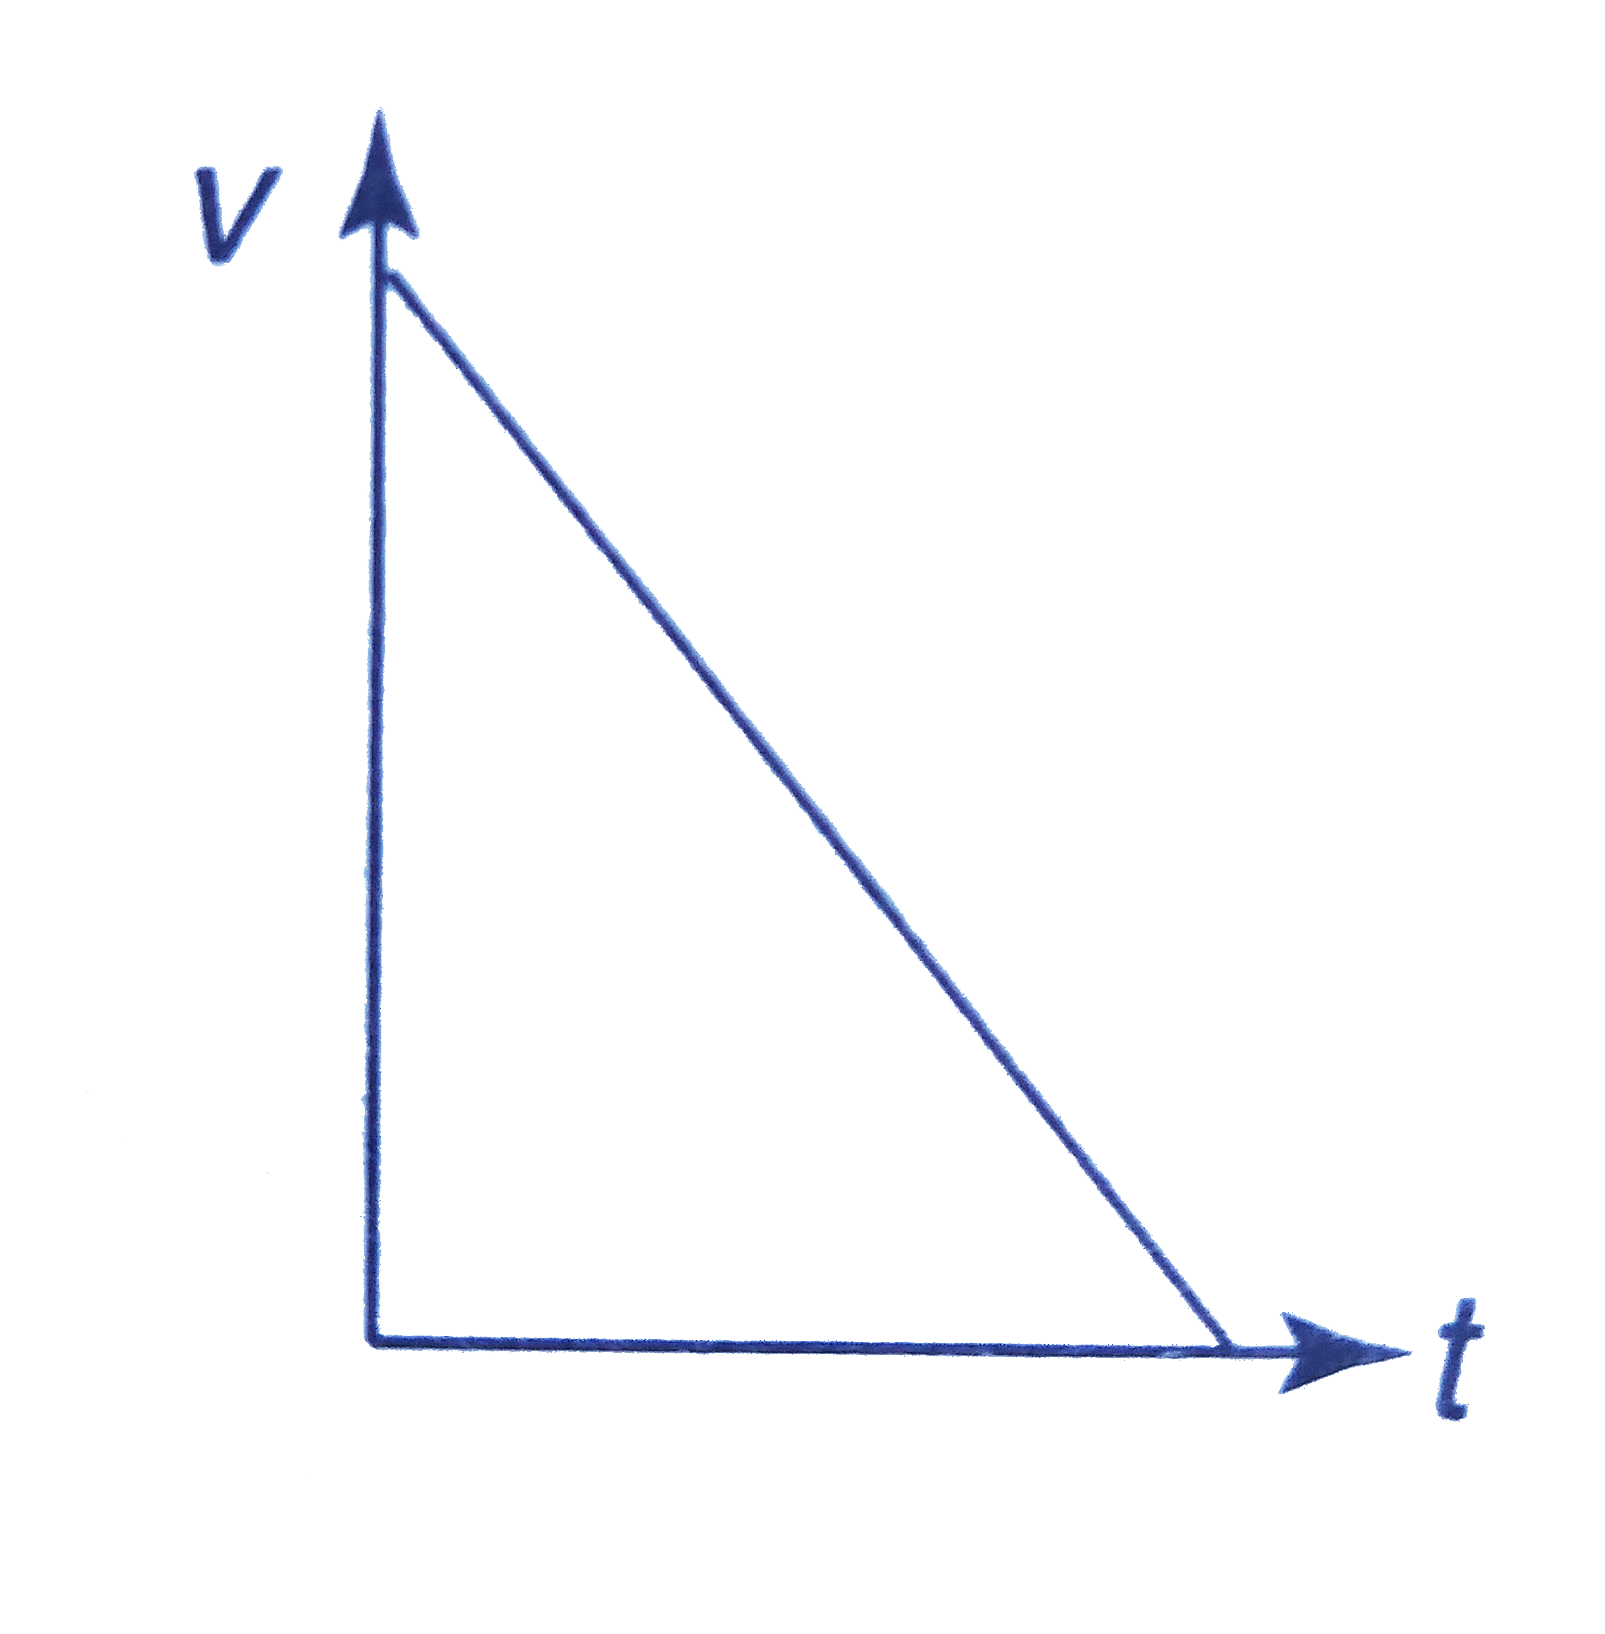
View SolutionFigure gives the velocity-time graph. This shows that the body is.
View Solution

