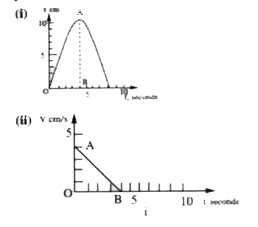
The graphs in (i) and (ii) show the S-t graph and V -t graph of a body. Are the motions shown in the graphs represented by OAB the same ?
 Solution in Telugu
The motion shown by the two graphs are not same.
(i) In the given s-t graph OA, is a uniform retardation motion.
Here, displacement =(average velocity) x (time)
∴10=(u+02)×4
∴u=5ms−1
using v2−u2=2as
0−52=2a(10)
a=−1.25ms−2
(ii)In the given V-t graph
OA is a uniform retardation of motion
a =slope of the line -OAOB=−4ms−14s=−1ms−2
Thus the two graphs even though represent uniform retardation motions, the magnitudes are not equal.
Topper's Solved these Questions
- MOTION IN A STRAIGHT LINE Book:AAKASH SERIESChapter:MOTION IN A STRAIGHT LINE Exercise:EXERCISE -I
Explore 58 Videos
- MOTION IN A STRAIGHT LINE Book:AAKASH SERIESChapter:MOTION IN A STRAIGHT LINE Exercise:EXERCISE -II
Explore 80 Videos
- MOTION IN A PLANEBook:AAKASH SERIESChapter:MOTION IN A PLANEExercise:QUESTION FOR DESCRIPTIVE ANSWER
Explore 7 Videos
- MOVING CHARGES AND MAGNETISMBook:AAKASH SERIESChapter:MOVING CHARGES AND MAGNETISMExercise:EXERCISE-III
Explore 45 Videos
Similar Questions
The ratio of the numerical values of the average velocity and average speed of a body is always
View SolutionA person travels along a straight road for half the distance with velocity V1 and the remaining half distance with velocity V2 the average velocity is given by
View SolutionA particle is projected over a triangle from one end of a horizontal base and garzing the vertex falls on the other end of the base . If α and β the base angles and θ the angle of projection then show that tanθ=tanα+tanβ.
View SolutionA proton, a deuteron and an a particle having same momentum enter a uniform magnetic field at right angles to the field. Then the ratio of their angular momenta during their motion in the magnetic field is
View Solution
Figure shows the displacement tiime (x-t) graph of a body moving in a straight line which one of the graph shown in figure represents the velocity- time (v-t) graph of the motion of the body.
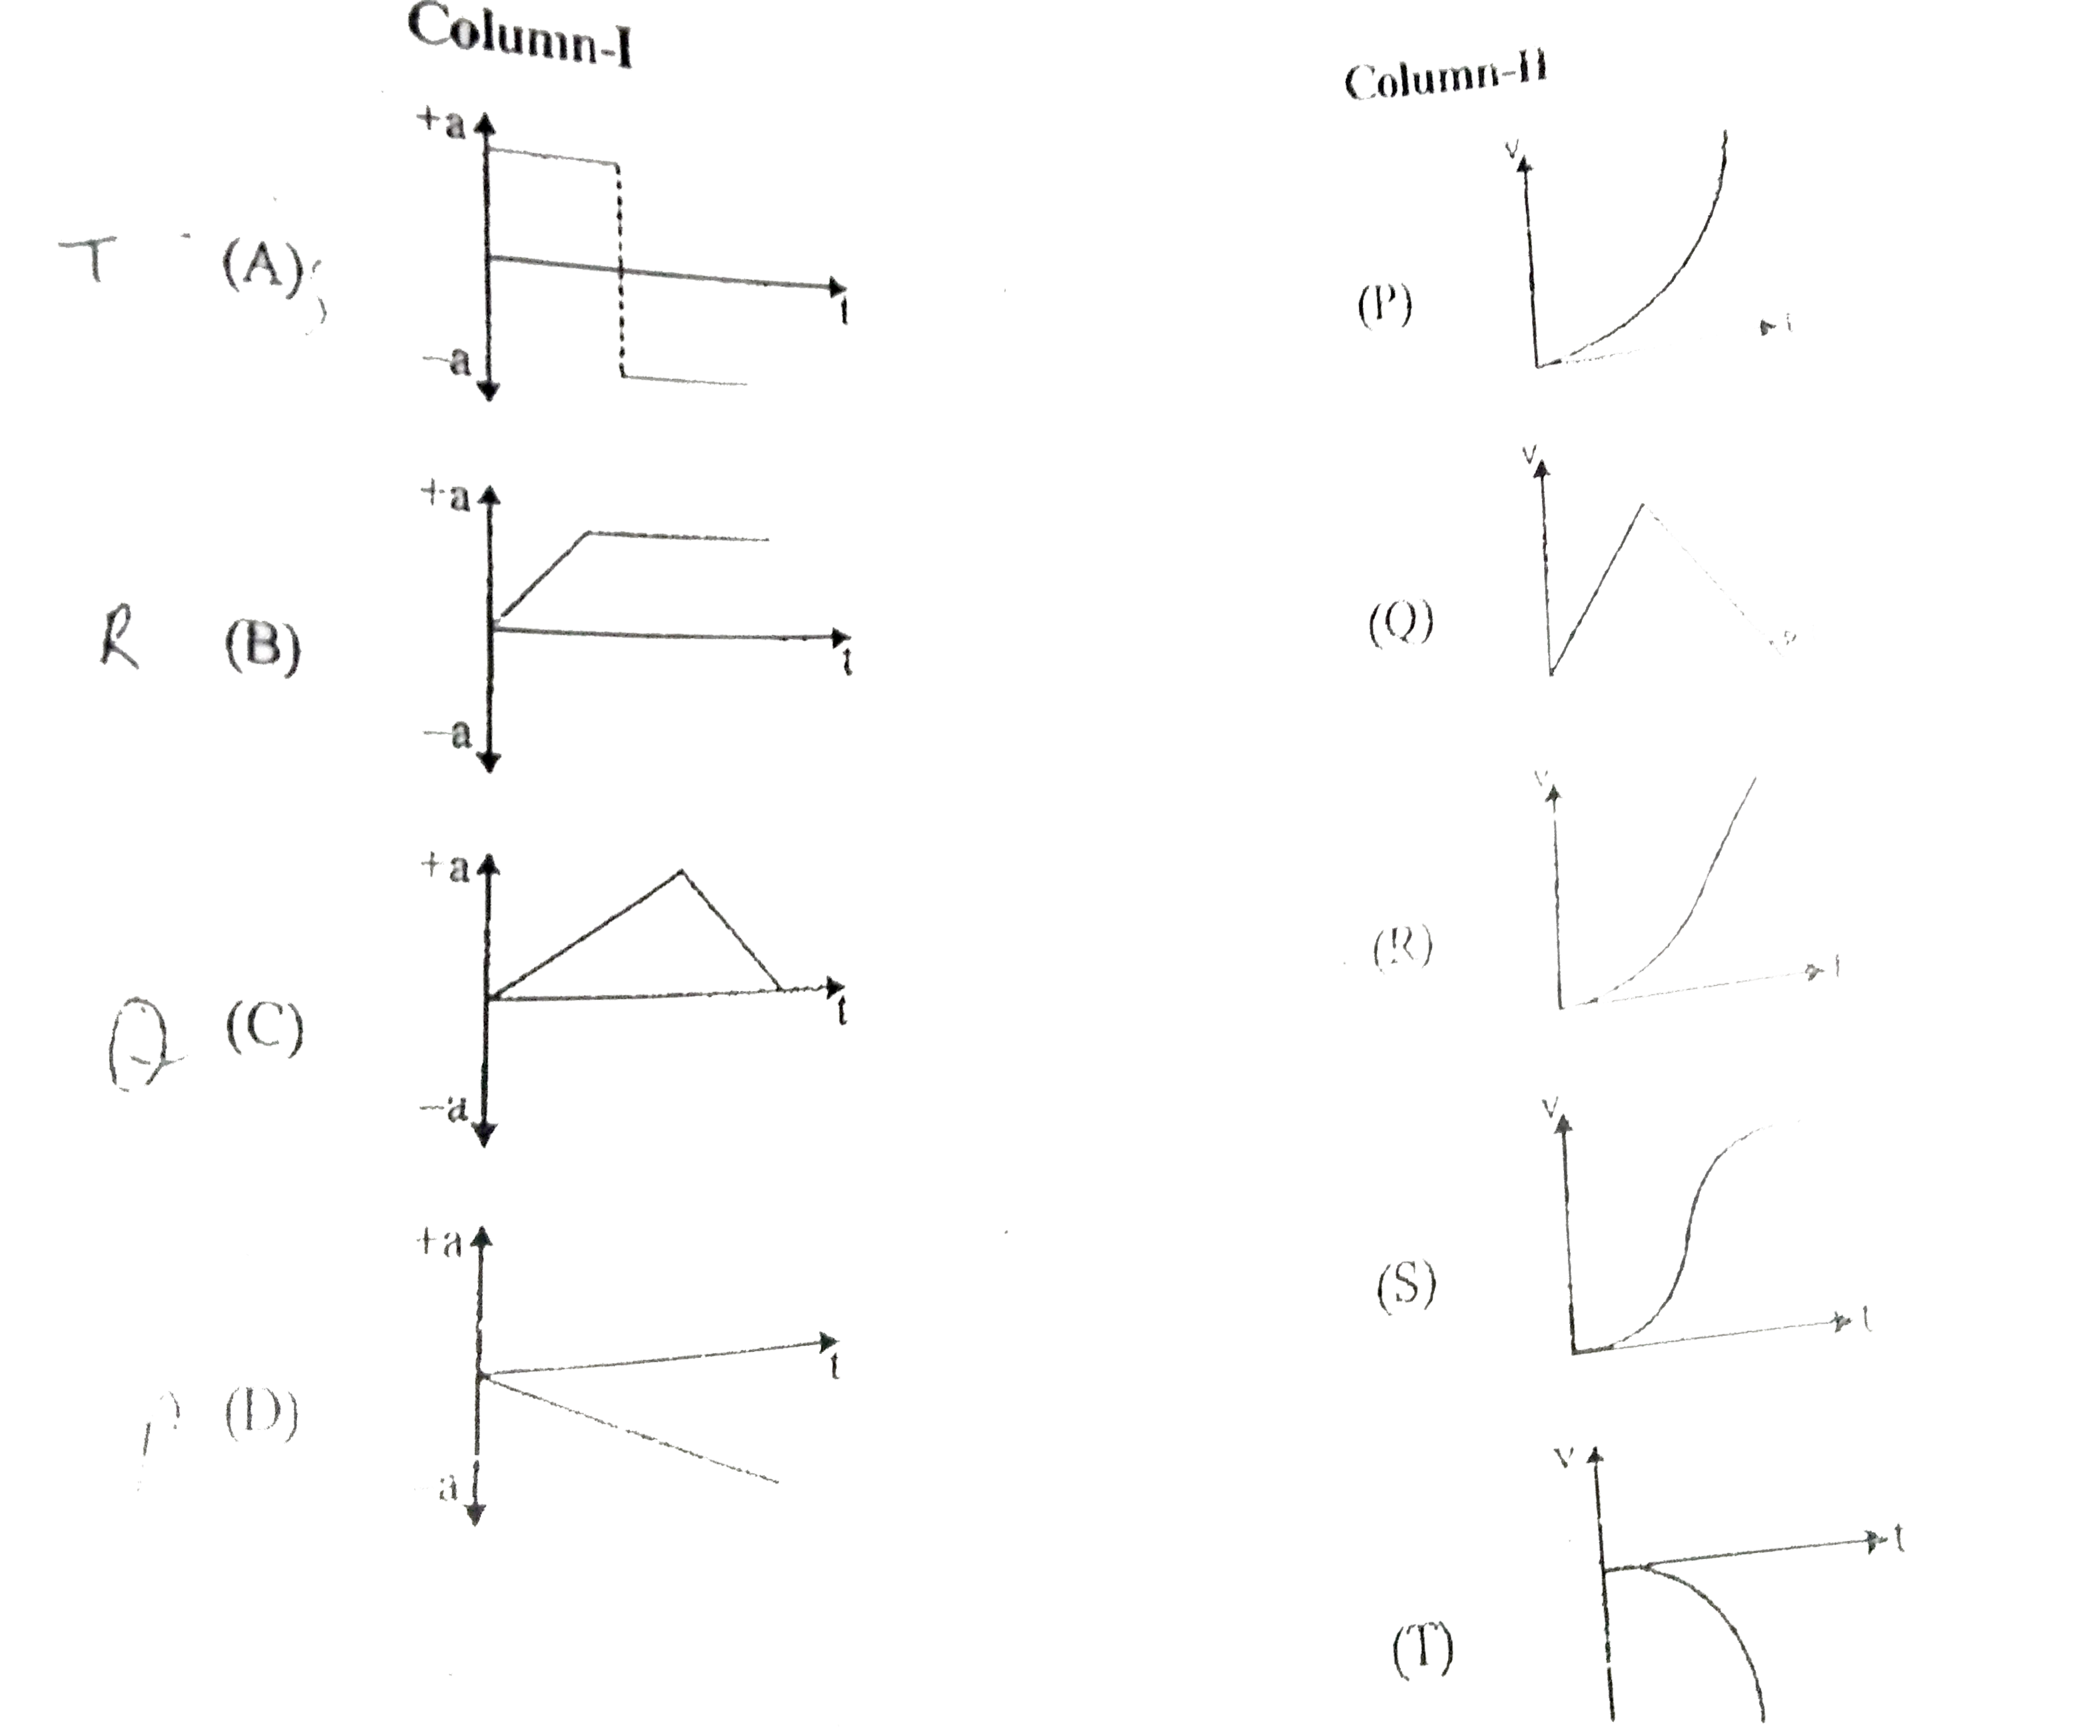
View SolutionColumn-I shows a-t graph and column-II shows v-t graph. Mathc the column-I and column-II.

View SolutionRepresent uniform motion on a v - t graph.
View SolutionRepresent uniform accelerated motion on a s-t graph.
View SolutionRepresent a body in uniform accelerated motion on a a - t graph.
View SolutionRepresent the following v - t graph on a a - t graph.
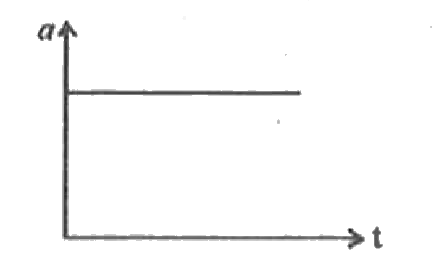
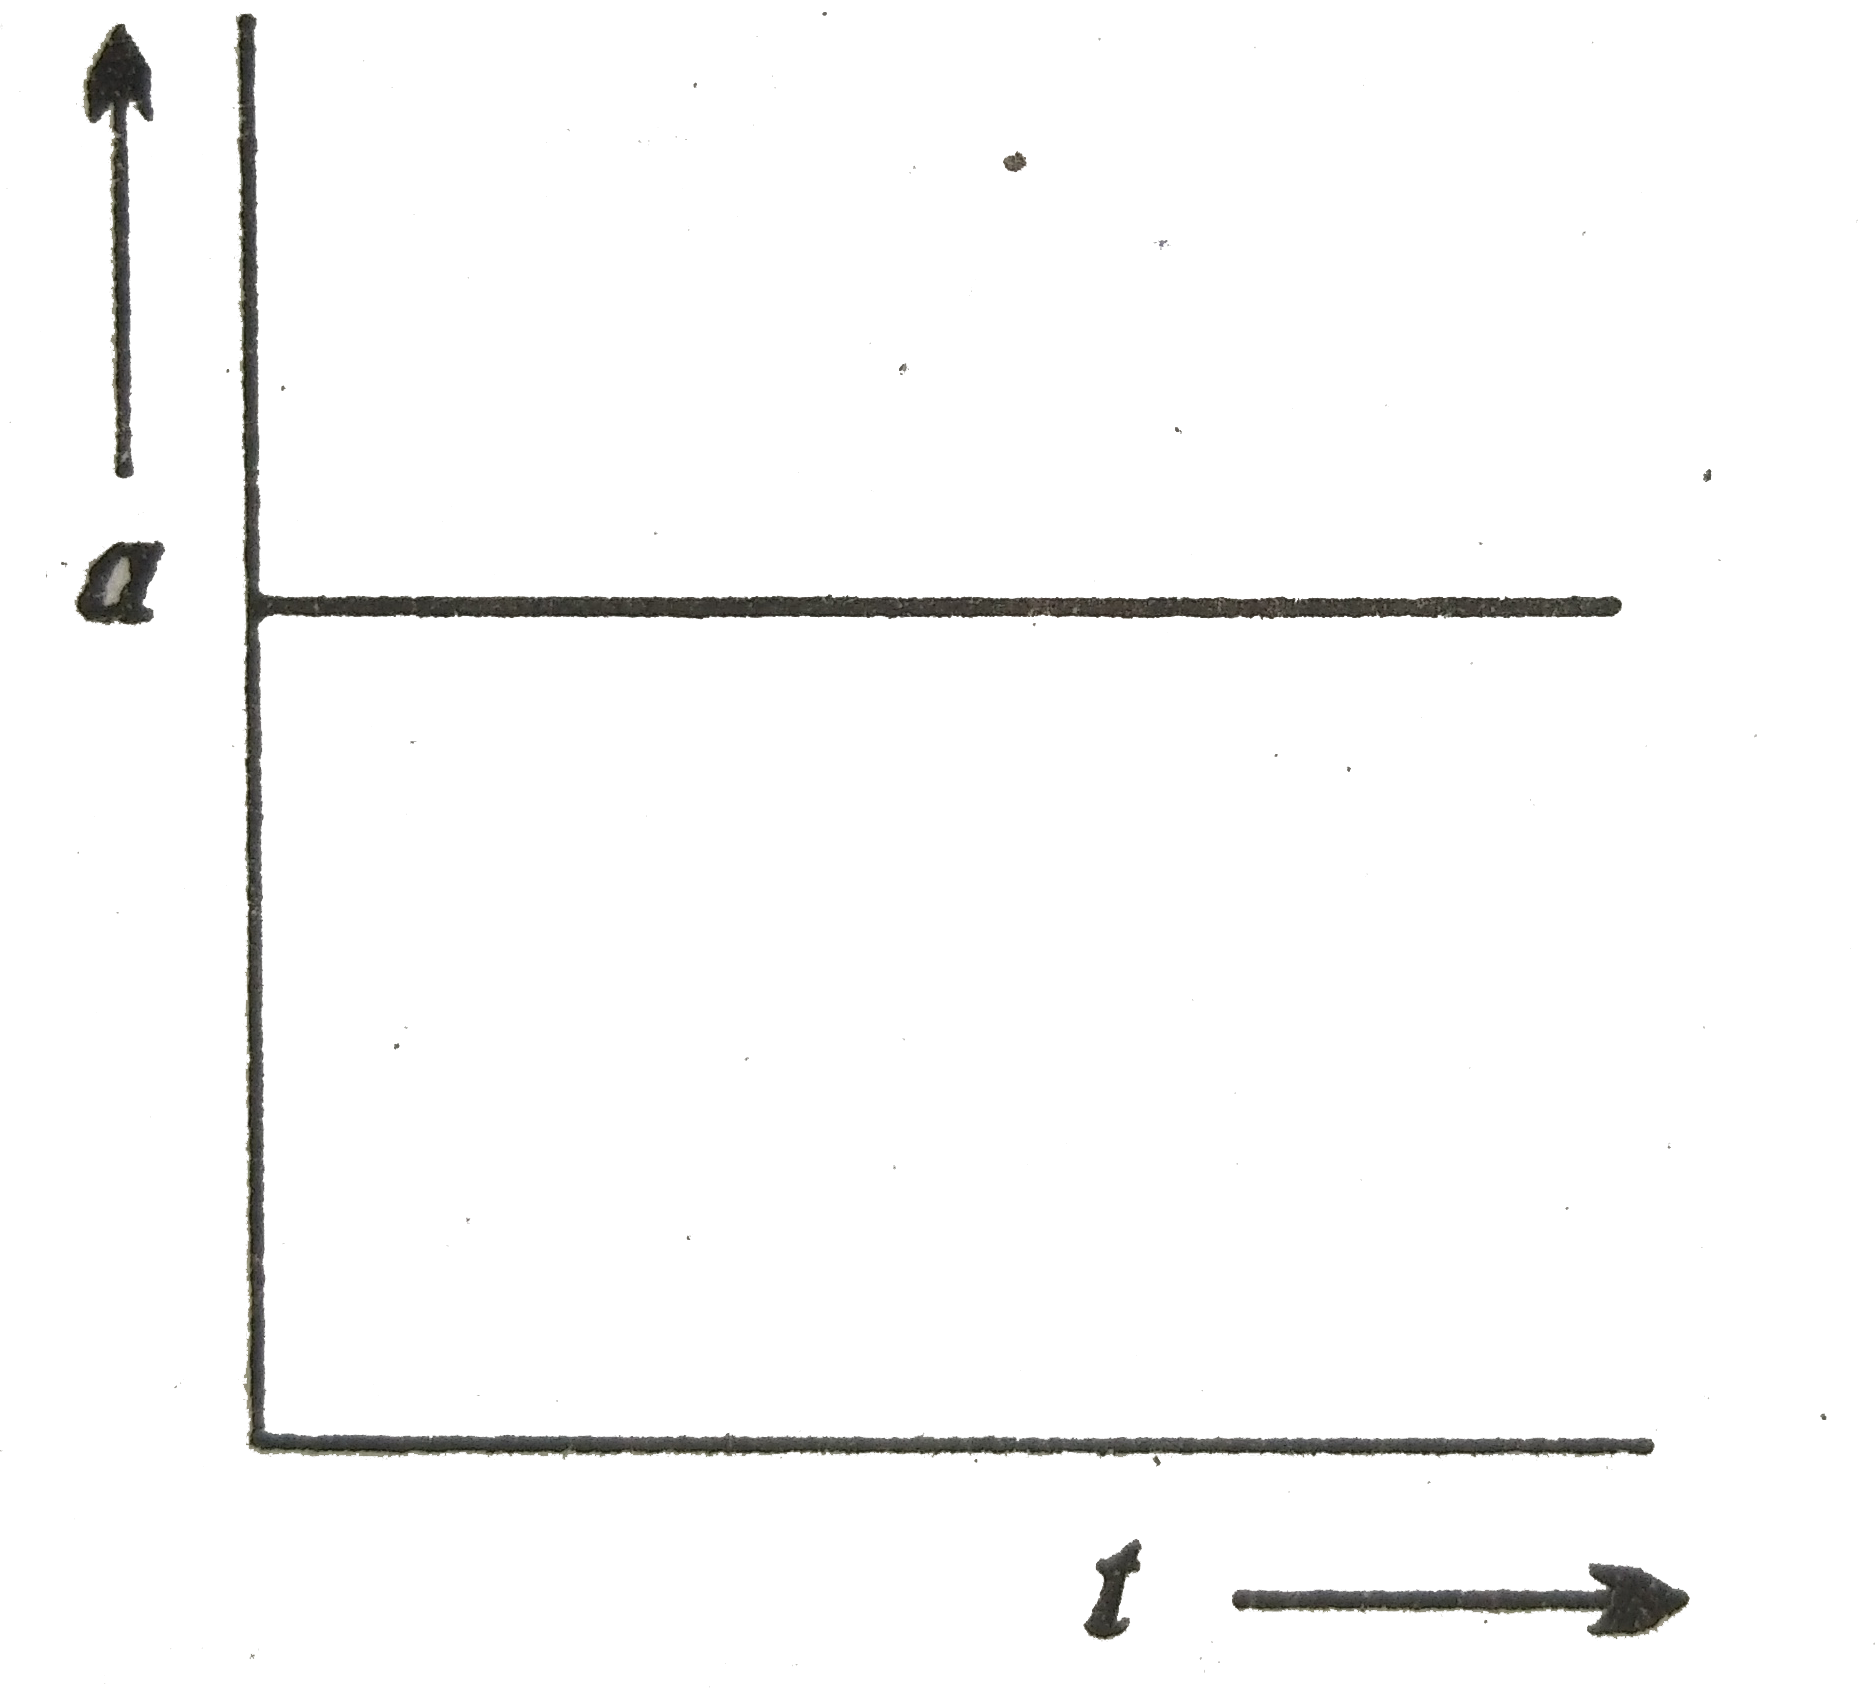
View SolutionRepresent the following a-t graph on a v-t graph.
View SolutionRepresent the following a-t graph on a v-t graph.

View Solutionसंलग्न चित्र में विरामावस्था से एक गतिमान पिंड के लिए a−t ग्राफ प्रदर्शित किया गया है। उस पिंड के लिए
(i) v−t ग्राफ तथा (ii ) x−t ग्राफ खींचिये।

View SolutionThe graph in figure shows the velocity v versus time t for a body. Which of the graphs shown in figure represents the correesponding acceleration versus time graphs ?
View SolutionCorresponding to (p - T) graph as shown in figure, draw (a) P - V graph (b) V - T graph ( c) rho - T graph and (d) U - T graph.
View Solution