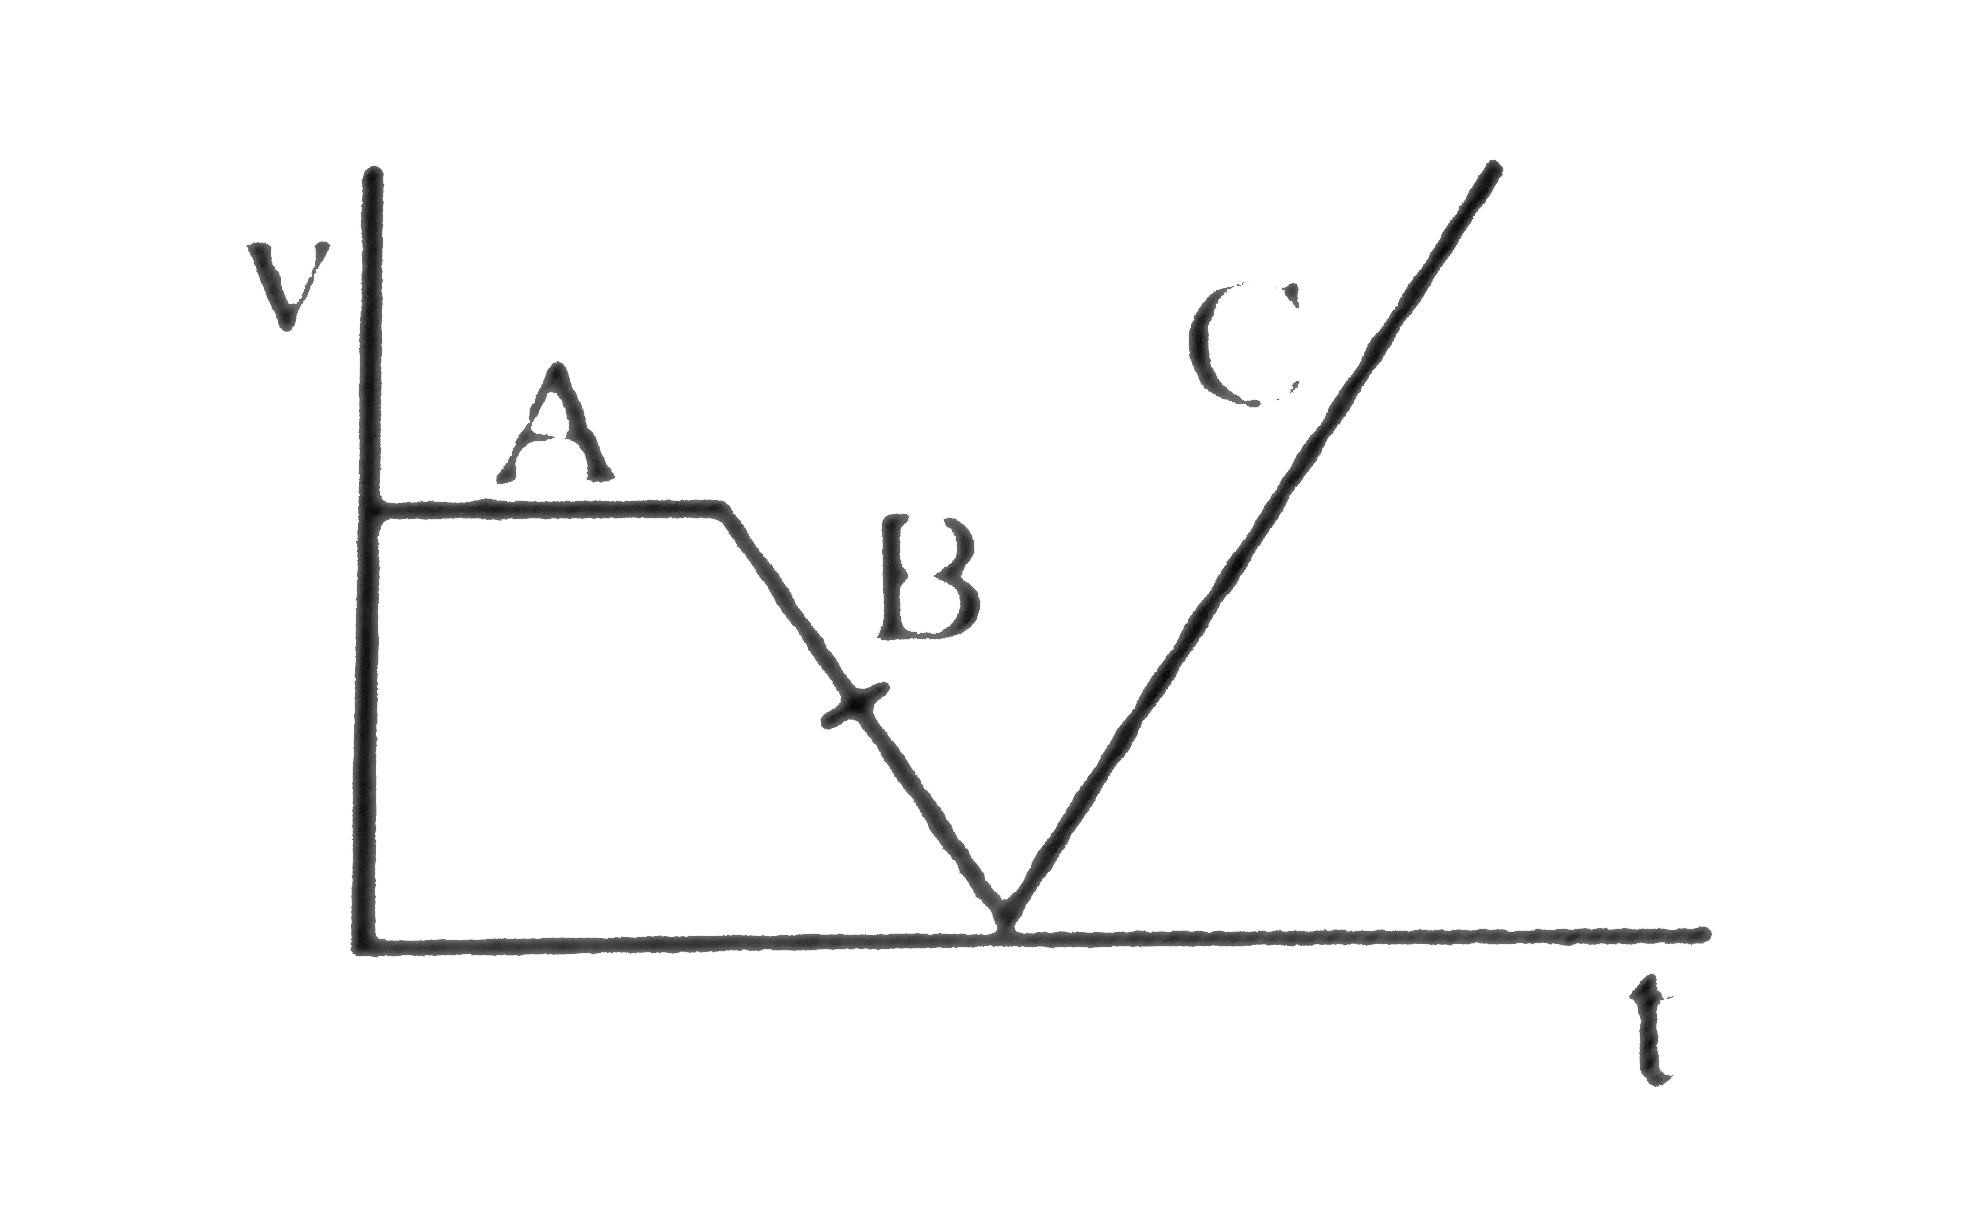
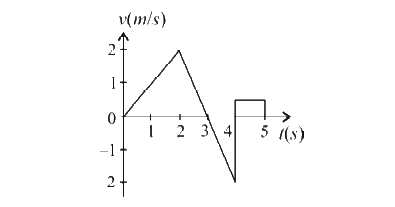
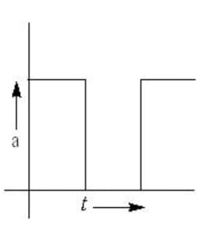
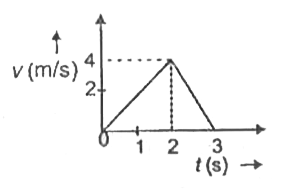
The graph in figure shows the velocity v versus time t for a body. Which of the graphs shown in figure represents the corresponding acceleration versus time graphs ?
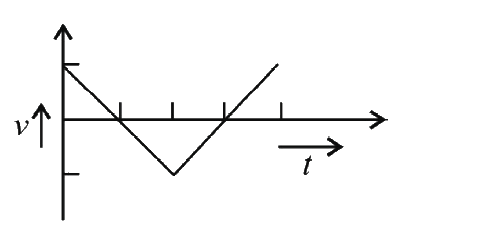
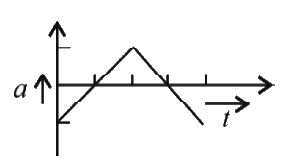
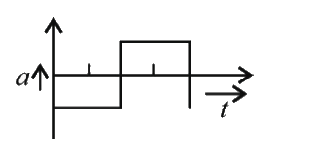
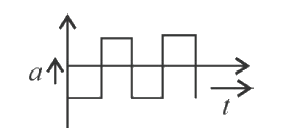
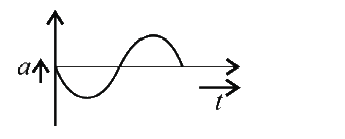
The correct Answer is:B
Step by step video, text & image solution for The graph in figure shows the velocity v versus time t for a body. Which of the graphs shown in figure represents the corresponding acceleration versus time graphs ? by Physics experts to help you in doubts & scoring excellent marks in Class 12 exams.
Updated on:21/07/2023Similar Questions
Knowledge Check
The graph in figure shows the velocity v versus time t for a body. Which of the graphs shown in figure represents the corresponding acceleration versus time graphs ?
 A
A B
B C
C D
D
The graph below shws the velocity versus time graph for a body
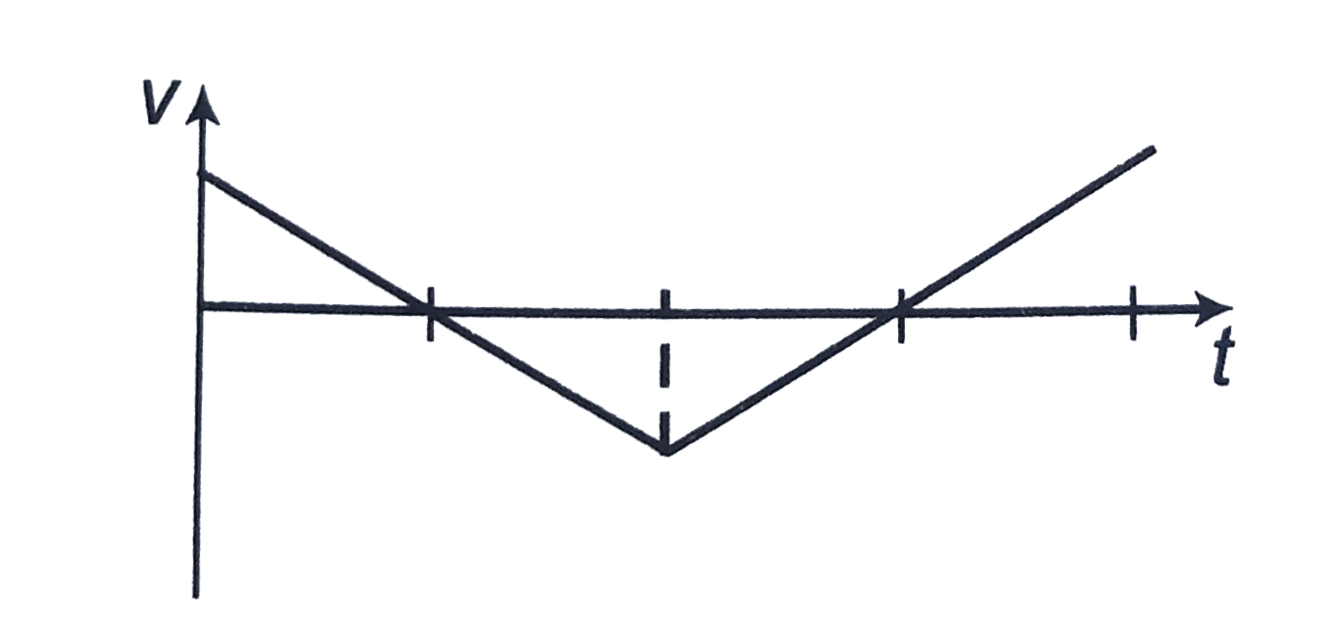
Which of the following graph represents the corresponding acceleration v//s time graph?A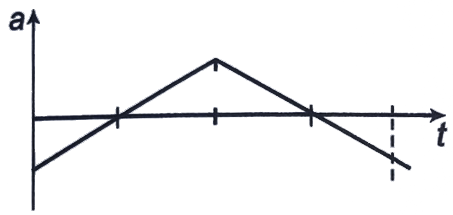 B
B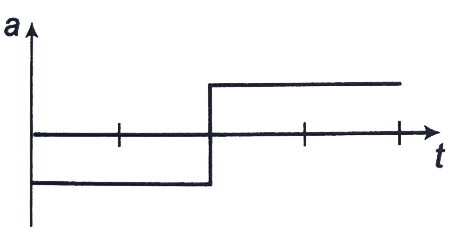 C
C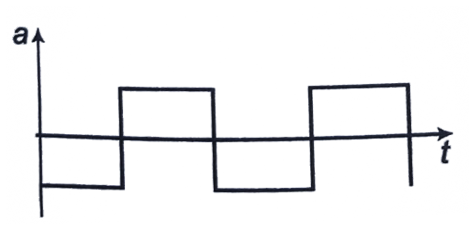 D
D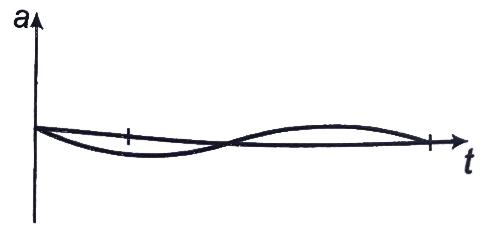
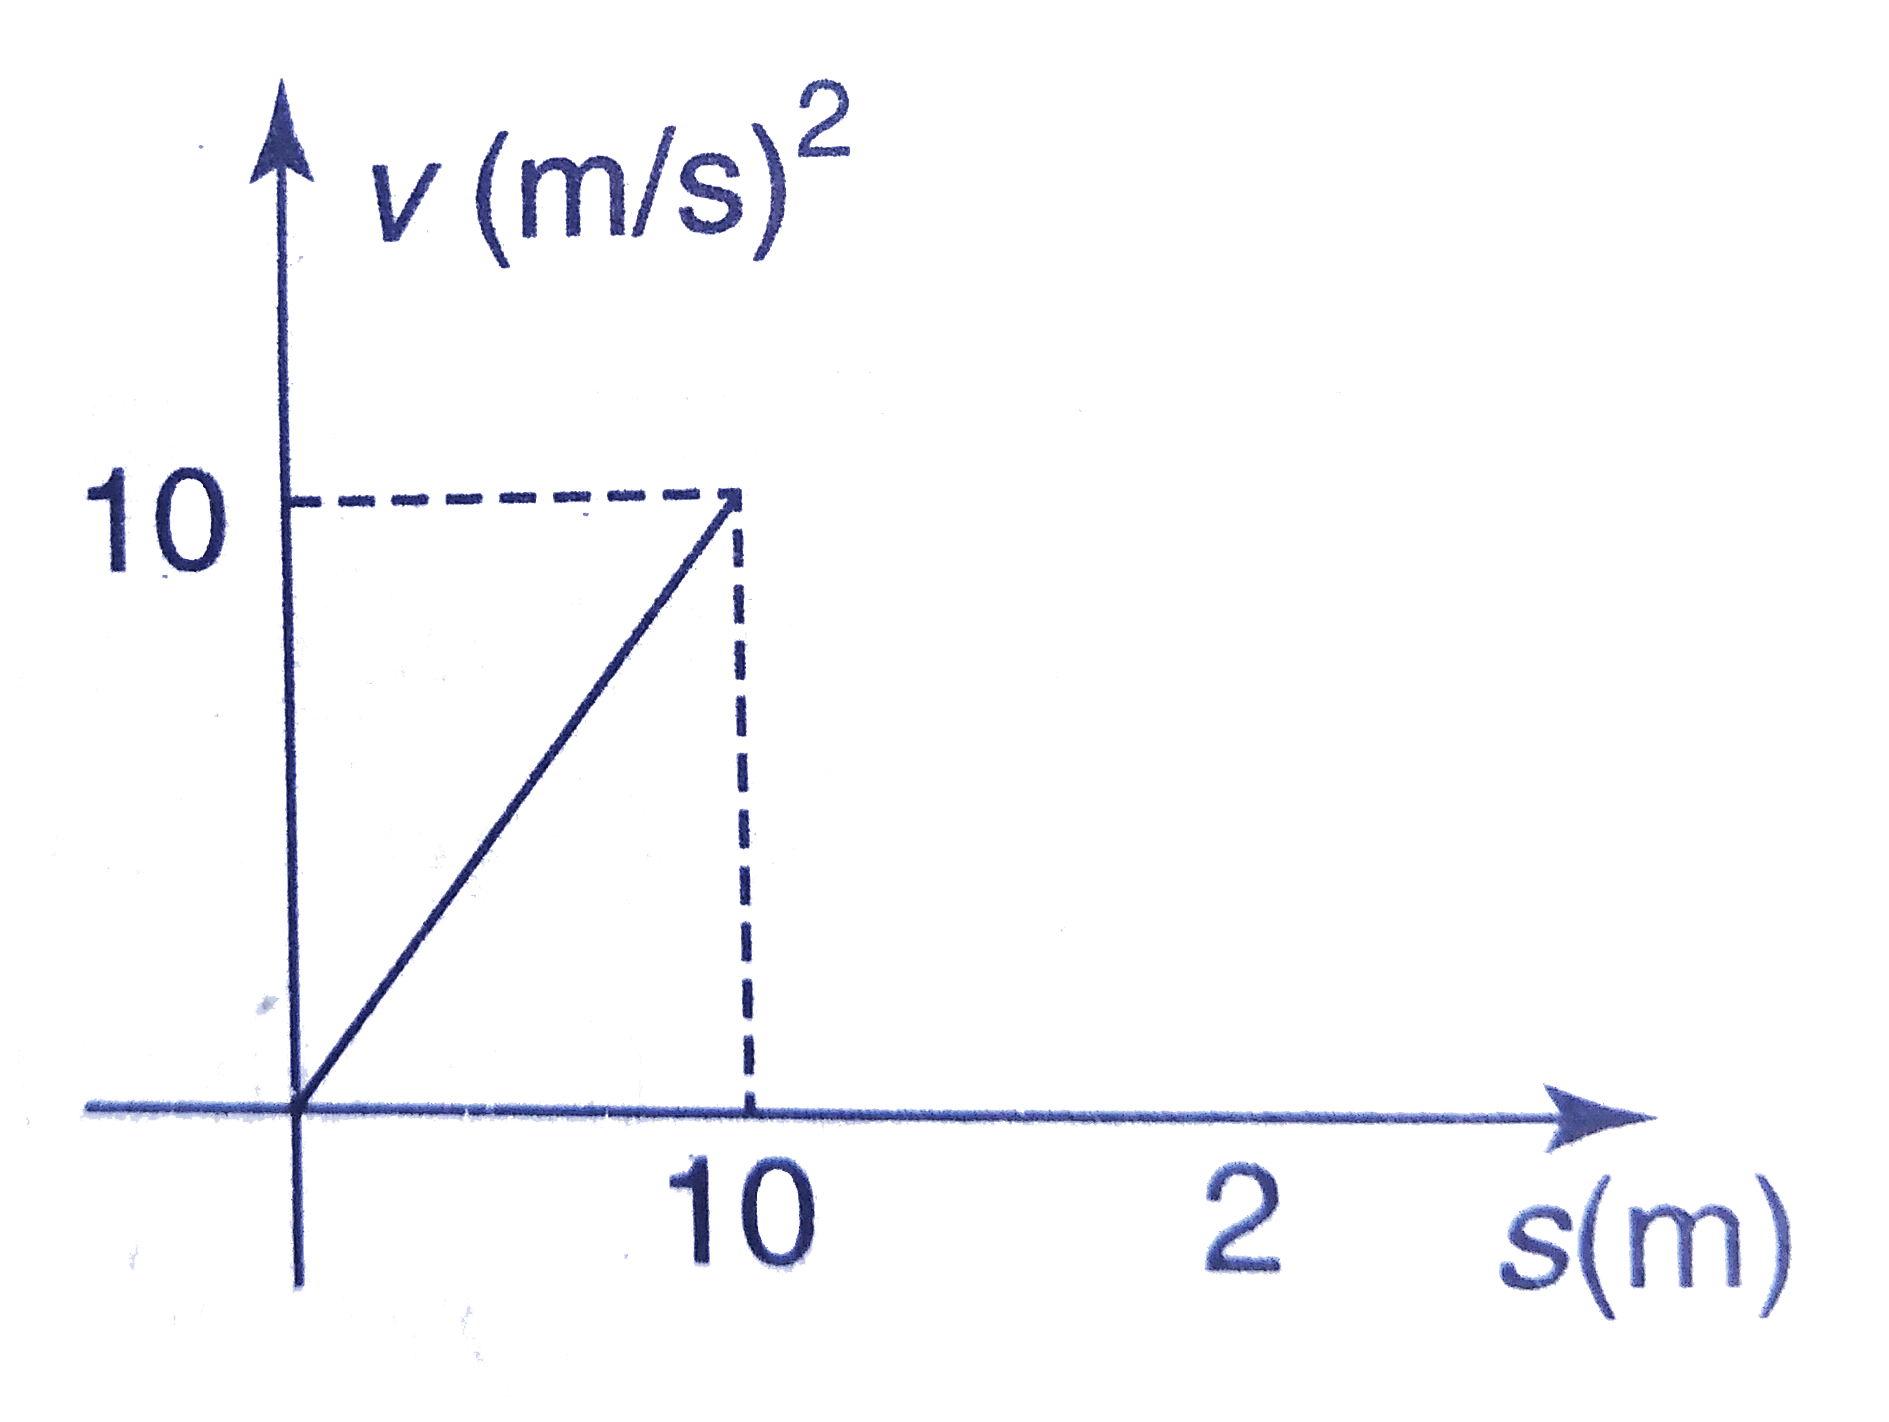
Velocity versus displacement graph of a particle moving in a straight line as shown in figure.
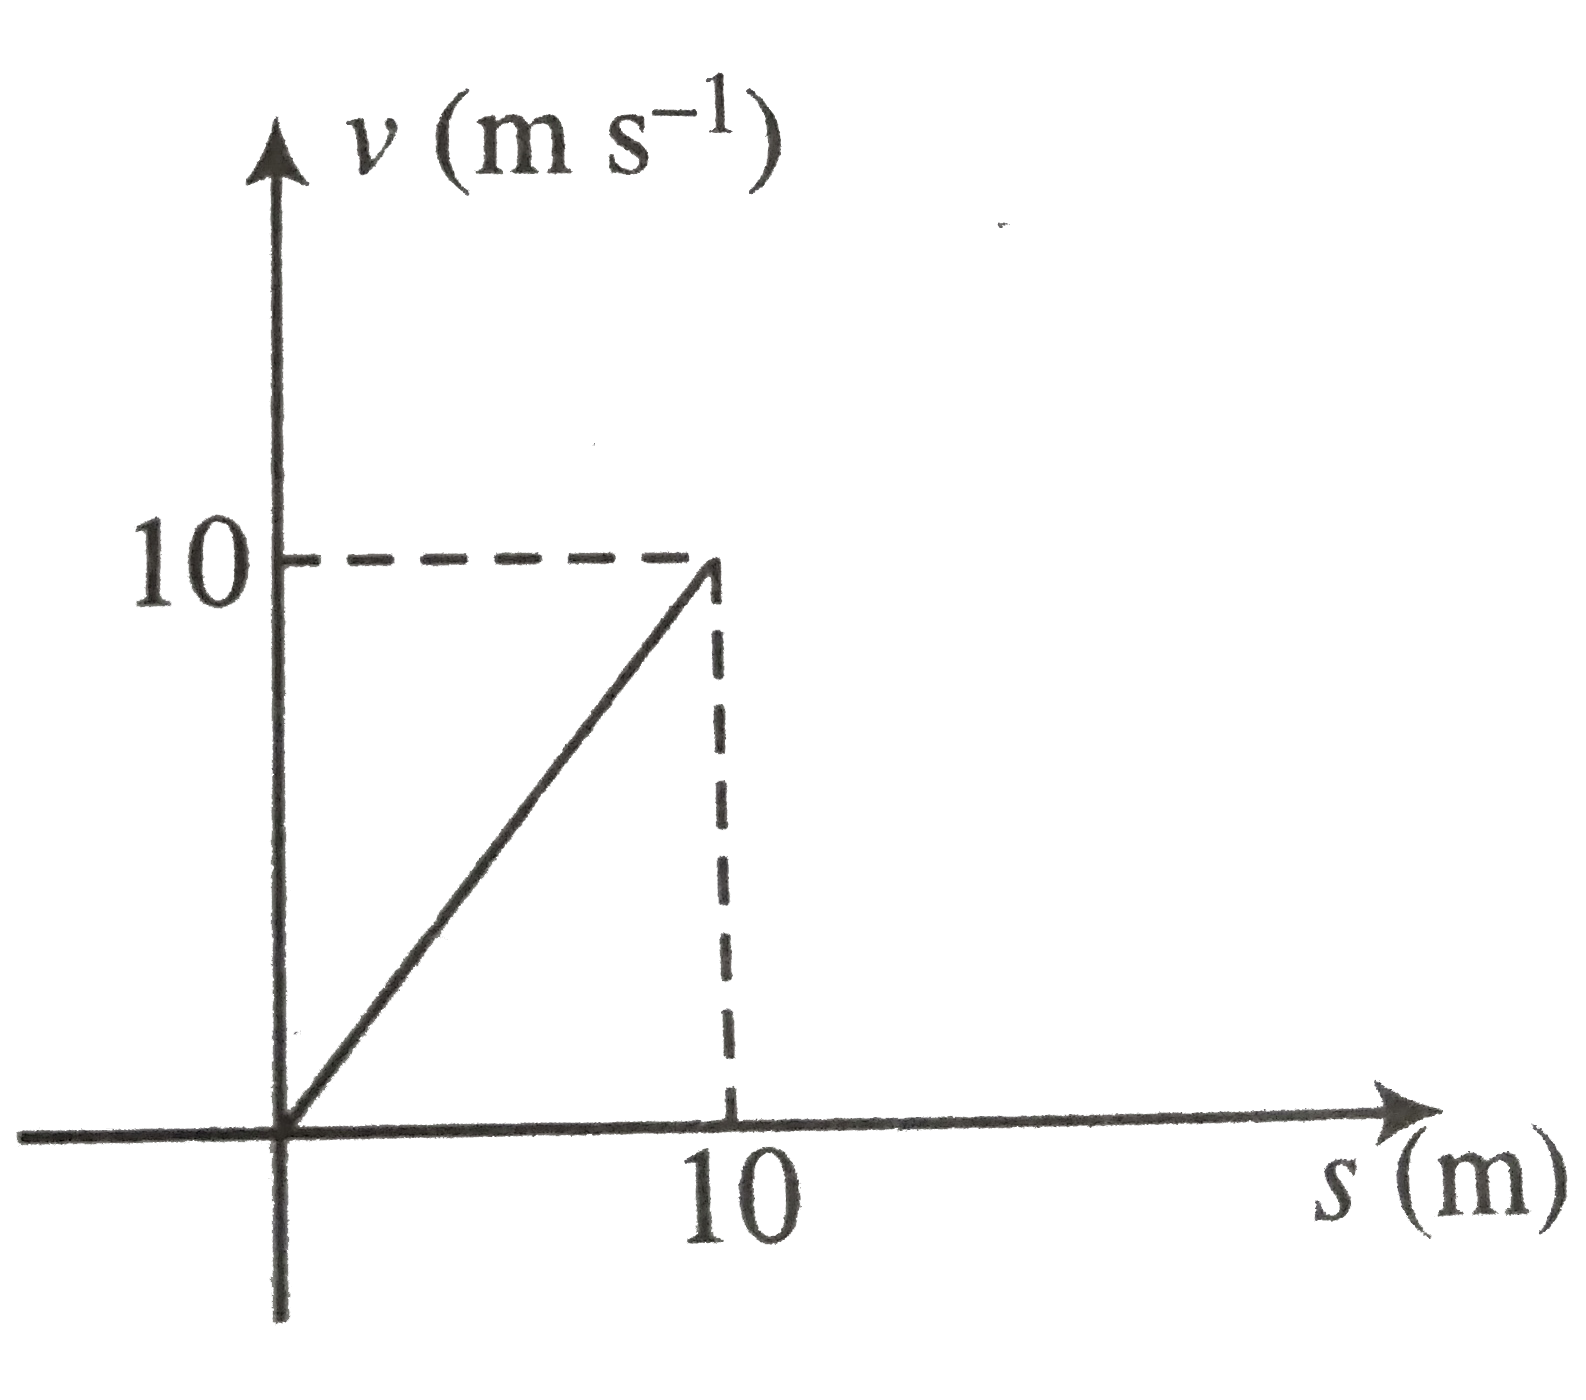
The corresponding acceleration versus velocity graph will be .A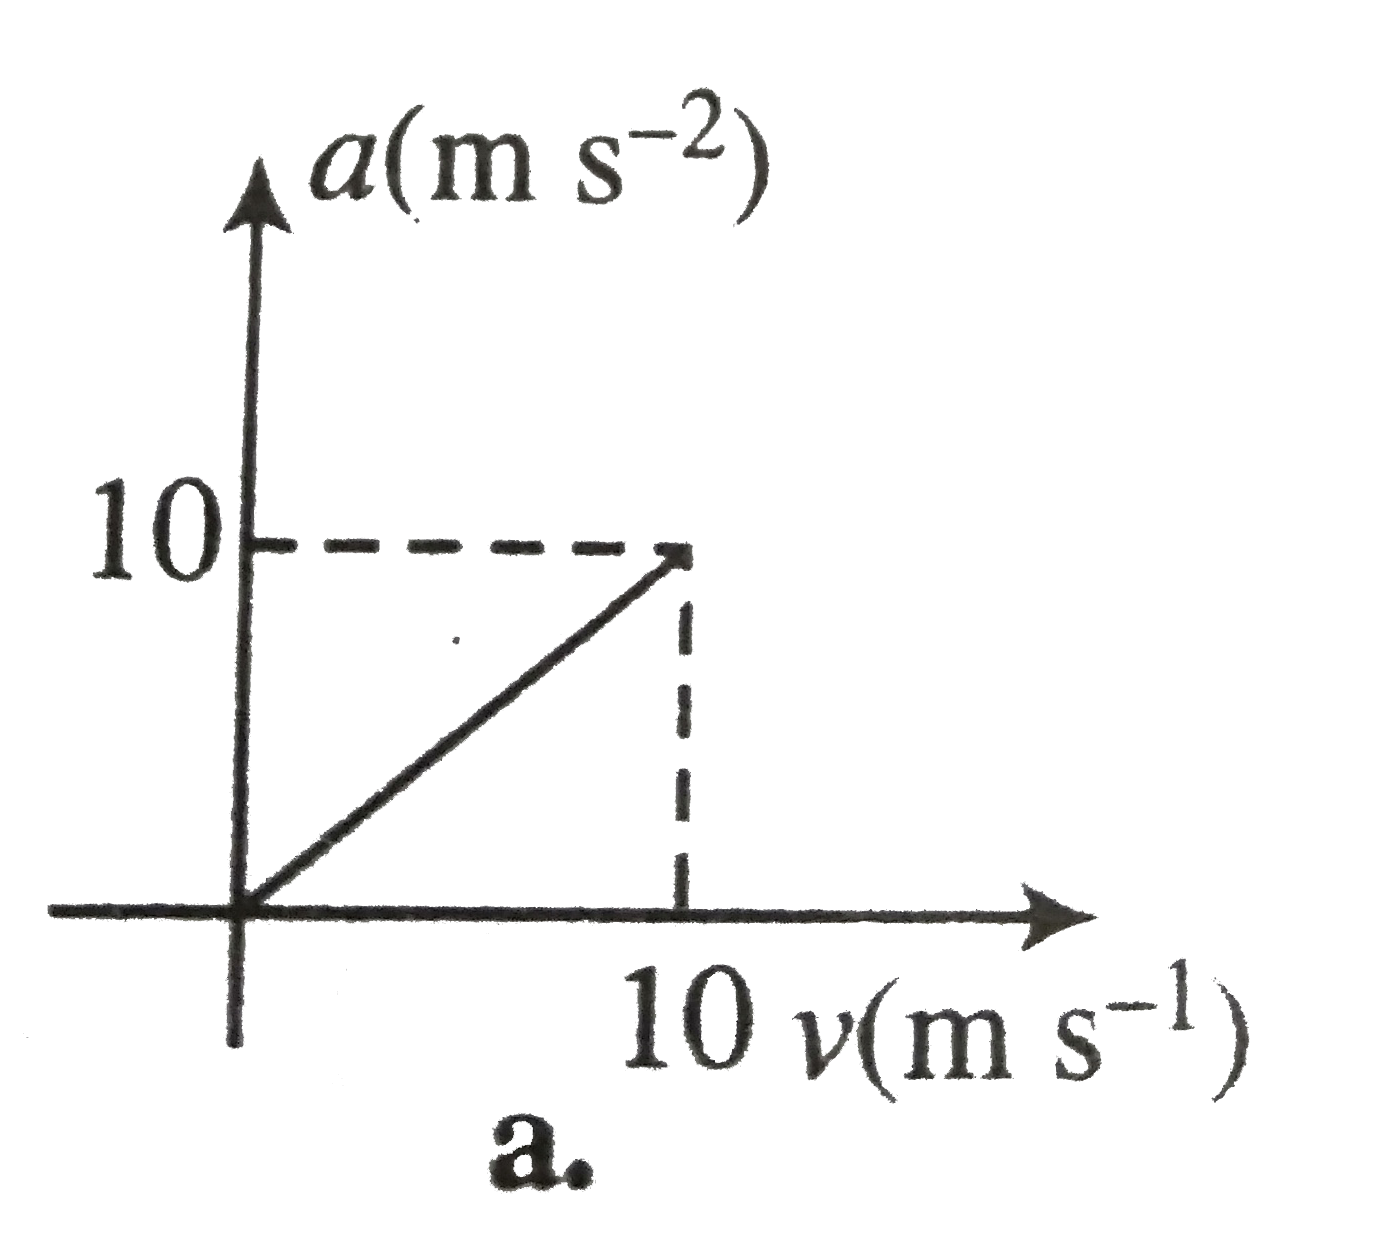 B
B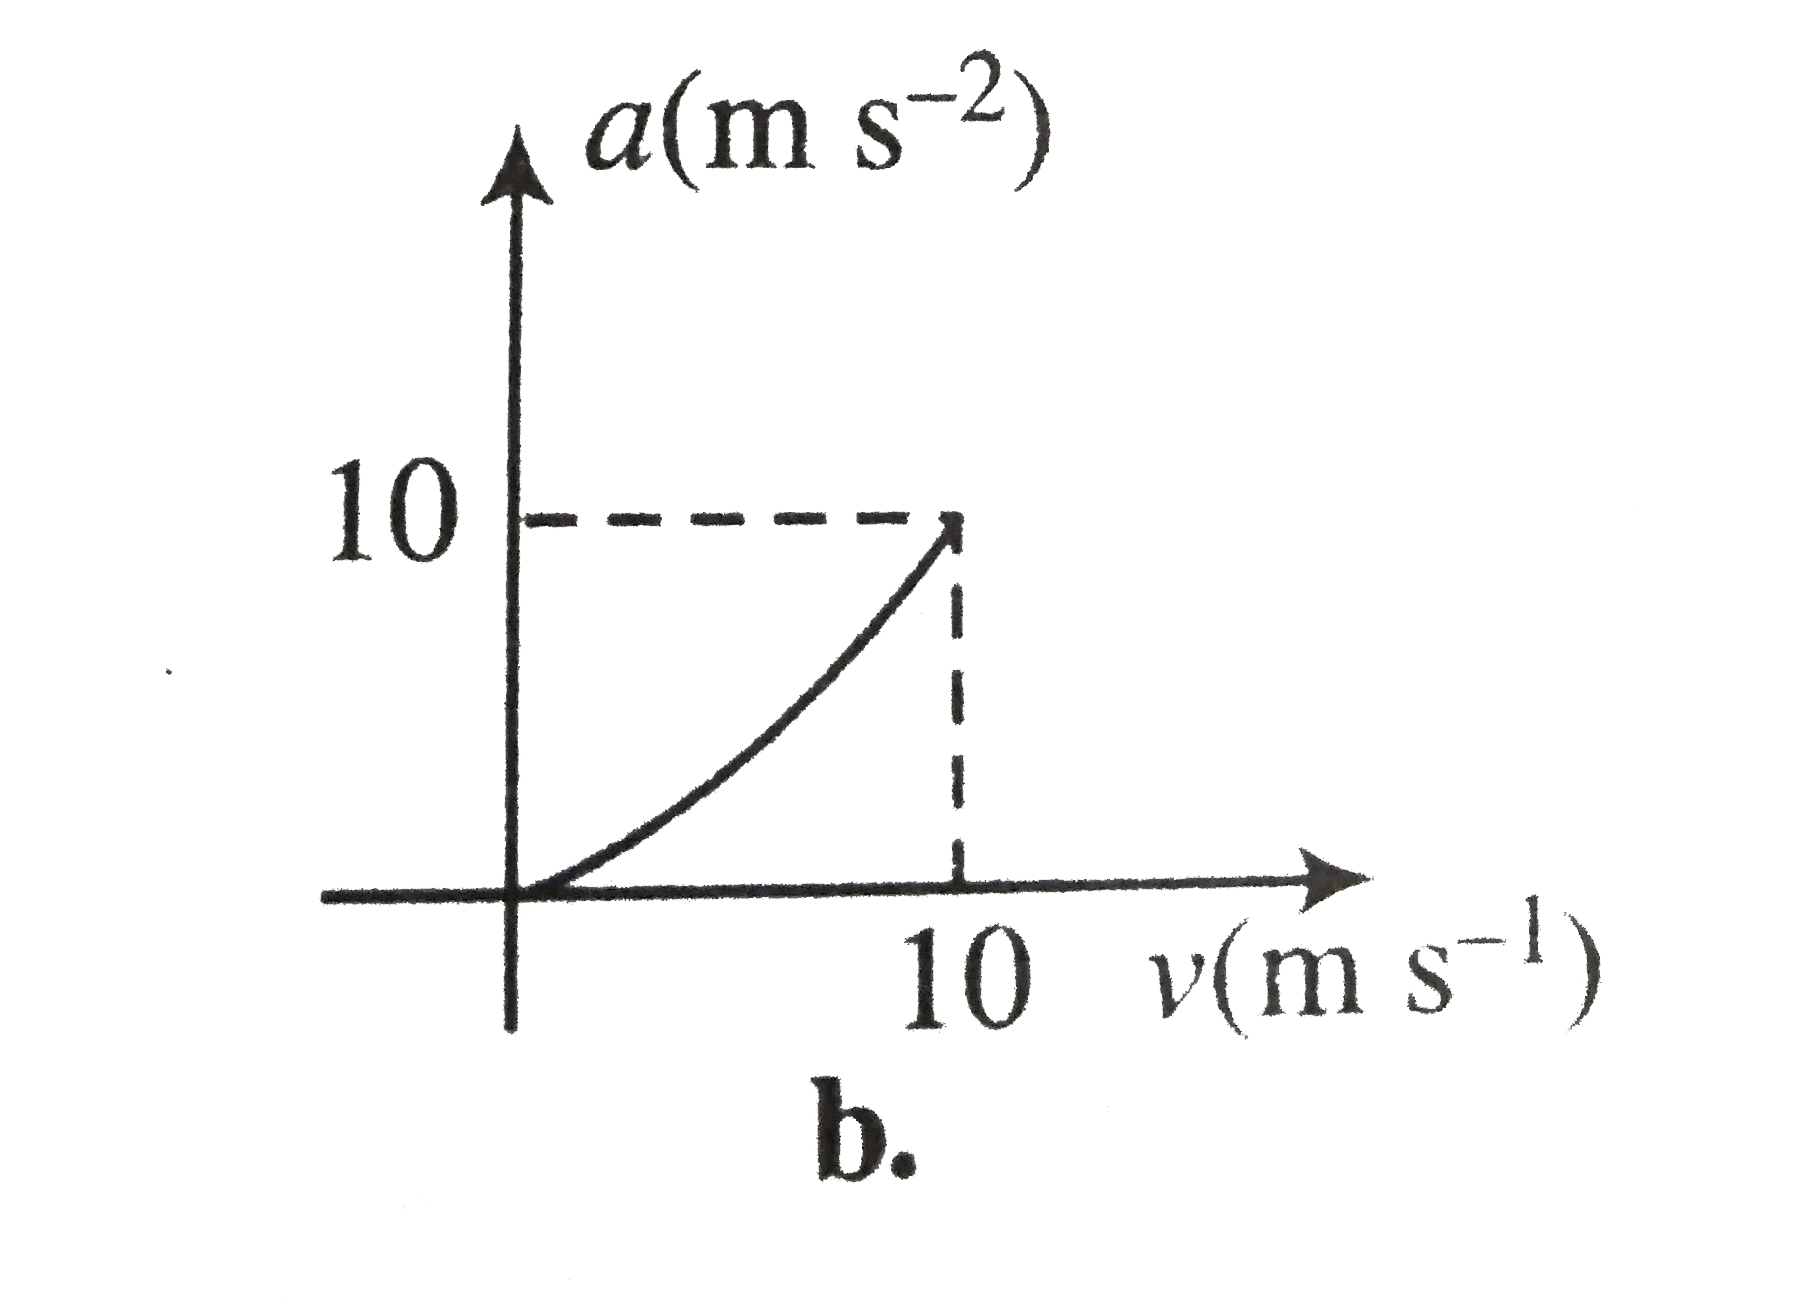 C
C D
D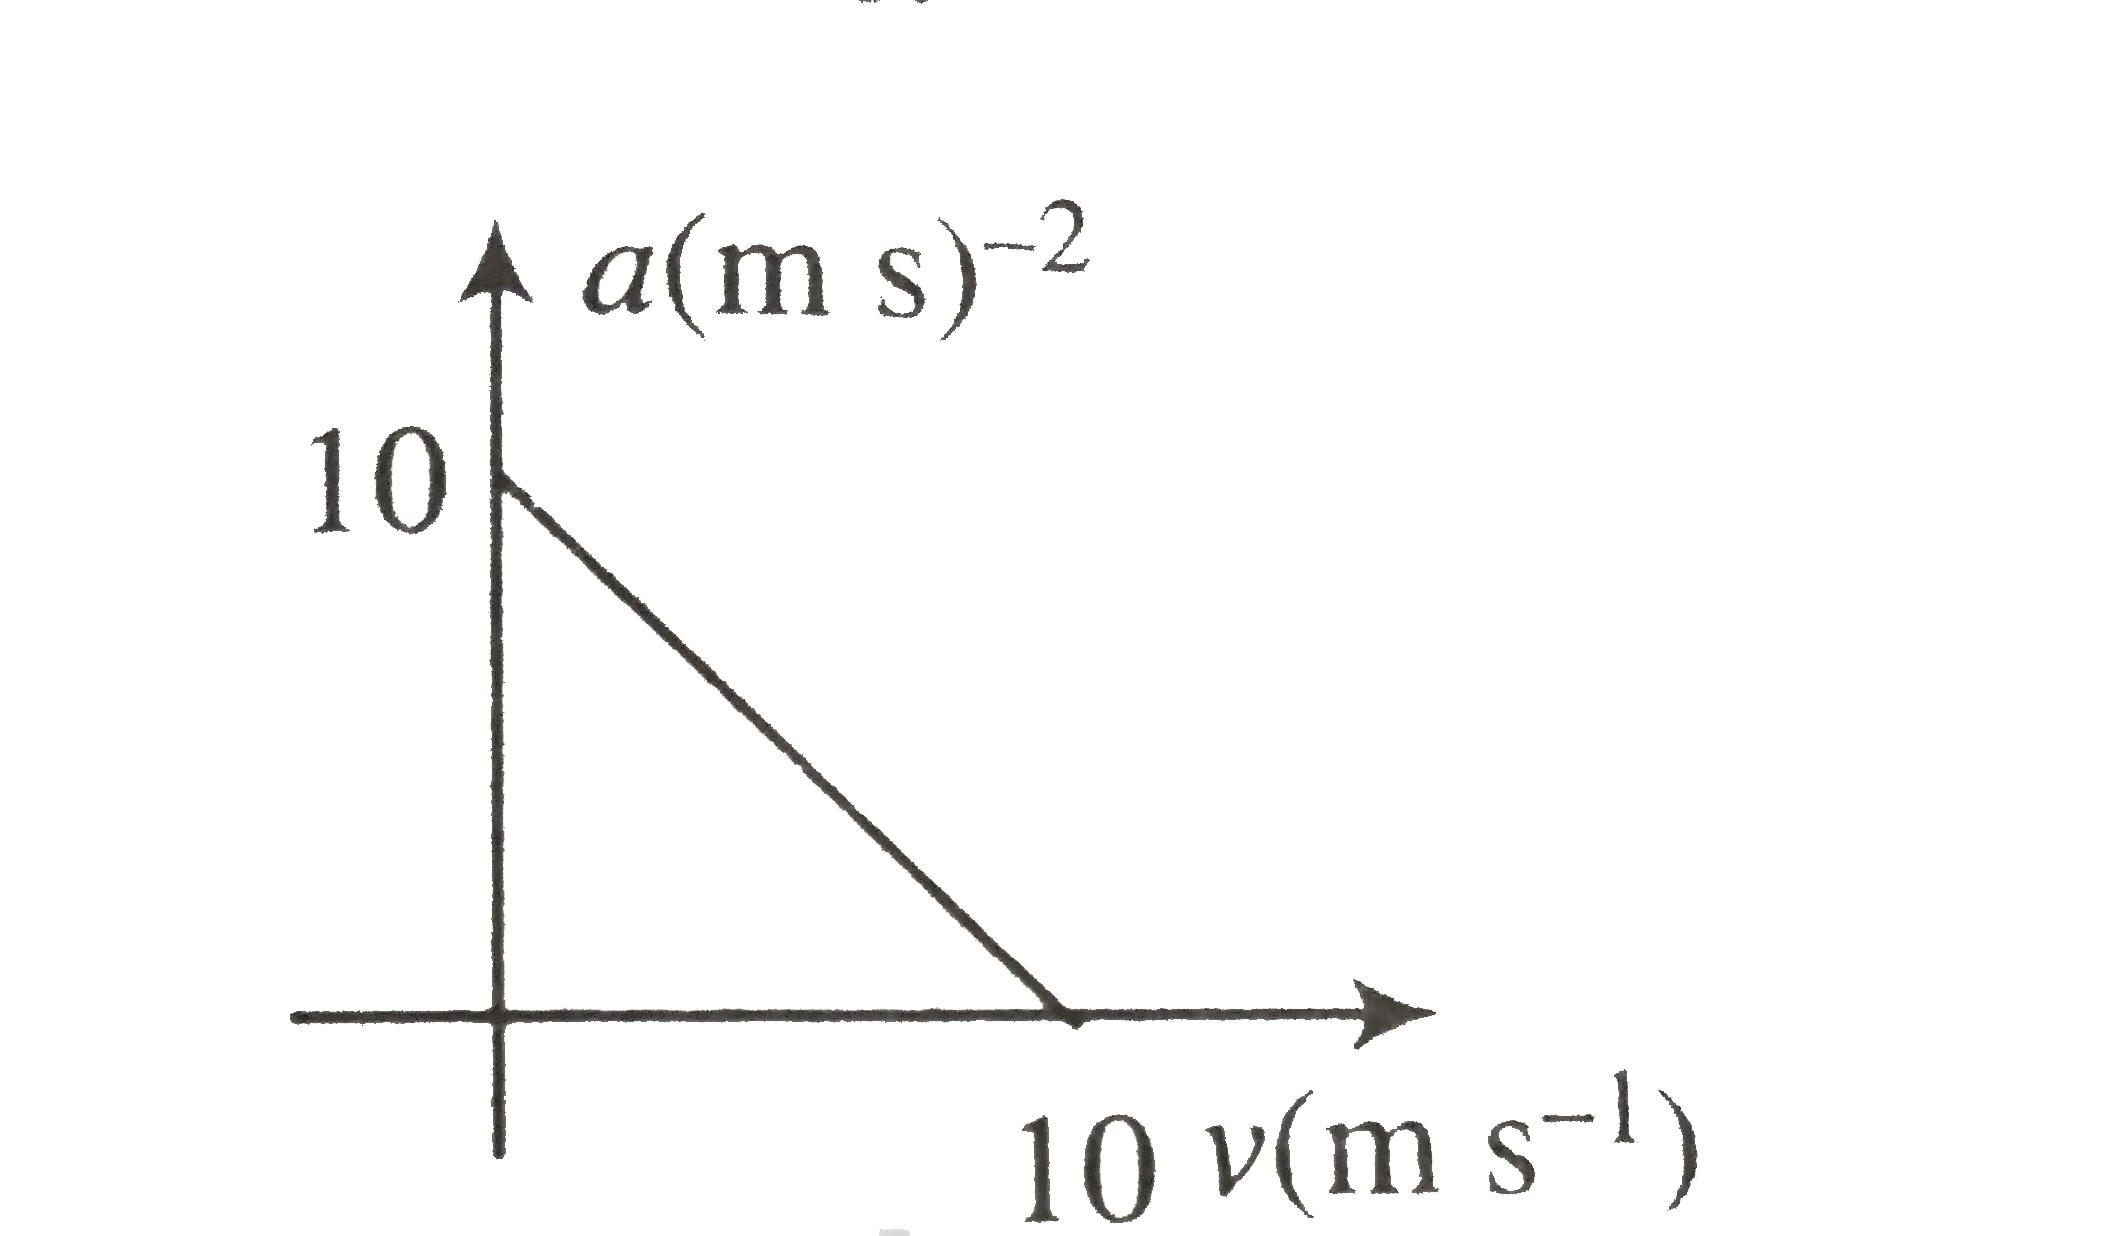
2.The velocity-time (v-t) graph for a particle in straight line motion is given below the corresponding acceleration time graph will be?
View SolutionFigure shows the acceleration-time graphs of a particle. Which of the following represents the corresponding velocity -time graph?
View SolutionVelocity versus displacement graph of a particle moving in a straight line is shown in figure. Corresponding acceleration versus velocity graph will be.
View SolutionThe velocity versus time graph of a body moving in a straight line is as shown in the figure below
View SolutionThe velocity-time graph of a body moving in a straight line is shown below:

Which one of the following represents its acceleration time graph?
View Solution

