Show variation of resistivity of copper as a function of temperature in a graph.
To show the variation of resistivity of copper as a function of temperature, we can follow these steps:
Step 1: Understand the Formula
The resistivity (ρ) of a material at a temperature (T) can be calculated using the formula:
ρ(T)=ρ(0)×(1+α×ΔT)
where:
- ρ(T) = resistivity at temperature T
- ρ(0) = resistivity at 0°C
- α = temperature coefficient of resistivity for copper
- ΔT = change in temperature (T - 0°C)
Step 2: Identify Constants
For copper:
- The resistivity at 0°C, ρ(0), is approximately 1.68×10⁻⁸Ω⋅m.
- The temperature coefficient of resistivity, α, is approximately 0.00393°C−1.
Step 3: Calculate Resistivity at Different Temperatures
To plot the graph, calculate the resistivity at various temperatures (e.g., 0°C, 20°C, 40°C, 60°C, 80°C, 100°C):
1. For T=0°C:
ρ(0)=1.68×10⁻⁸Ω⋅m
2. For T=20°C:
ρ(20)=1.68×10−8×(1+0.00393×20)
ρ(20)≈1.68×10−8×1.0786≈1.81×10⁻⁸Ω⋅m
3. For T=40°C:
ρ(40)=1.68×10−8×(1+0.00393×40)
ρ(40)≈1.68×10−8×1.1572≈1.94×10⁻⁸Ω⋅m
4. Continue this for other temperatures up to 100°C.
Step 4: Plot the Graph
- On the x-axis, plot the temperature (°C).
- On the y-axis, plot the resistivity (Ω·m).
- Mark the calculated points and draw a smooth curve through them.
Step 5: Analyze the Graph
The graph will show a parabolic curve indicating that as the temperature increases, the resistivity of copper also increases. The curve does not start from the origin because copper has a specific resistivity at 0°C.
The resistivity (ρ) of a material at a temperature (T) can be calculated using the formula:
ρ(T)=ρ(0)×(1+α×ΔT)
where:
- ρ(T) = resistivity at temperature T
- ρ(0) = resistivity at 0°C
- α = temperature coefficient of resistivity for copper
- ΔT = change in temperature (T - 0°C)
For copper:
- The resistivity at 0°C, ρ(0), is approximately 1.68×10⁻⁸Ω⋅m.
- The temperature coefficient of resistivity, α, is approximately 0.00393°C−1.
To plot the graph, calculate the resistivity at various temperatures (e.g., 0°C, 20°C, 40°C, 60°C, 80°C, 100°C):
1. For T=0°C:
ρ(0)=1.68×10⁻⁸Ω⋅m
2. For T=20°C:
ρ(20)=1.68×10−8×(1+0.00393×20)
ρ(20)≈1.68×10−8×1.0786≈1.81×10⁻⁸Ω⋅m
3. For T=40°C:
ρ(40)=1.68×10−8×(1+0.00393×40)
ρ(40)≈1.68×10−8×1.1572≈1.94×10⁻⁸Ω⋅m
4. Continue this for other temperatures up to 100°C.
- On the x-axis, plot the temperature (°C).
- On the y-axis, plot the resistivity (Ω·m).
- Mark the calculated points and draw a smooth curve through them.
The graph will show a parabolic curve indicating that as the temperature increases, the resistivity of copper also increases. The curve does not start from the origin because copper has a specific resistivity at 0°C.
Topper's Solved these Questions
- XII BOARDSBOOK - XII BOARD PREVIOUS YEAR PAPER ENGLISHCHAPTER - XII BOARDSEXERCISE - [SET - II DELHI BOARD]
5 Videos
- XII BOARDSBOOK - XII BOARD PREVIOUS YEAR PAPER ENGLISHCHAPTER - XII BOARDSEXERCISE - [SET - III, DELHI BOARD]
6 Videos
- XII BOARDSBOOK - XII BOARD PREVIOUS YEAR PAPER ENGLISHCHAPTER - XII BOARDSEXERCISE - SET-II
33 Videos
- SAMPLE PAPER 2019BOOK - XII BOARD PREVIOUS YEAR PAPER ENGLISHCHAPTER - SAMPLE PAPER 2019EXERCISE - SECTION D
6 Videos
Similar Questions
Knowledge Check
Which of the following graphs correctly shows variation of coefficient of volume expansion of copper as a function of temperature ?
A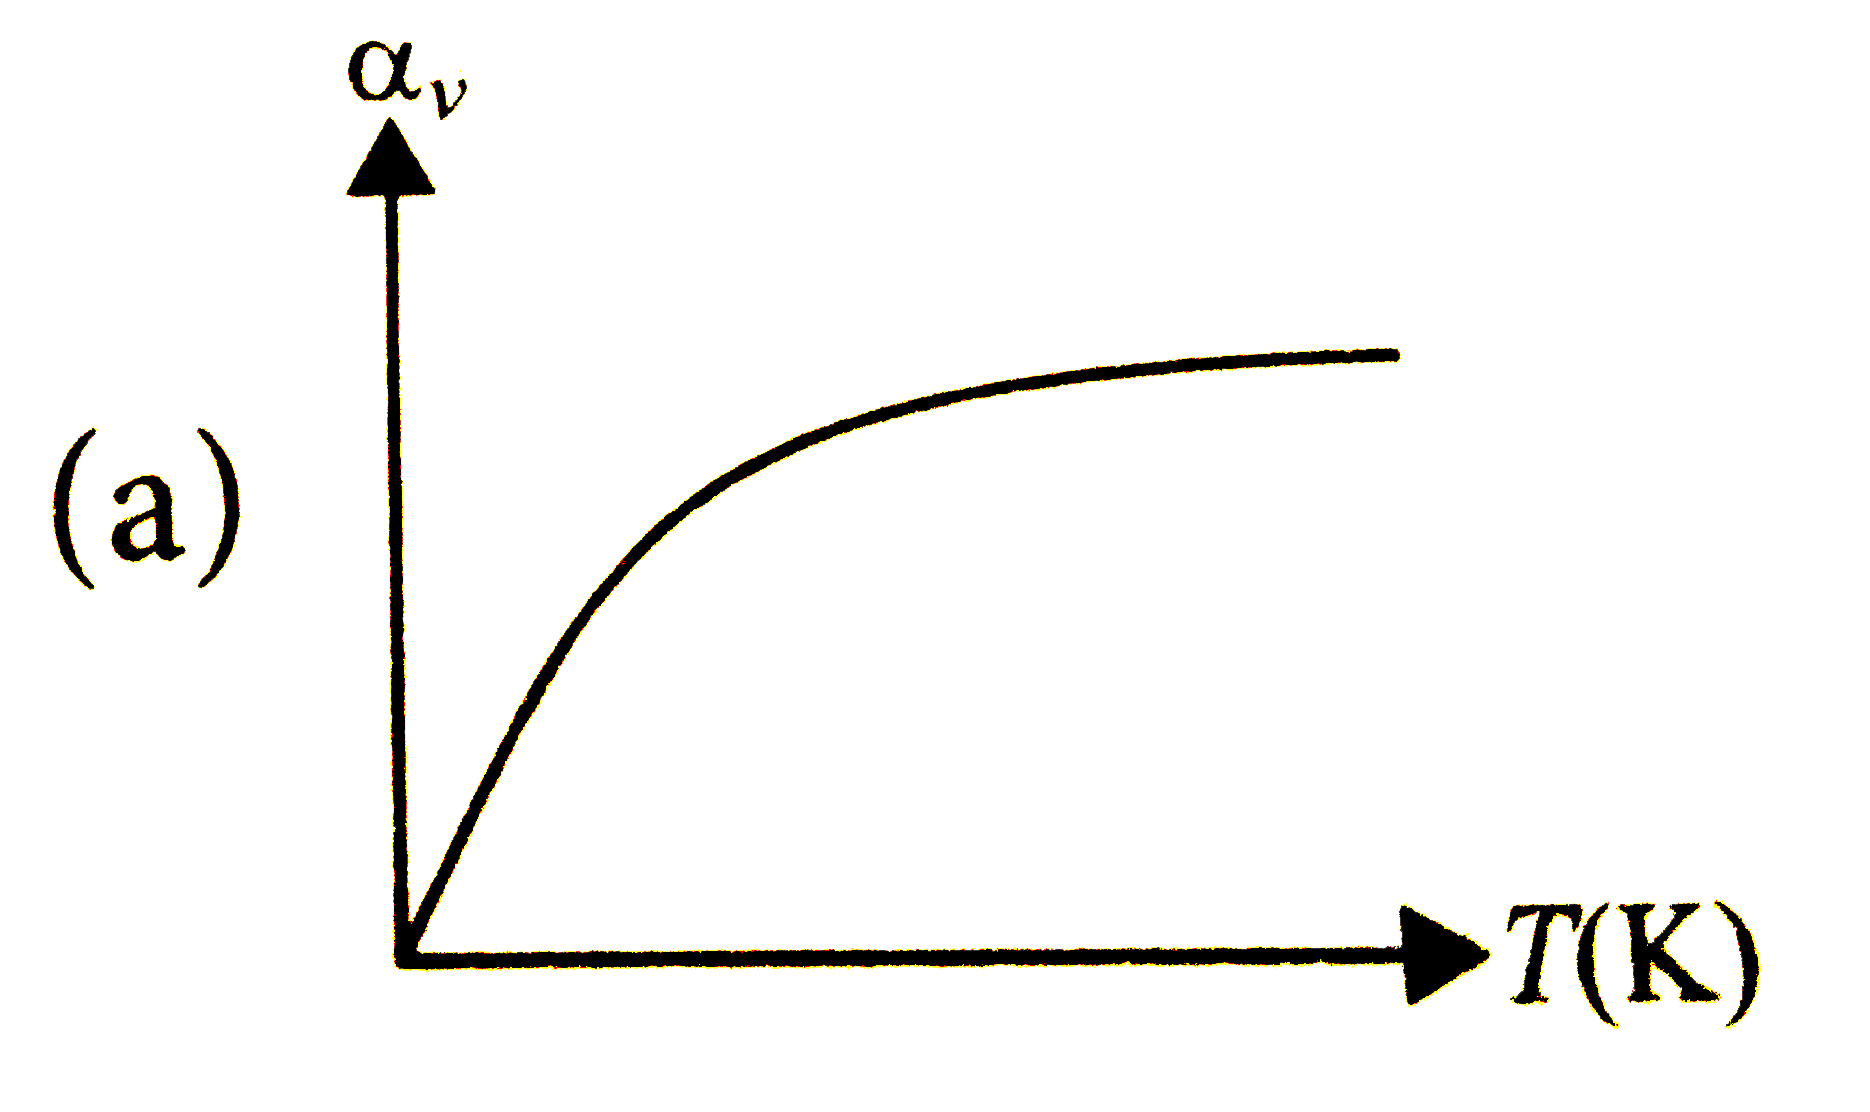 B
B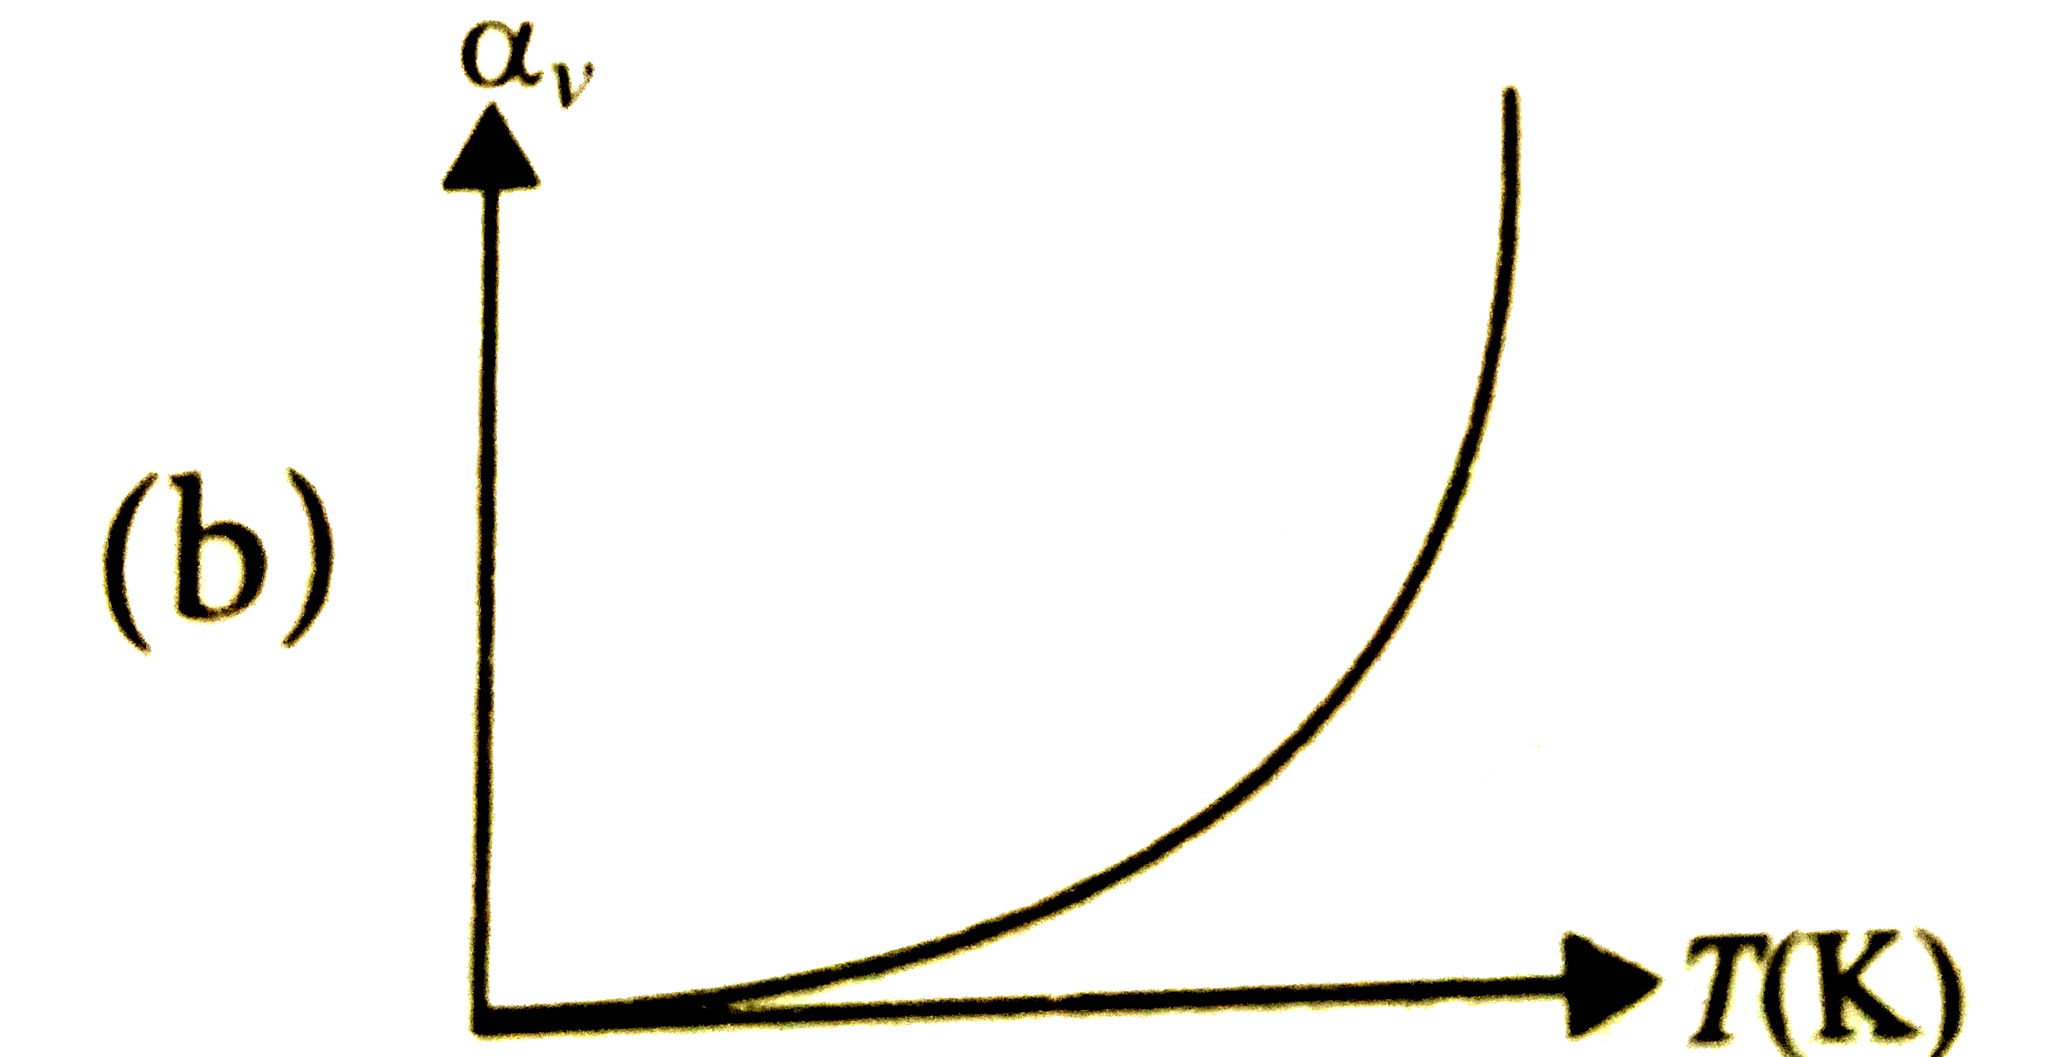 C
C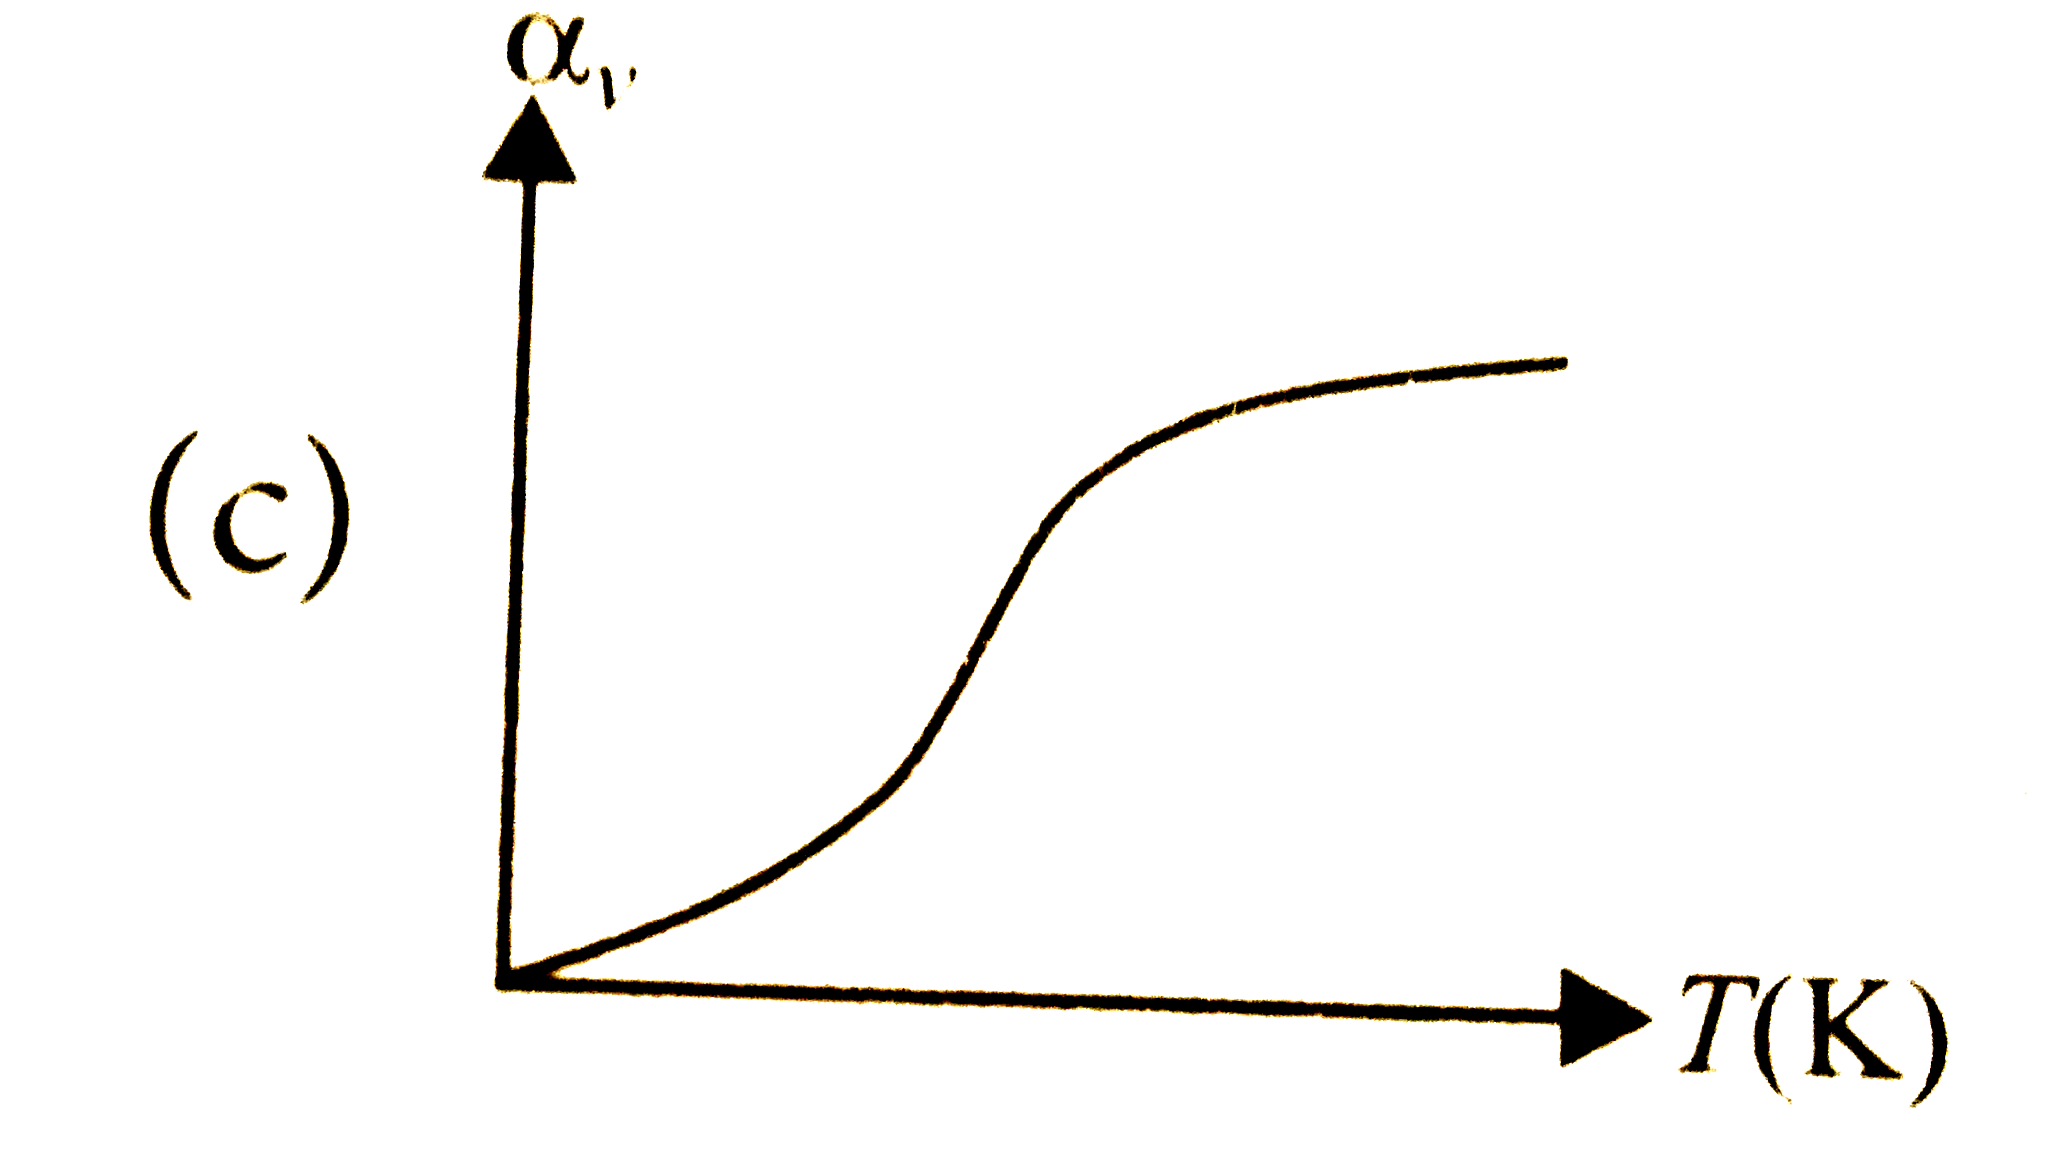 D
D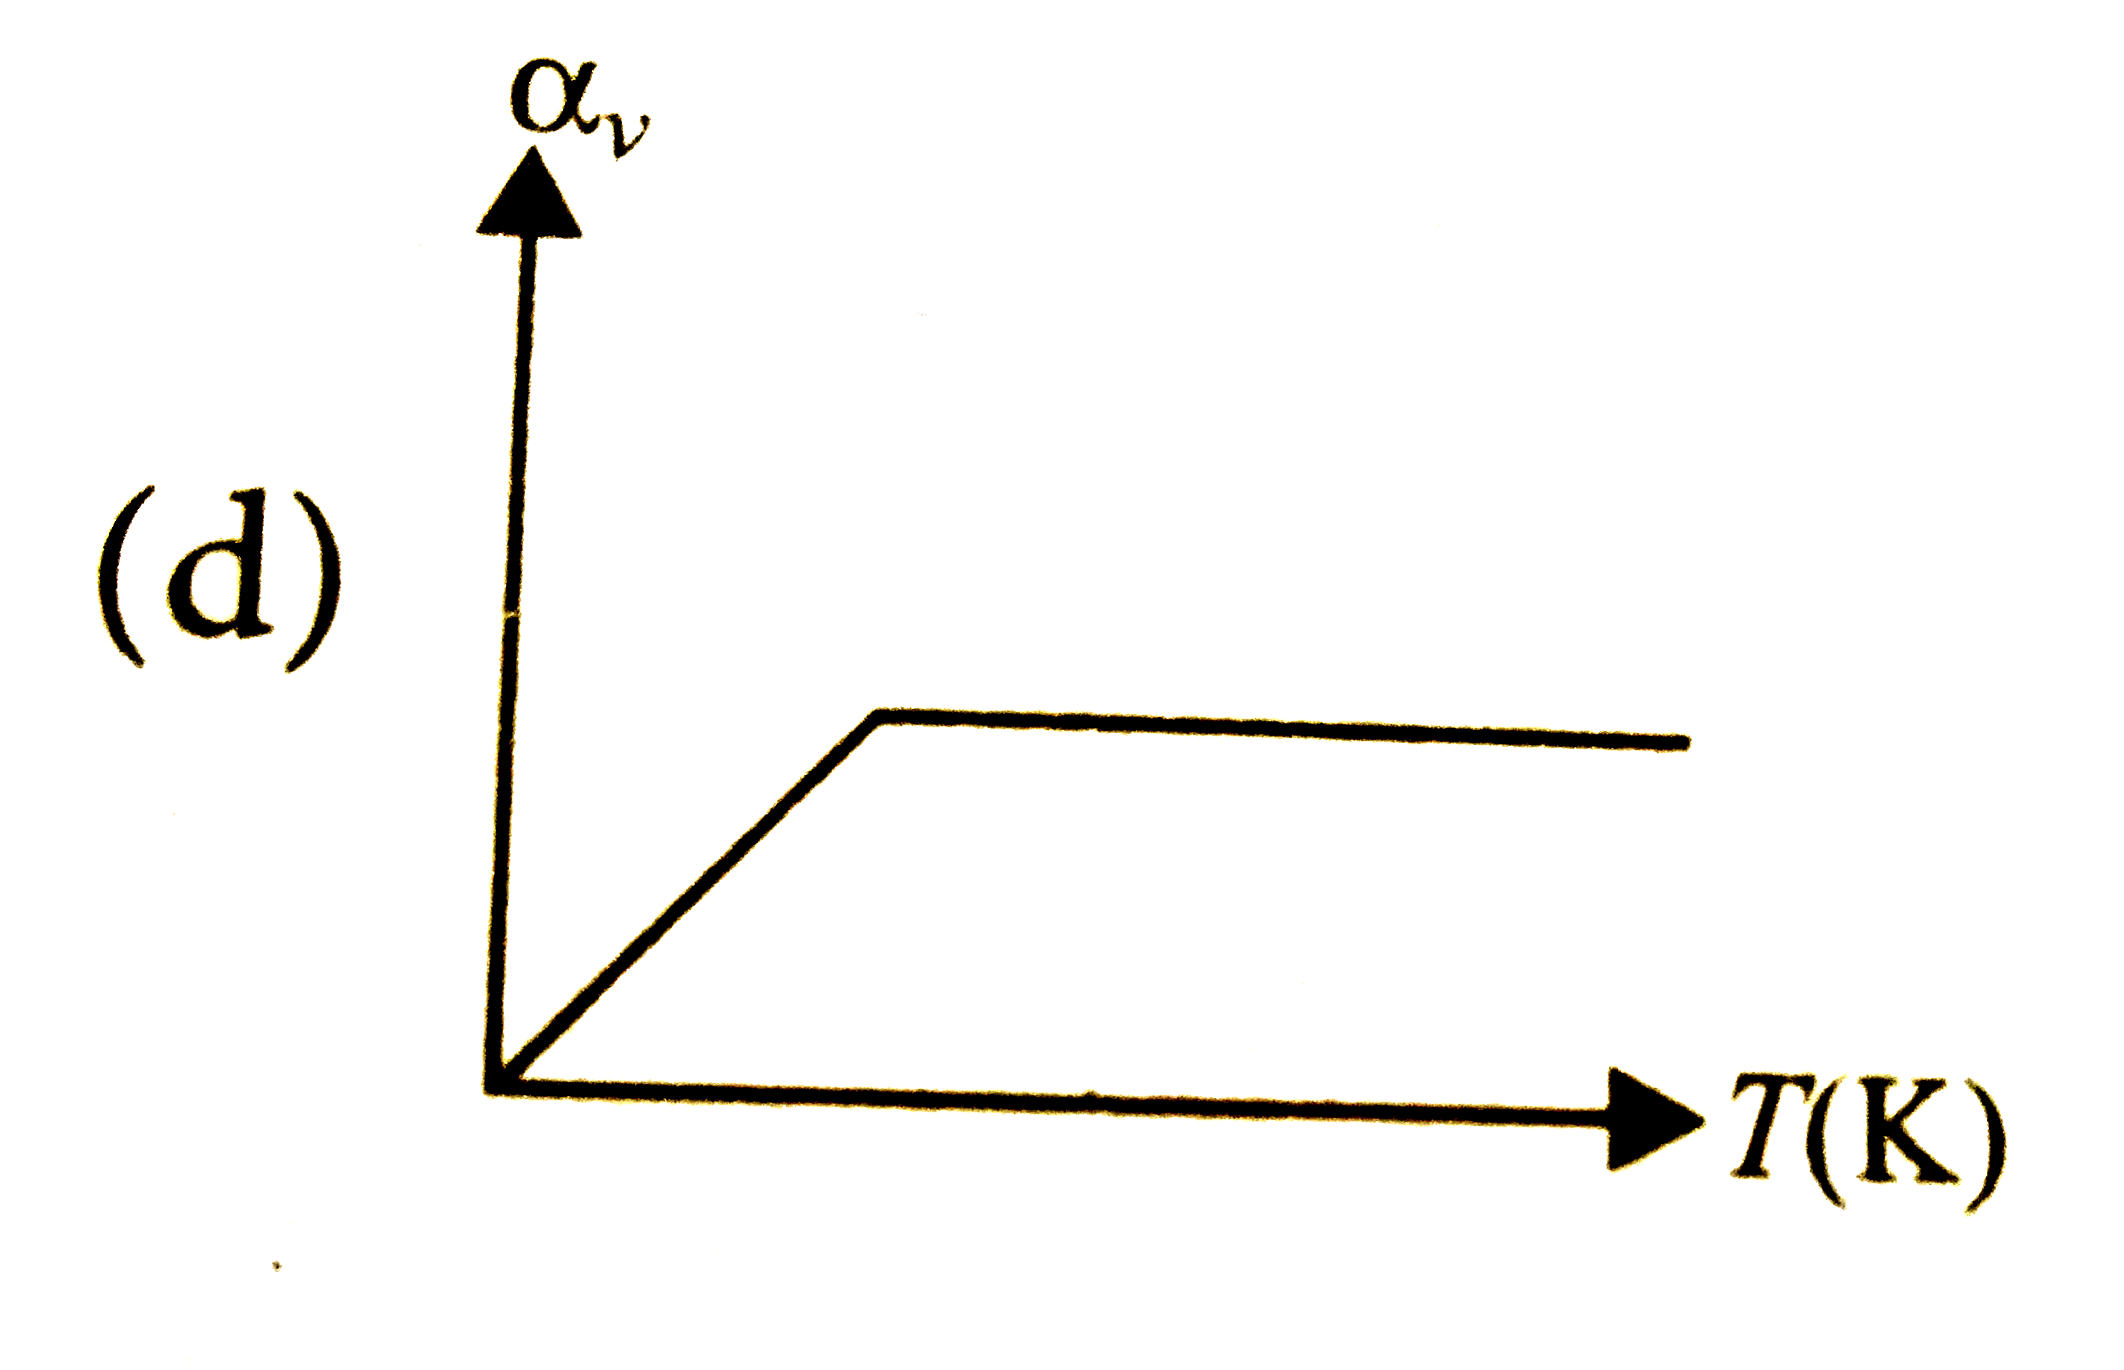
Which of the following graph shows the variationi of density of water increase in temperature ?
A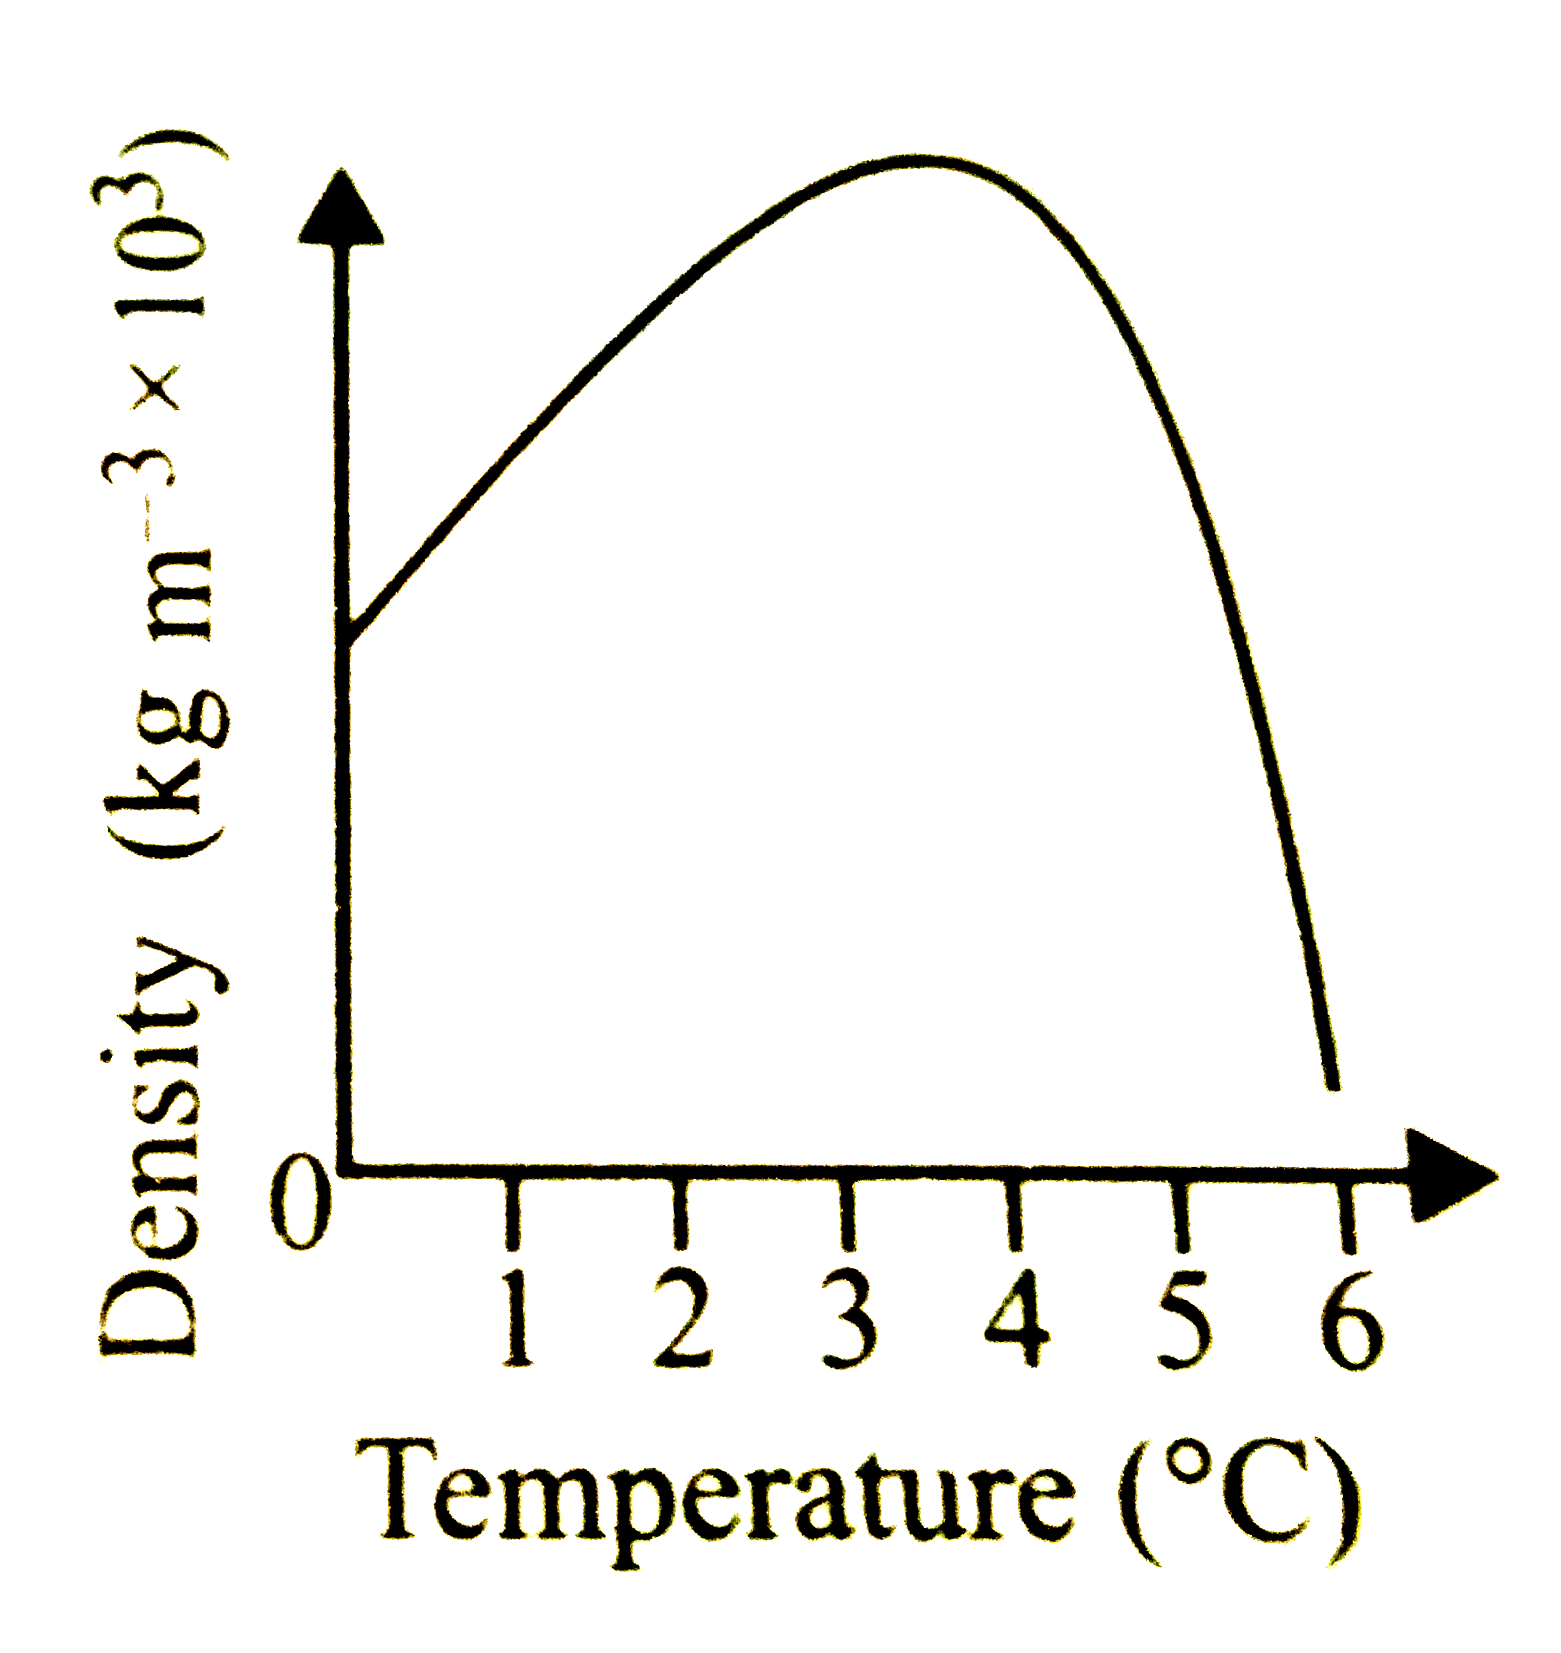 B
B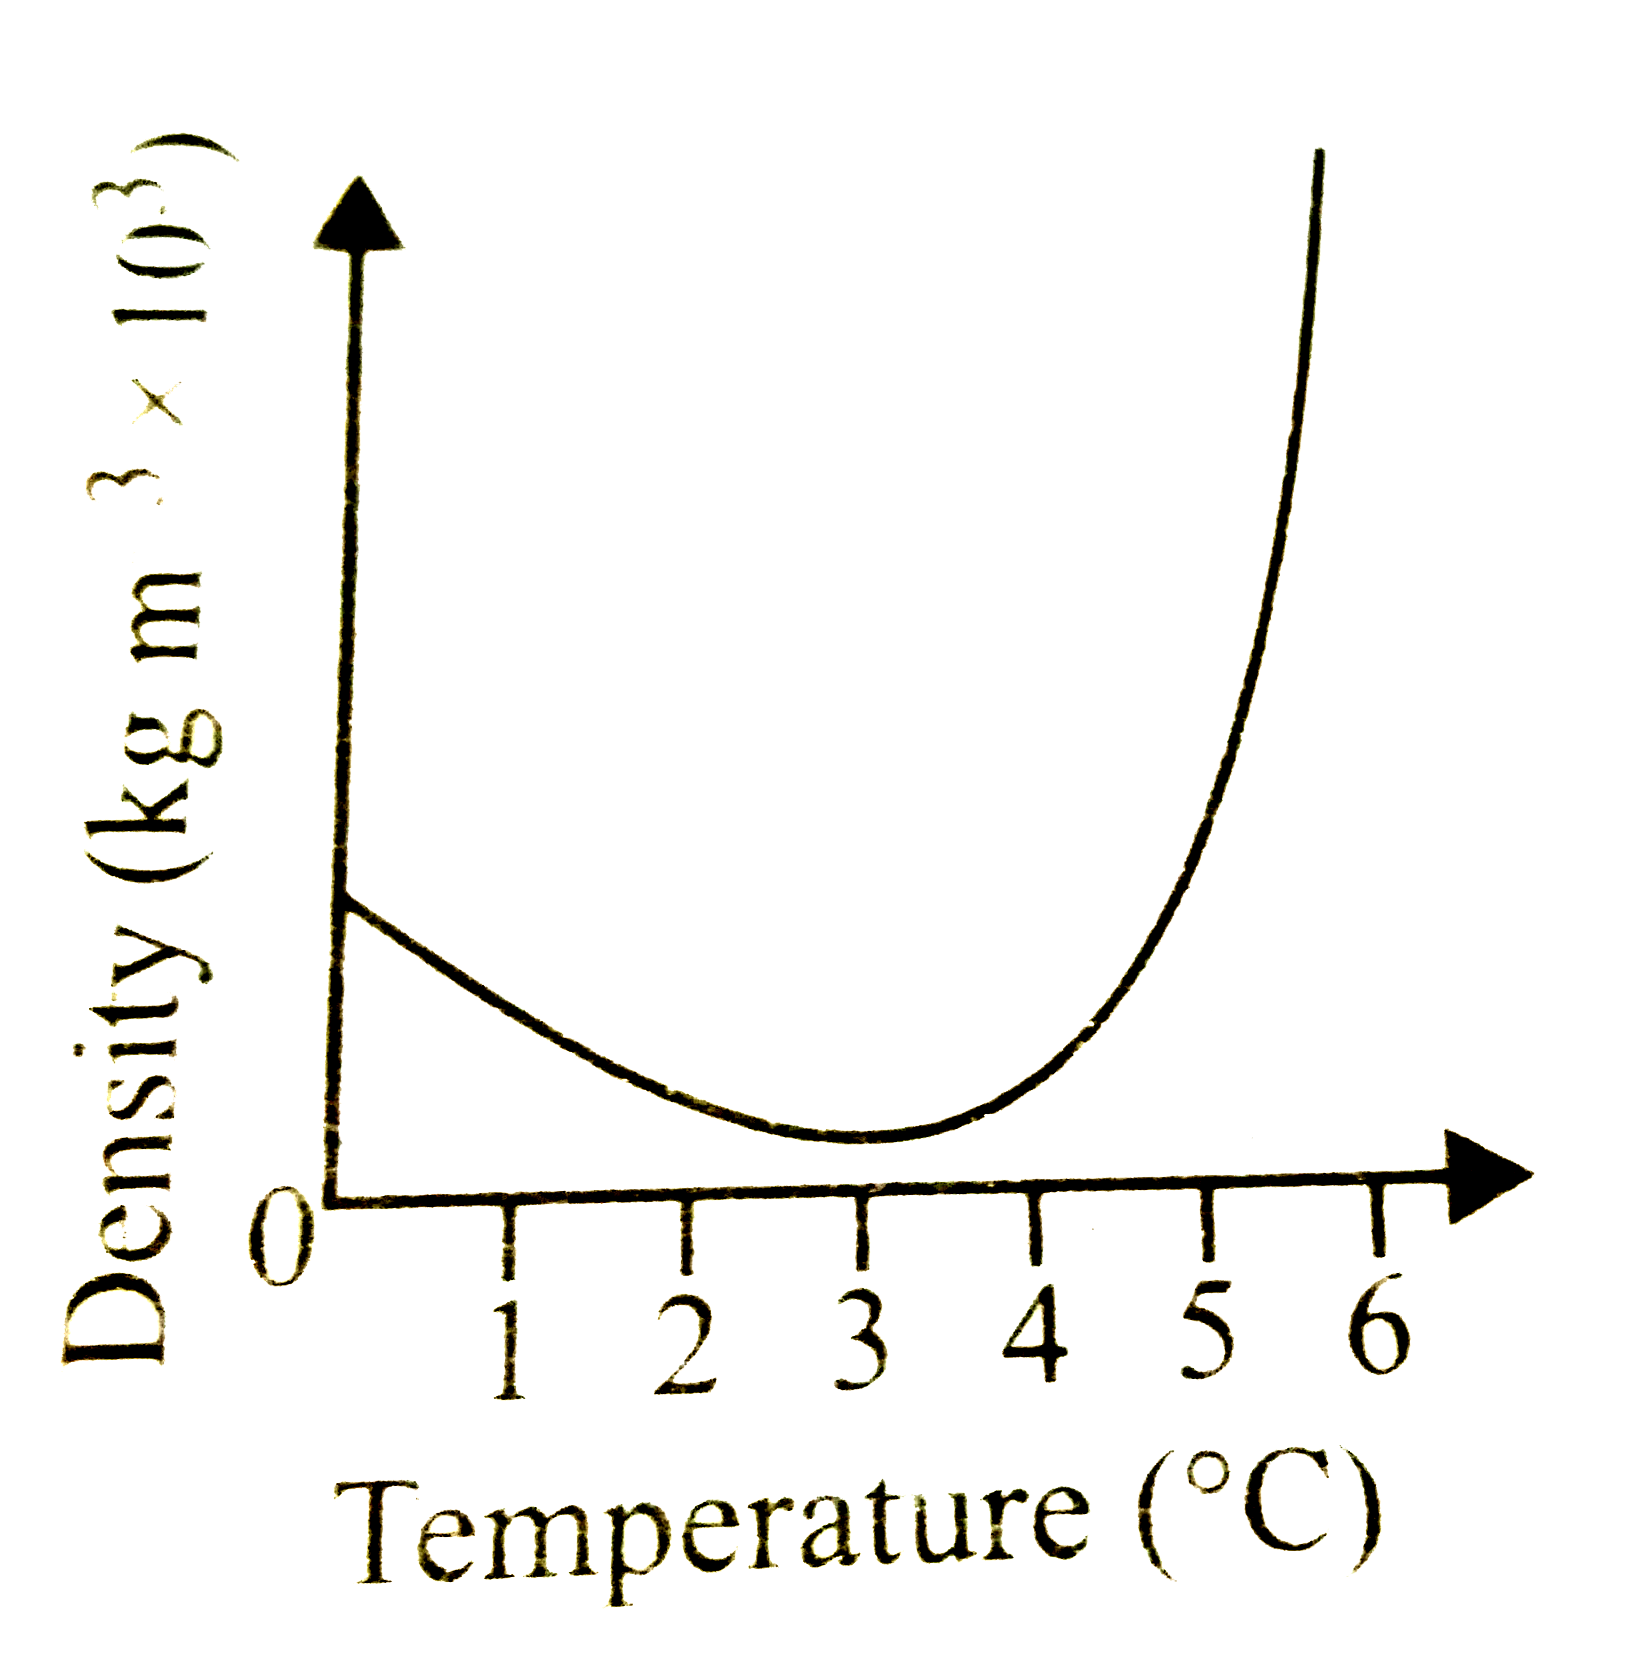 C
C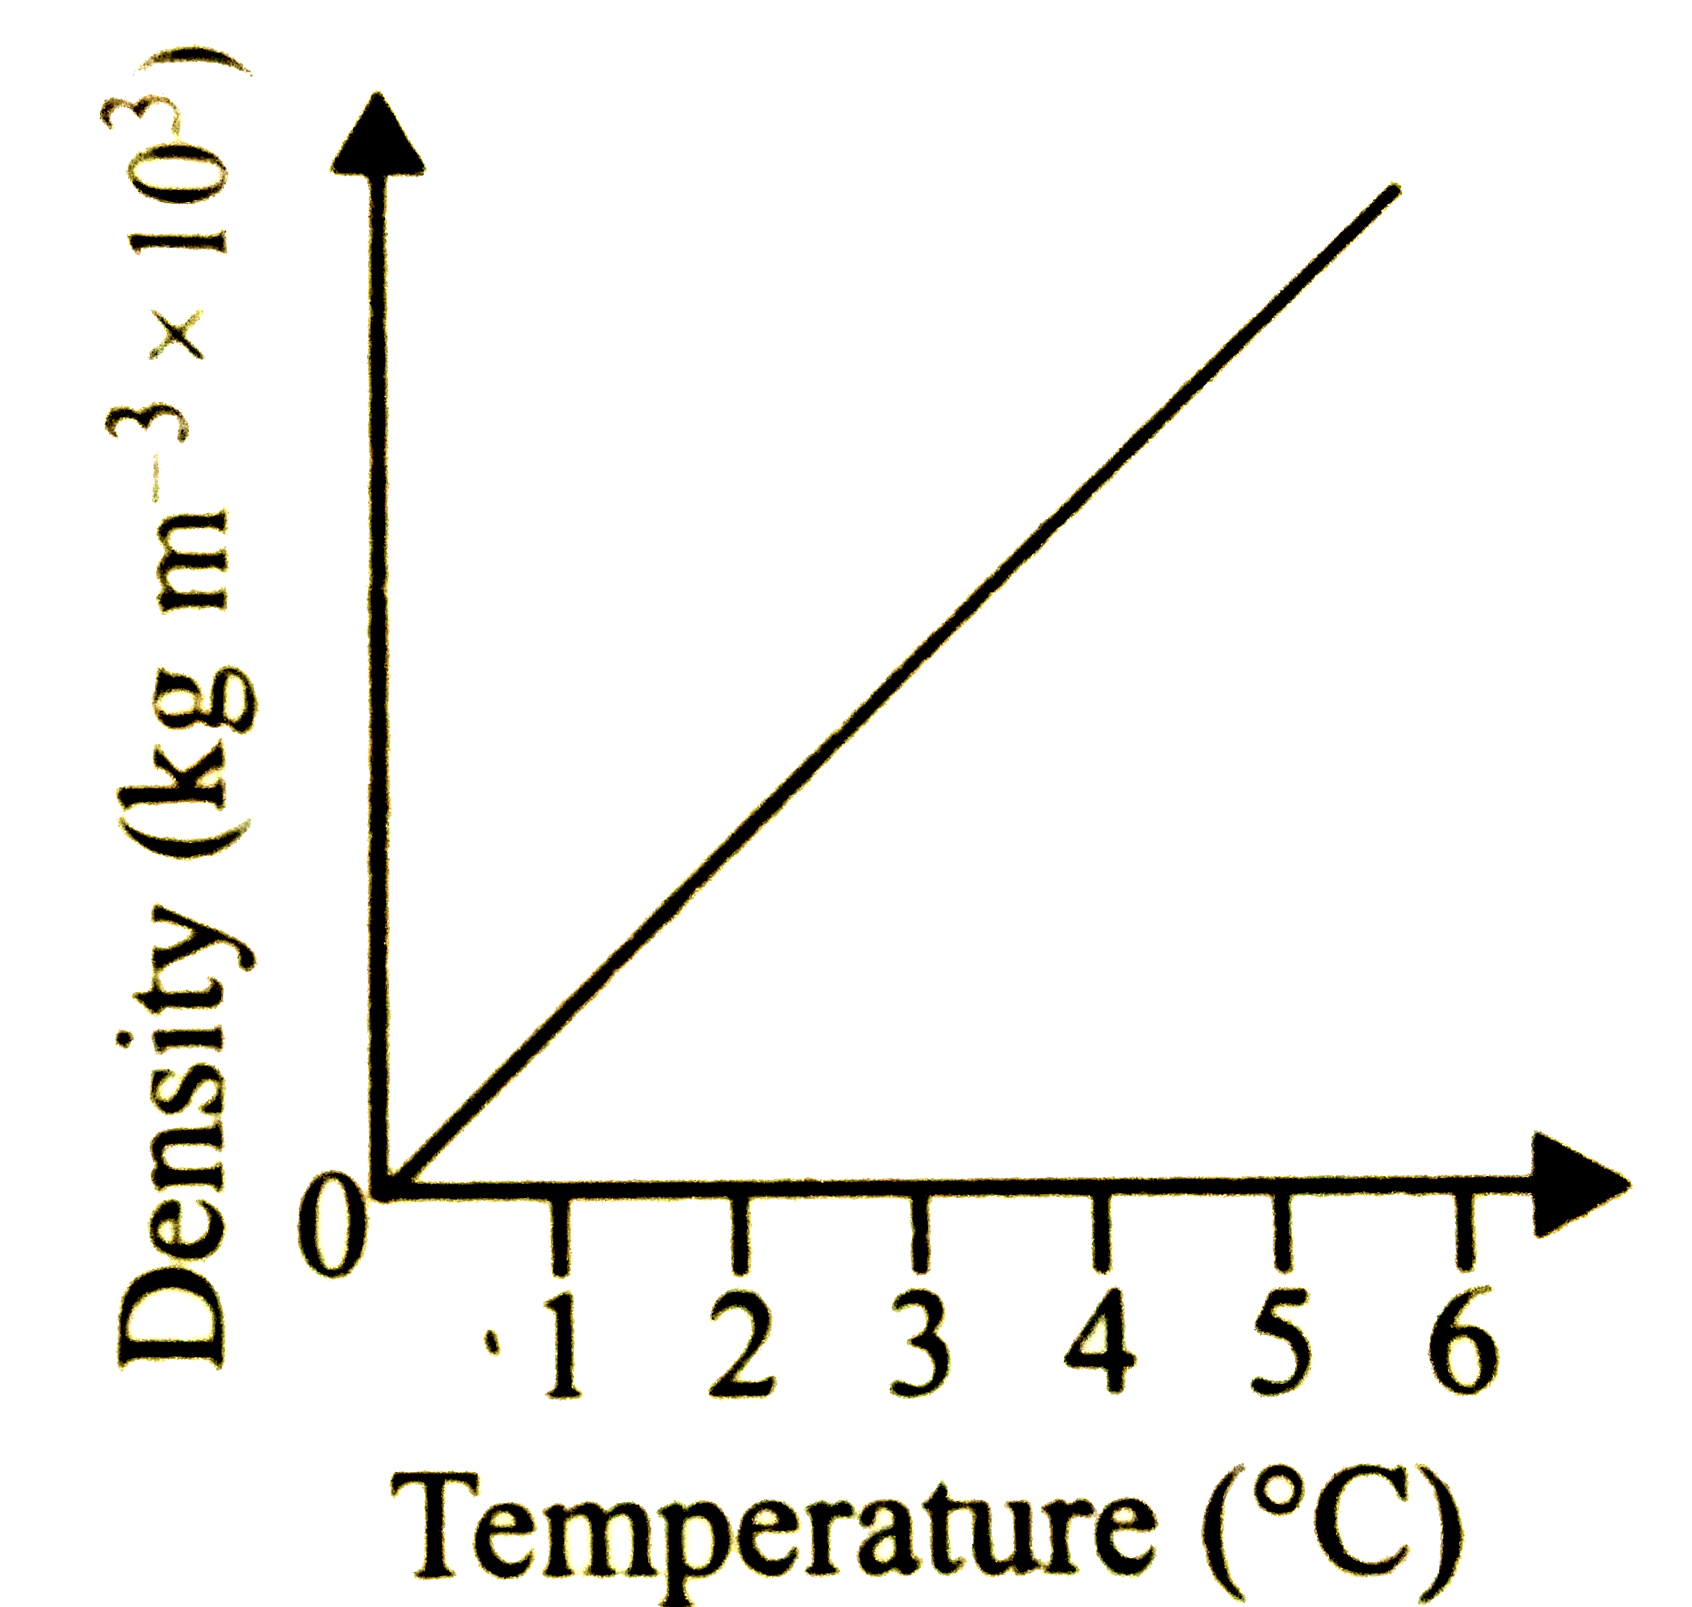 D
D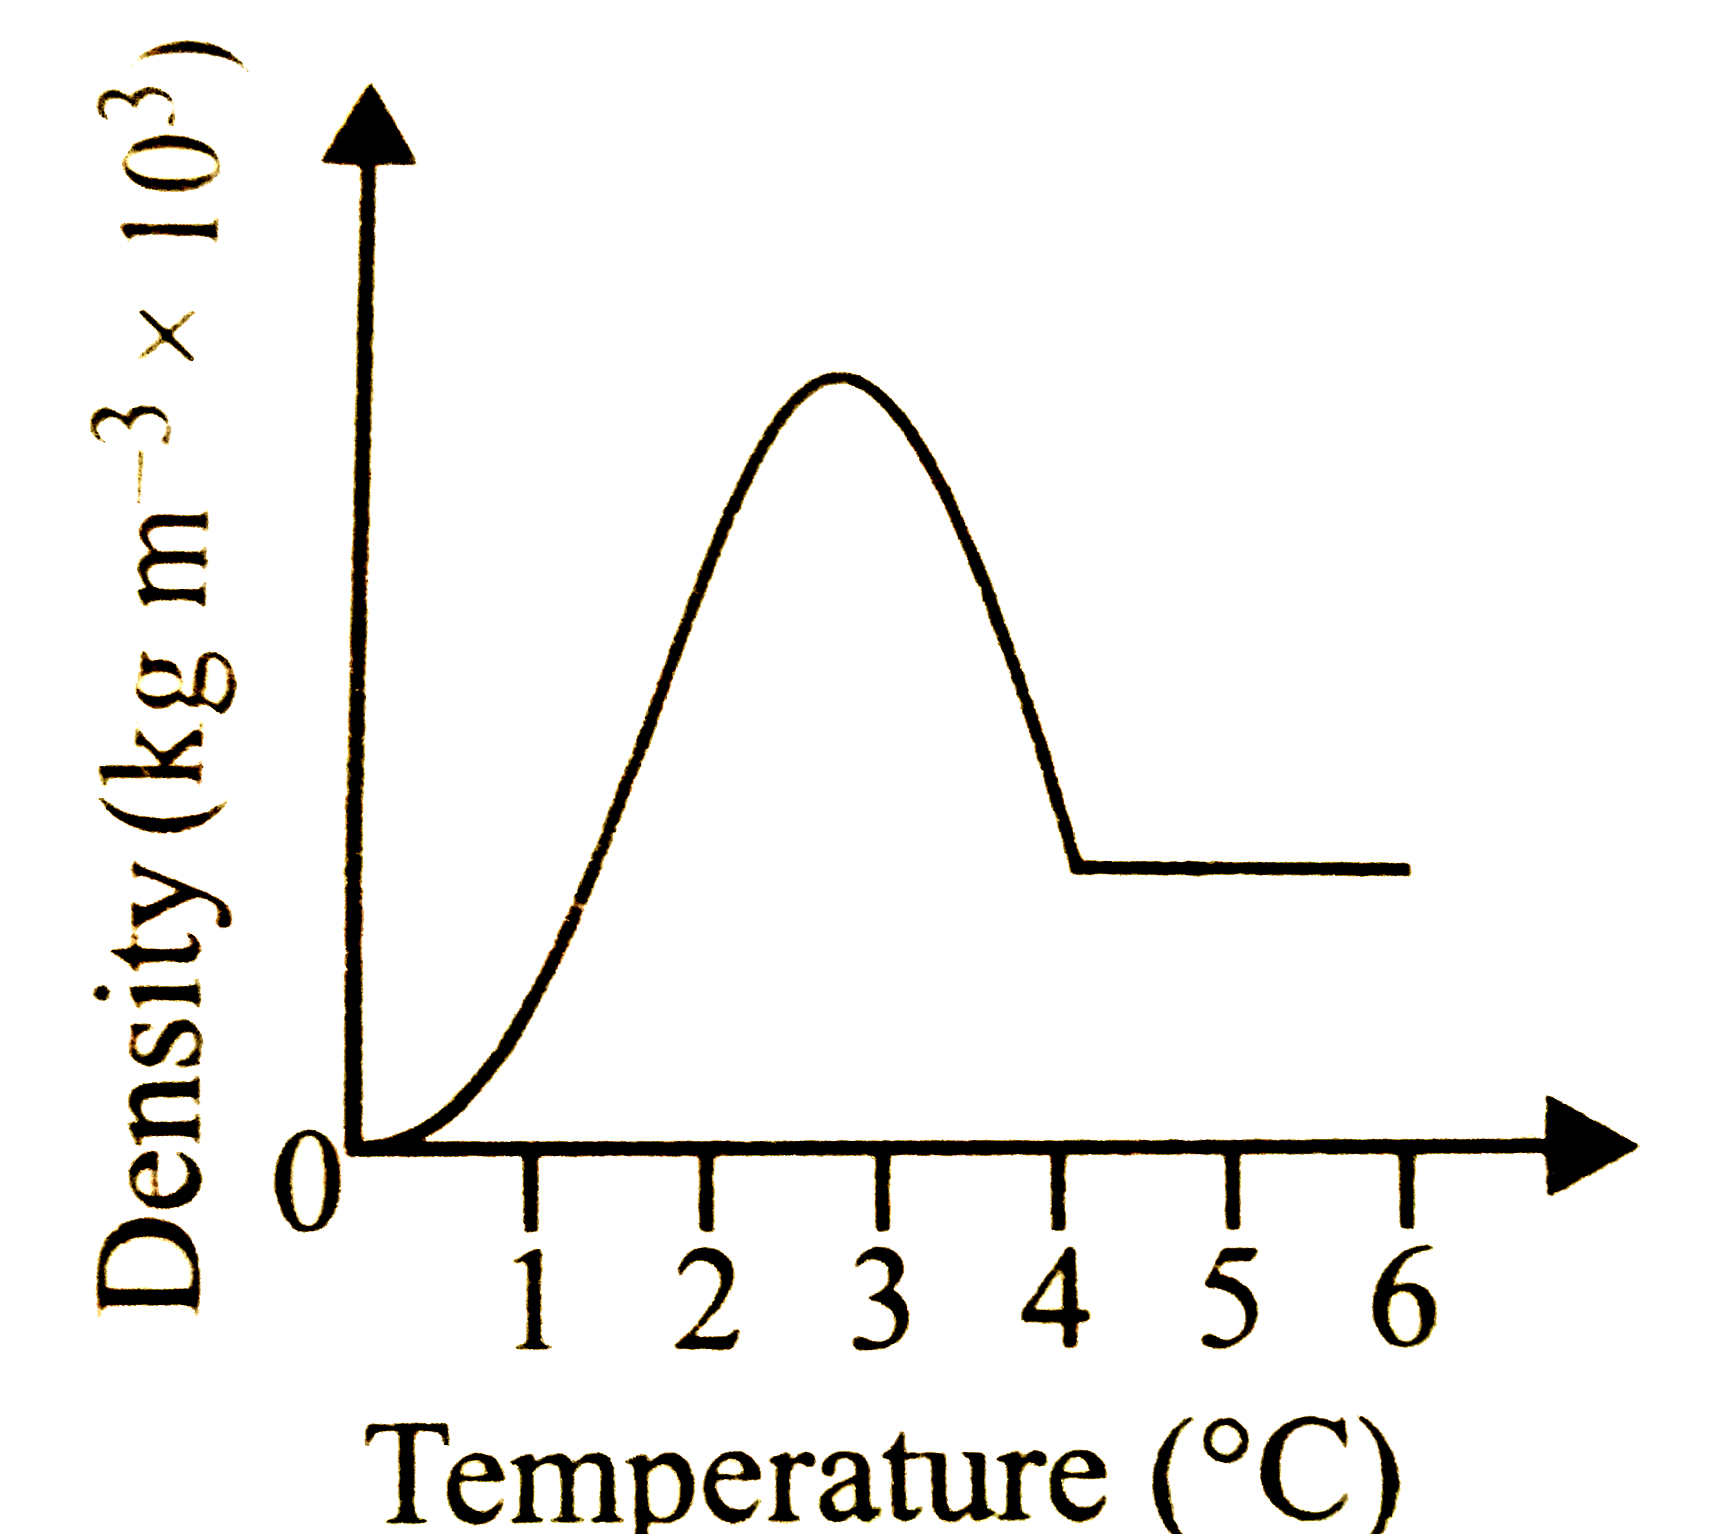
Figure (a) and figure (b) both are showing the variation of resistivity (p) with temperature (T) for some materials. Identify the types of these materials.
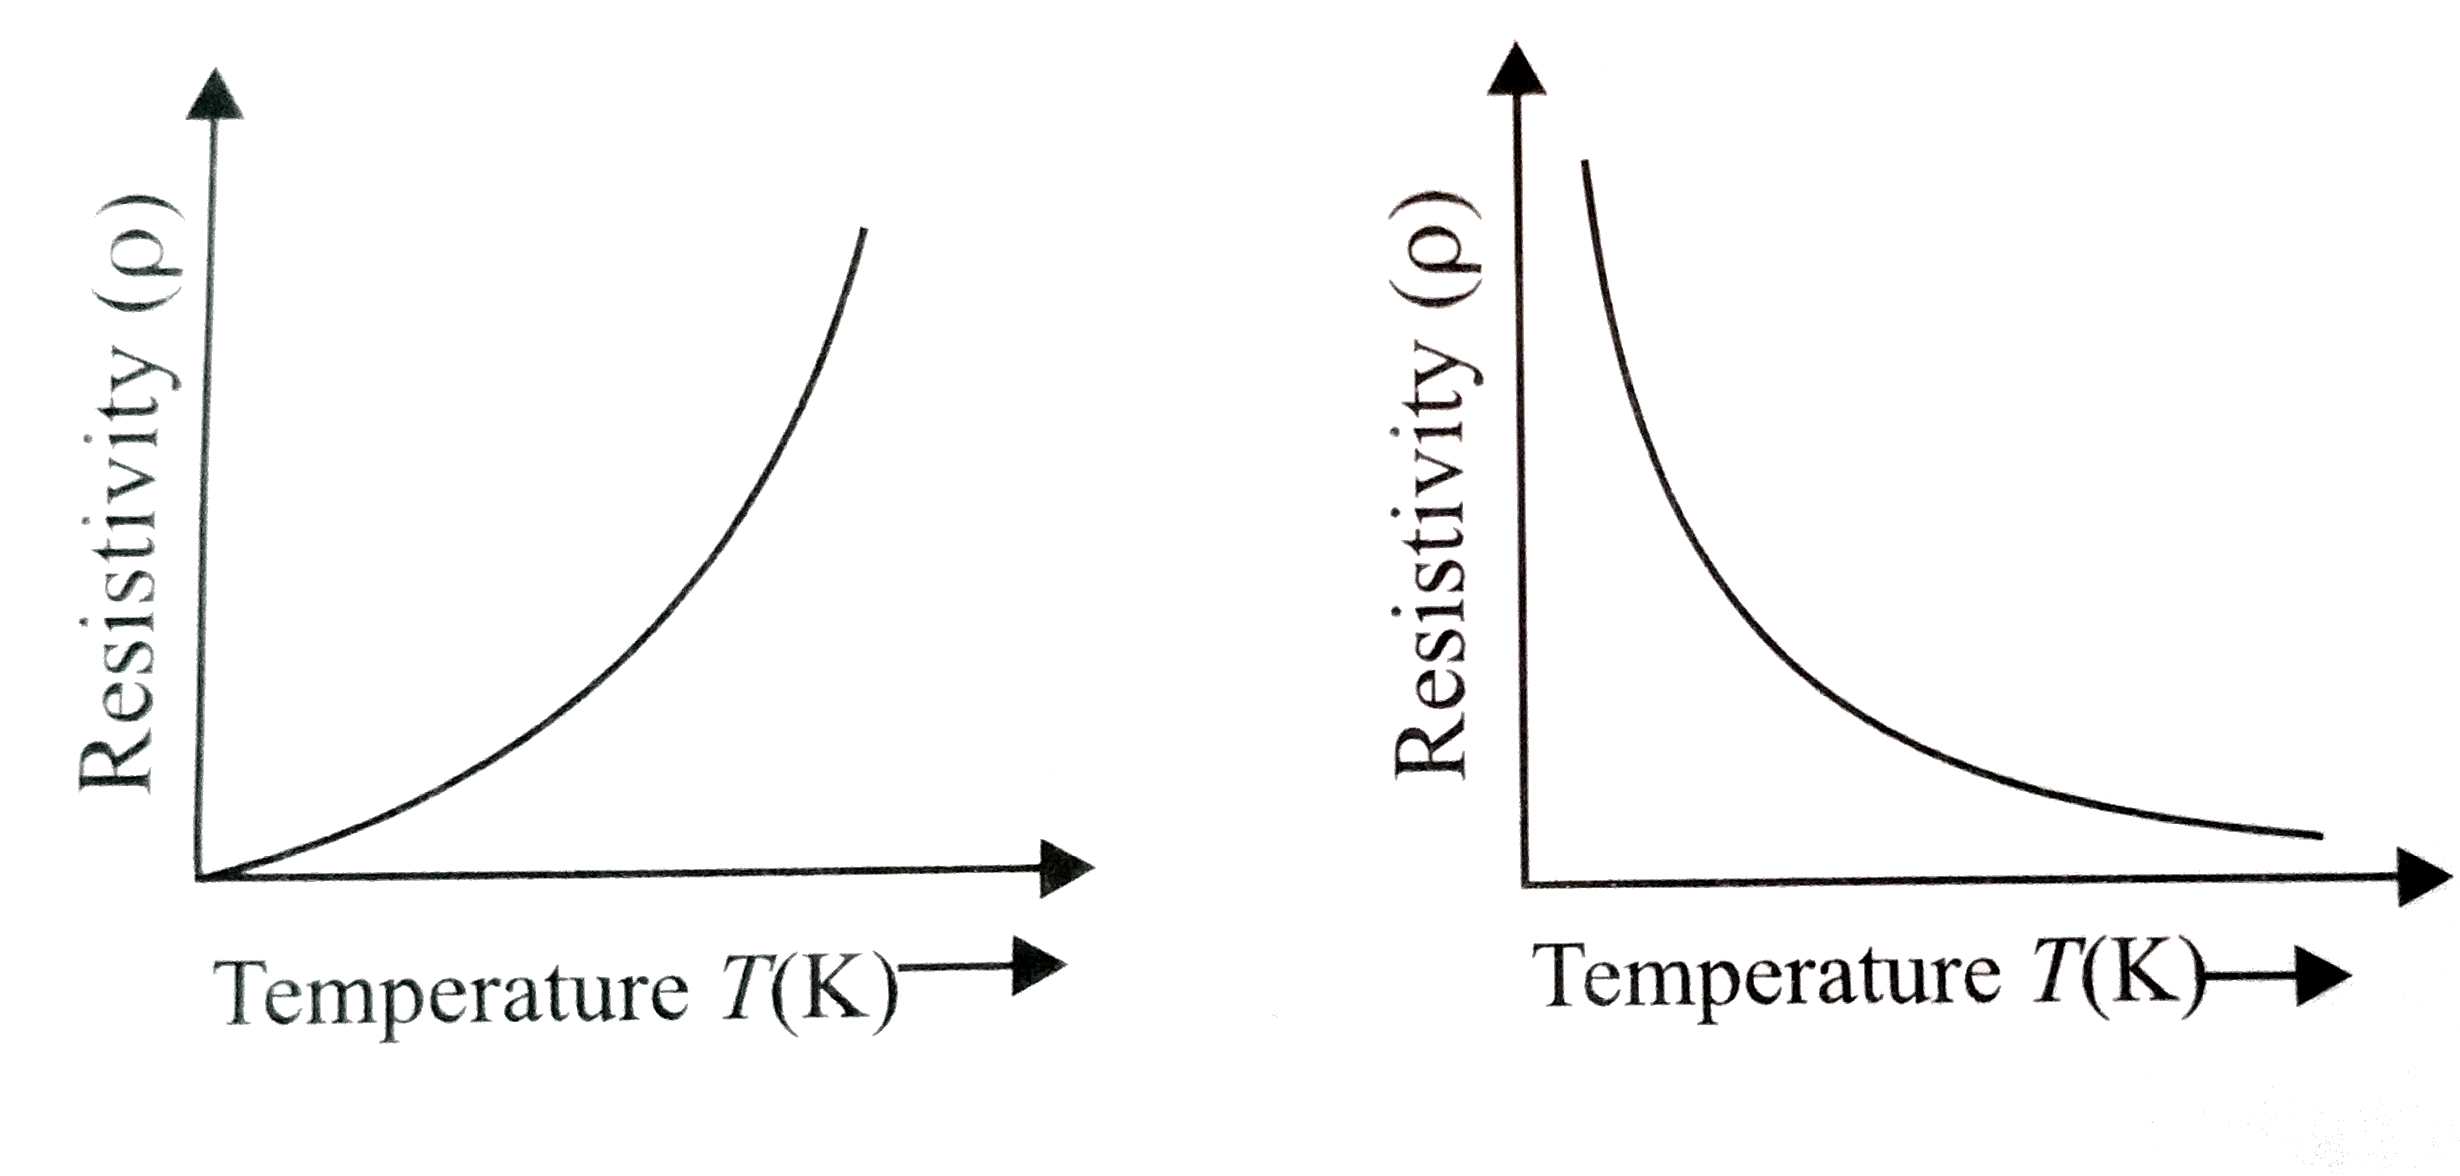 AConductor and semiconductorBConductor and InsulatorCInsulator and semiconductorDBoth are conductor
Draw a graph showing variation of resistivity with temperature for nichrome. Which property of nichrome is used to make standard resistance coils?
View SolutionDefine resistivity of a conductor. Plot a graph showing the variation of resistivity with temperature for a metallic conductor. How does one explain such a behaviour, using the mathematical expression of the resistivity of a material
View SolutionDraw a graph to show the variation in density of water with temperature in the temperature range from 0∘C to 10∘C.
View SolutionVariation of resistance of the conductor with temperature is shown . Temperature coefficient of the conductor is
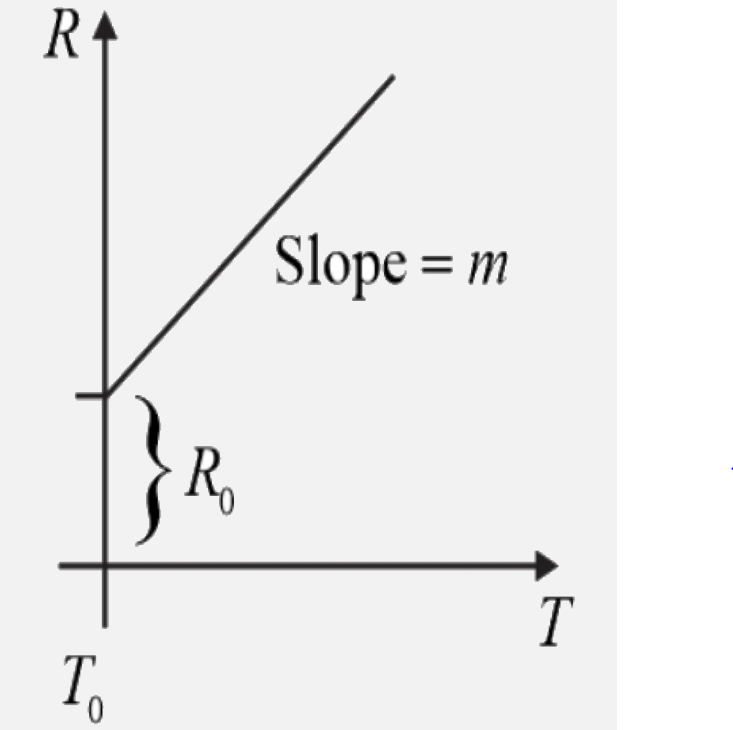
View SolutionA cusrve showing the variation of extent of adsorption with temperature at constant pressure is called……………
View Solution
