Define resistivity of a conductor. Plot a graph showing the variation of resistivity with temperature for a metallic conductor. How does one explain such a behaviour, using the mathematical expression of the resistivity of a material
Step-by-Step Solution
Step 1: Define Resistivity of a Conductor
Resistivity (ρ) is a fundamental property of a material that quantifies how strongly it resists the flow of electric current. It is defined as the resistance of a uniform material of unit length and unit cross-sectional area. The unit of resistivity is ohm-meter (Ω·m).
Step 2: Mathematical Expression for Resistivity and Temperature
The resistivity of a metallic conductor varies with temperature and can be mathematically expressed as:
ρ=ρ0(1+αΔT)
where:
- ρ is the resistivity at temperature T,
- ρ0 is the resistivity at the initial temperature T0,
- α is the temperature coefficient of resistivity,
- ΔT=T−T0 is the change in temperature.
Step 3: Understanding the Behavior of Resistivity with Temperature
From the equation, we can see that as the temperature increases (ΔT becomes positive), the term αΔT also increases, leading to an increase in resistivity ρ. This indicates that metallic conductors generally have higher resistivity at higher temperatures.
Step 4: Plotting the Graph
To plot the graph of resistivity (ρ) versus temperature (T):
- The x-axis will represent temperature (T).
- The y-axis will represent resistivity (ρ).
- The graph will start at the point ρ0 when T=T0 and will slope upwards, indicating that resistivity increases linearly with temperature.
Step 5: Analyzing the Graph
The graph will be a straight line with:
- A positive slope, indicating that as temperature increases, resistivity also increases.
- The y-intercept at ρ0, which represents the resistivity at the initial temperature T0.
Conclusion
The behavior of resistivity with temperature can be explained by the mathematical expression that shows a direct relationship between temperature and resistivity. As temperature increases, the resistivity of metallic conductors increases due to increased atomic vibrations, which impede the flow of electrons.
---
Resistivity (ρ) is a fundamental property of a material that quantifies how strongly it resists the flow of electric current. It is defined as the resistance of a uniform material of unit length and unit cross-sectional area. The unit of resistivity is ohm-meter (Ω·m).
The resistivity of a metallic conductor varies with temperature and can be mathematically expressed as:
ρ=ρ0(1+αΔT)
where:
- ρ is the resistivity at temperature T,
- ρ0 is the resistivity at the initial temperature T0,
- α is the temperature coefficient of resistivity,
- ΔT=T−T0 is the change in temperature.
From the equation, we can see that as the temperature increases (ΔT becomes positive), the term αΔT also increases, leading to an increase in resistivity ρ. This indicates that metallic conductors generally have higher resistivity at higher temperatures.
To plot the graph of resistivity (ρ) versus temperature (T):
- The x-axis will represent temperature (T).
- The y-axis will represent resistivity (ρ).
- The graph will start at the point ρ0 when T=T0 and will slope upwards, indicating that resistivity increases linearly with temperature.
The graph will be a straight line with:
- A positive slope, indicating that as temperature increases, resistivity also increases.
- The y-intercept at ρ0, which represents the resistivity at the initial temperature T0.
The behavior of resistivity with temperature can be explained by the mathematical expression that shows a direct relationship between temperature and resistivity. As temperature increases, the resistivity of metallic conductors increases due to increased atomic vibrations, which impede the flow of electrons.
Topper's Solved these Questions
- DC CIRCUITBook:VMC MODULES ENGLISHChapter:DC CIRCUITExercise:LEVEL-0 LONG ANSWER TYPE
Explore 3 Videos
- DC CIRCUITBook:VMC MODULES ENGLISHChapter:DC CIRCUITExercise:LEVEL-1 DAILY TUTORIAL SHEET-1
Explore 15 Videos
- DC CIRCUITBook:VMC MODULES ENGLISHChapter:DC CIRCUITExercise:LEVEL-0 SHORT ANSWER TYPE
Explore 9 Videos
- CURRENT ELECTRICITYBook:VMC MODULES ENGLISHChapter:CURRENT ELECTRICITYExercise:IN-CHAPTER EXERCISE-F
Explore 10 Videos
- DYNAMICS OF A PARTICLEBook:VMC MODULES ENGLISHChapter:DYNAMICS OF A PARTICLEExercise:JEE Advance (Archive) Level - II (SINGLE OPTION CORRECT TYPE )
Explore 31 Videos
Similar Questions
Knowledge Check
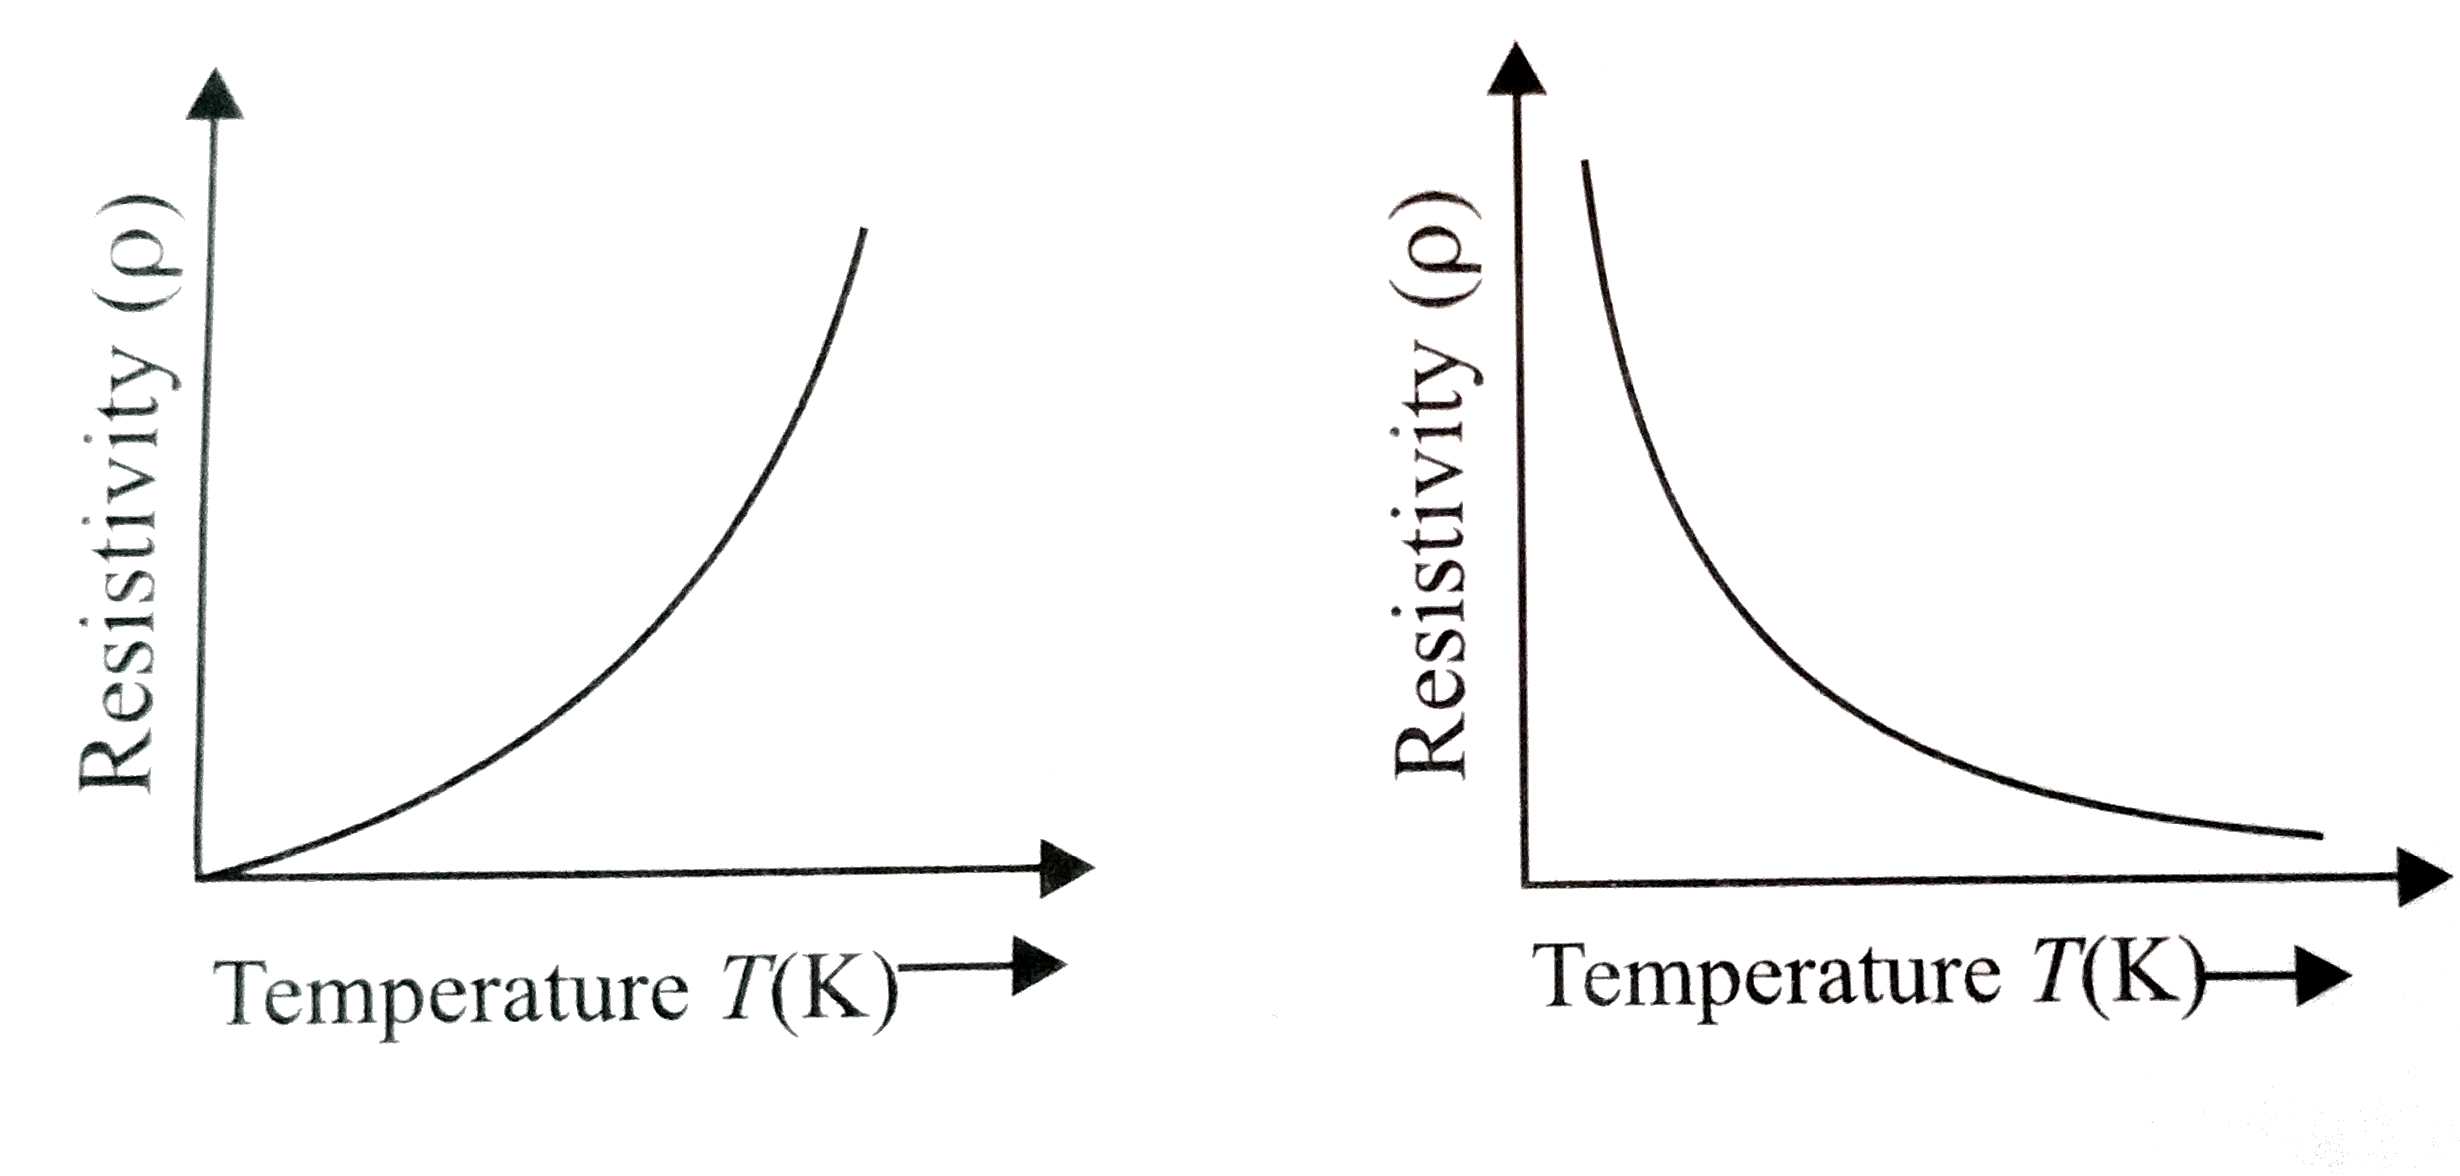
Figure (a) and figure (b) both are showing the variation of resistivity (p) with temperature (T) for some materials. Identify the types of these materials.
 AConductor and semiconductorBConductor and InsulatorCInsulator and semiconductorDBoth are conductor
Which of the following graph represents the variation of resistivity (ρ) with temperature (T) for copper?
View SolutionDraw a graph showing variation of resistivity with temperature for nichrome. Which property of nichrome is used to make standard resistance coils?
View SolutionWhat is the range of resistivity of metallic conductors?
View SolutionThe difference in the variation of resistance with temperature in a metal and a semiconductor arises essentially due to the difference in the
View SolutionThe difference in the variation of resistance with temperature in a metal and a semiconductor arises essentially due to the difference in the
View SolutionShow variation of resistivity of copper as a function of temperature in a graph.
View SolutionDraw a plot showing the variation at resistivity of a (i) conductor and (ii) semiconductor, with the increase in temperature.
View Solution
