The following two tables give the distribution of students of two sections according to the marks obtained by them:
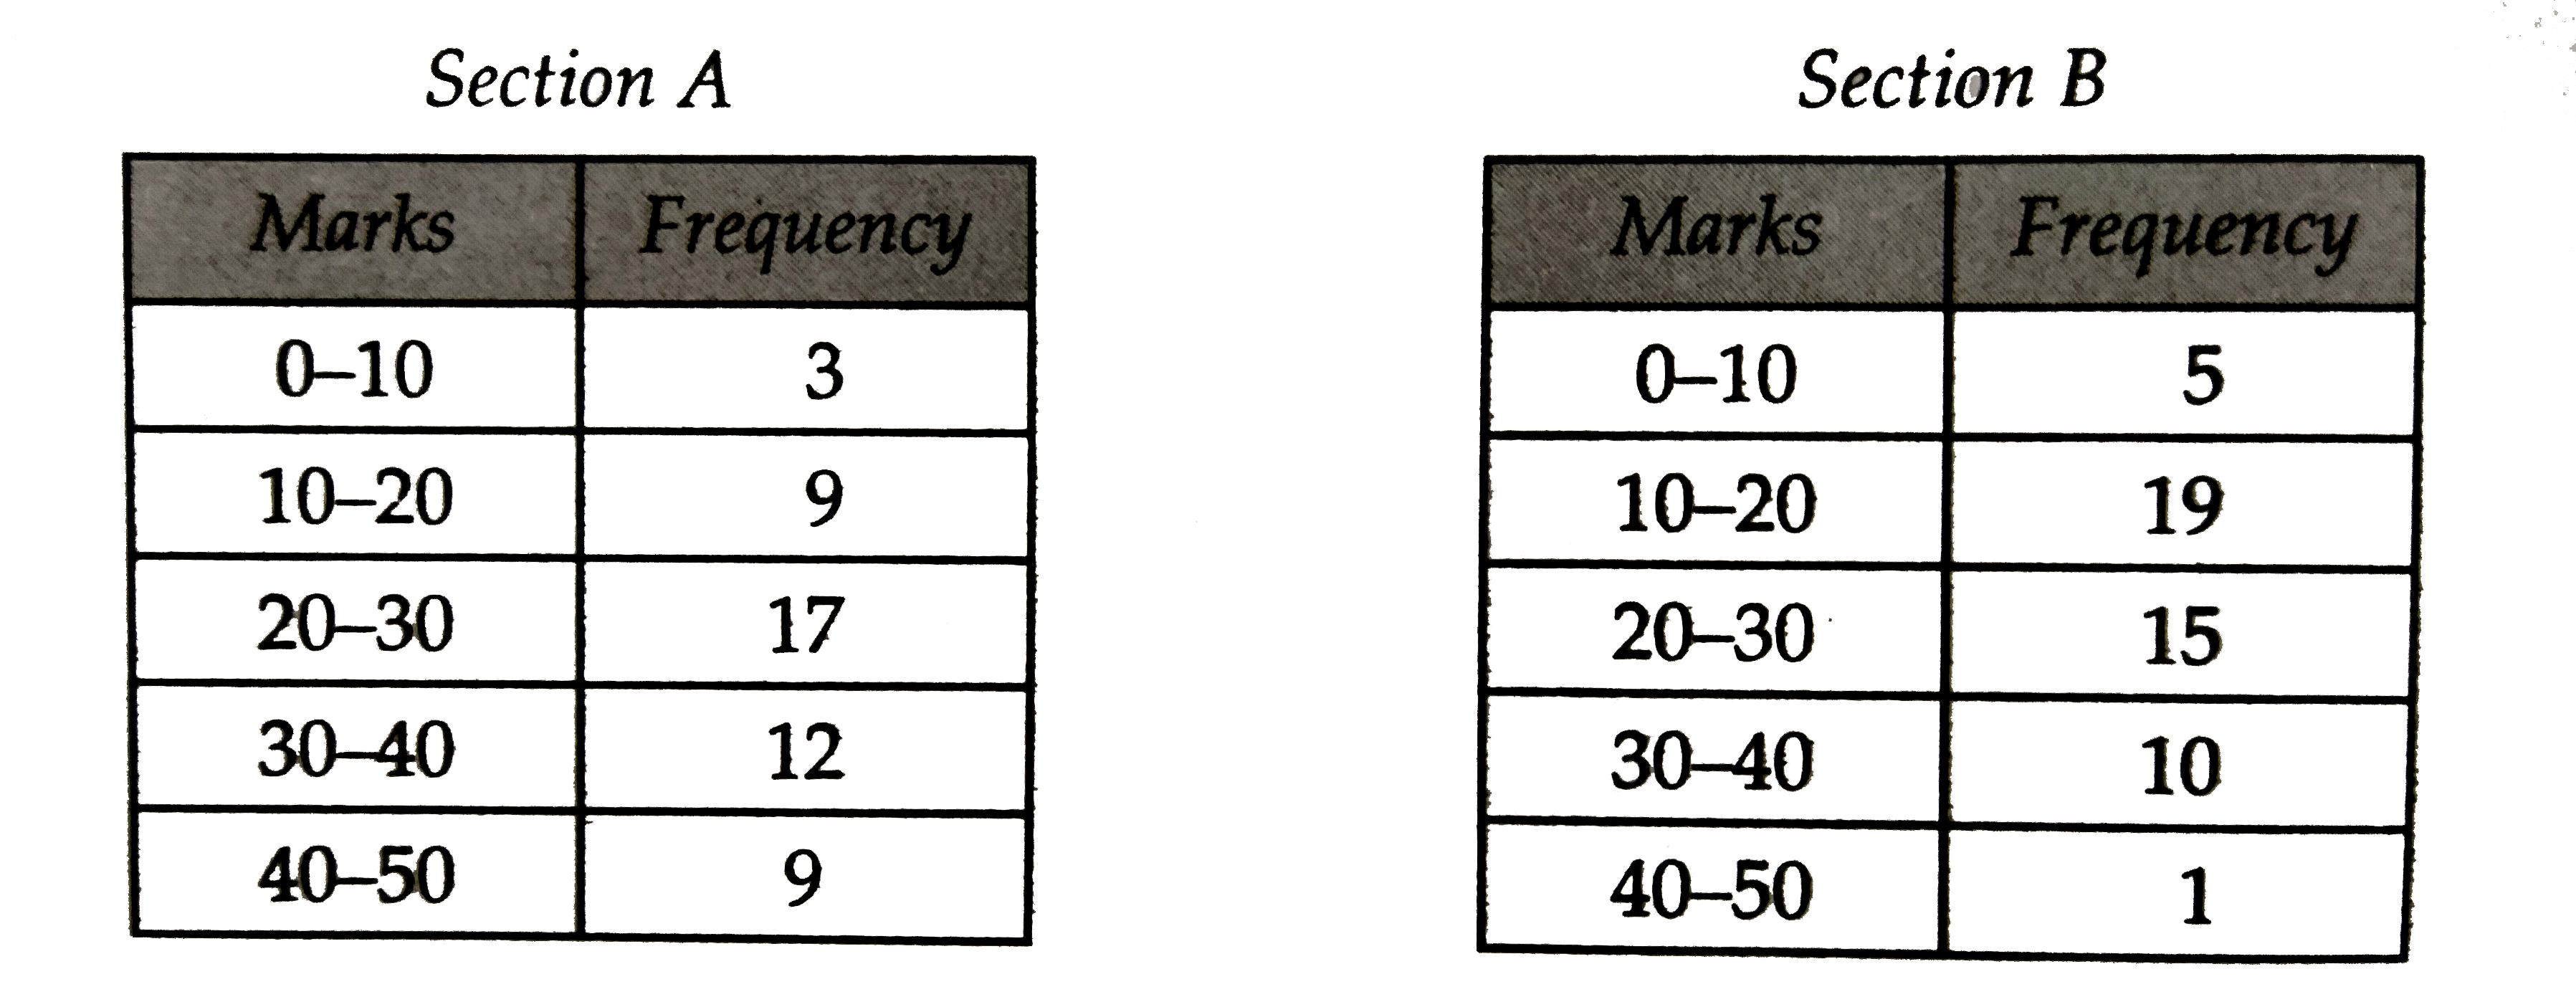
Represent the marks of both the sections on the same graph by two frequency polygons.
First we obtain the class marks as shown below.
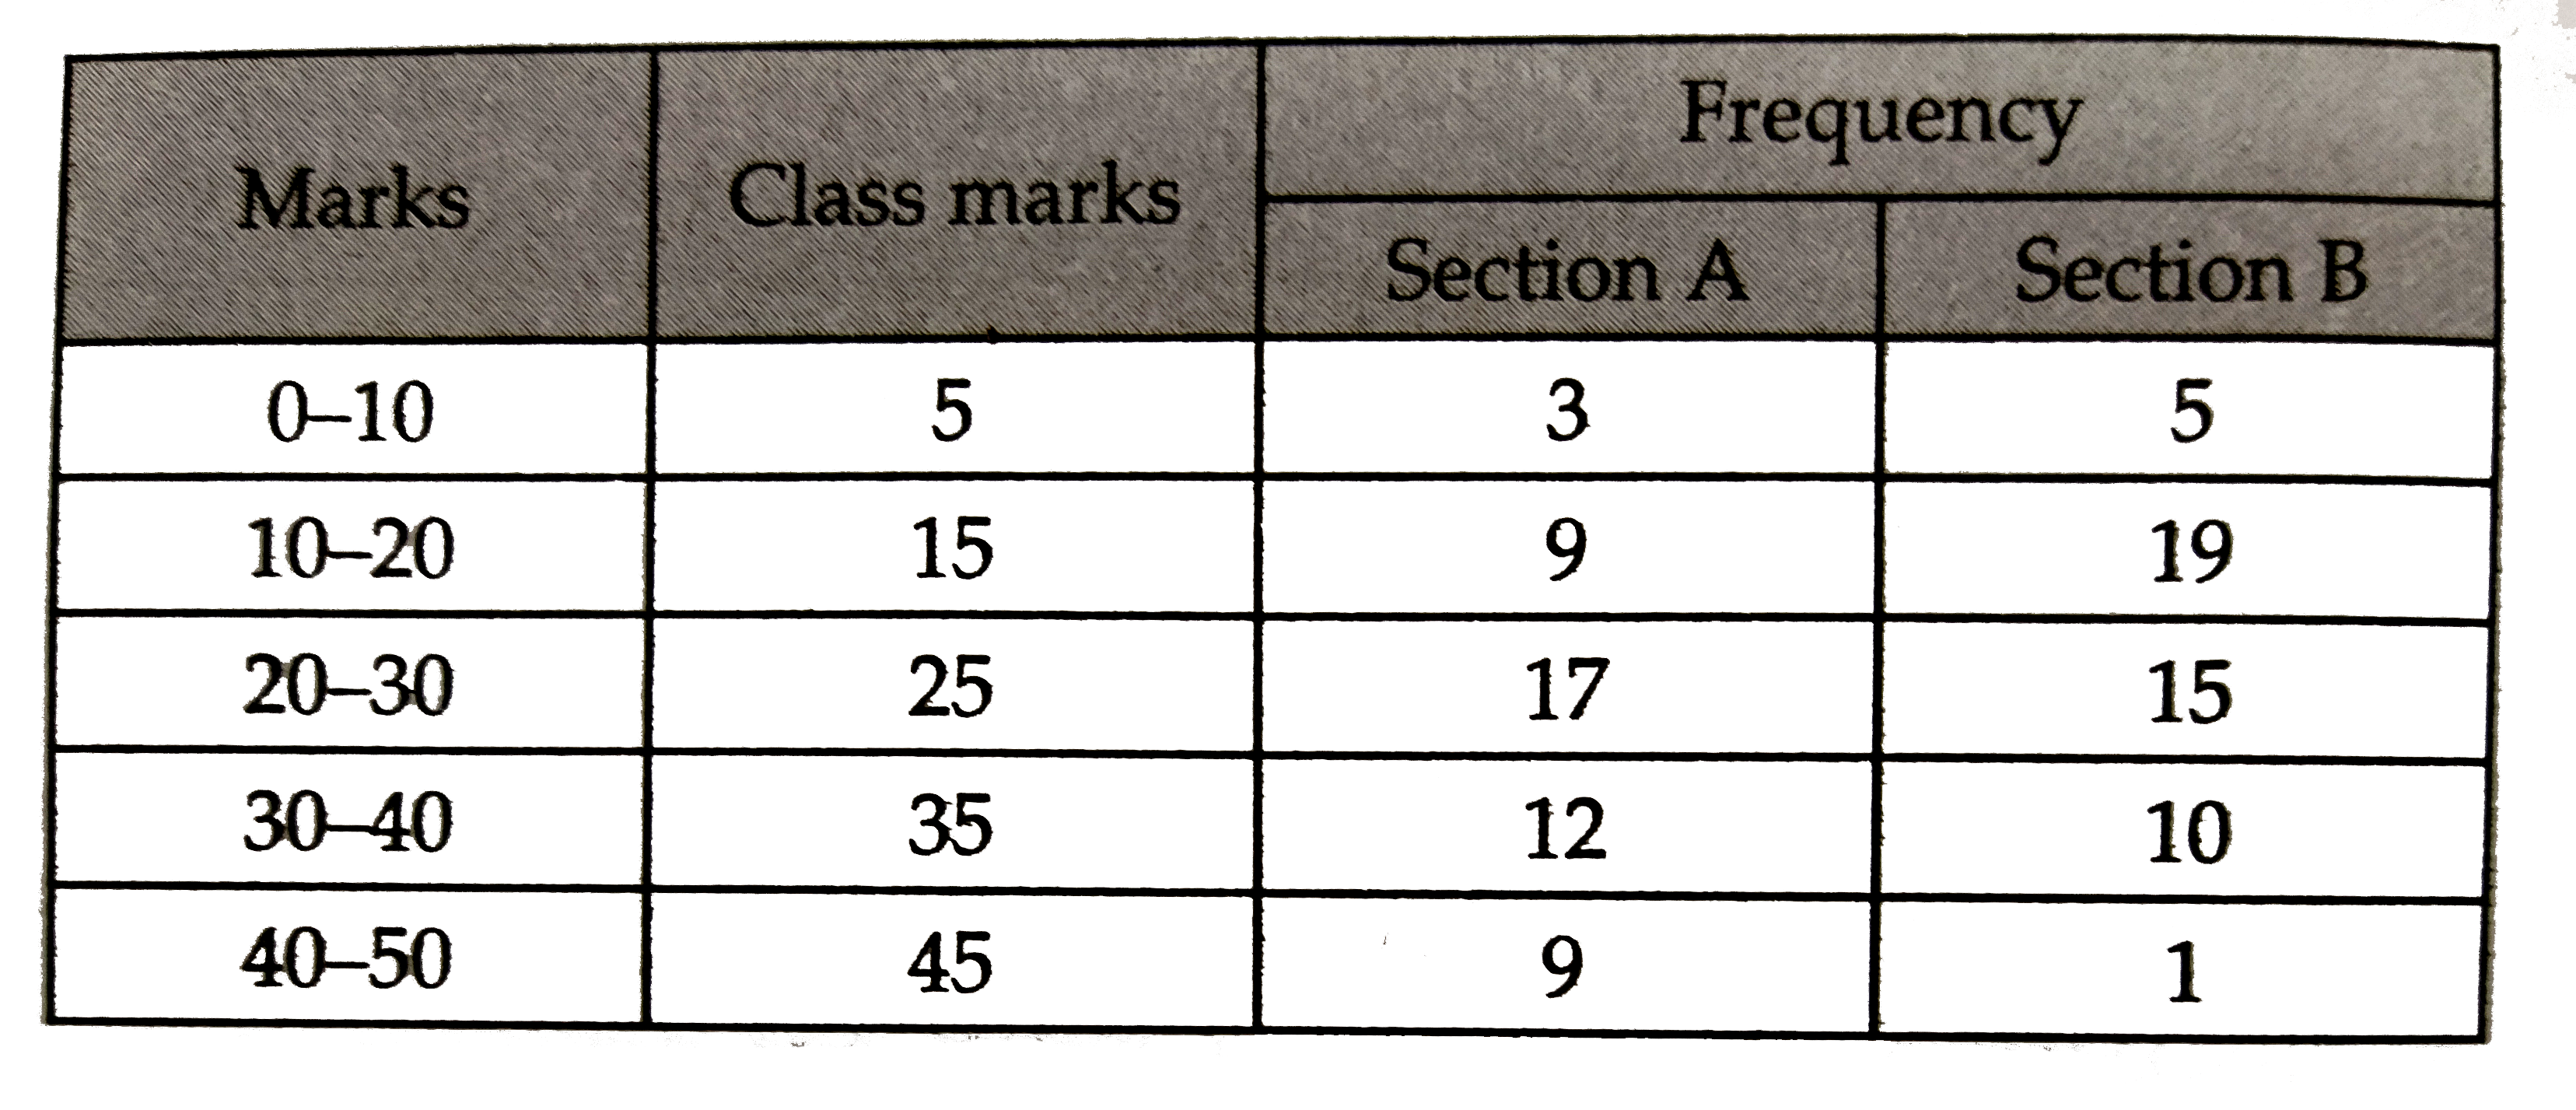
We represent the class marks along the x-axis on a suitable scale and frequencies along the y-axis on another suitable scale.
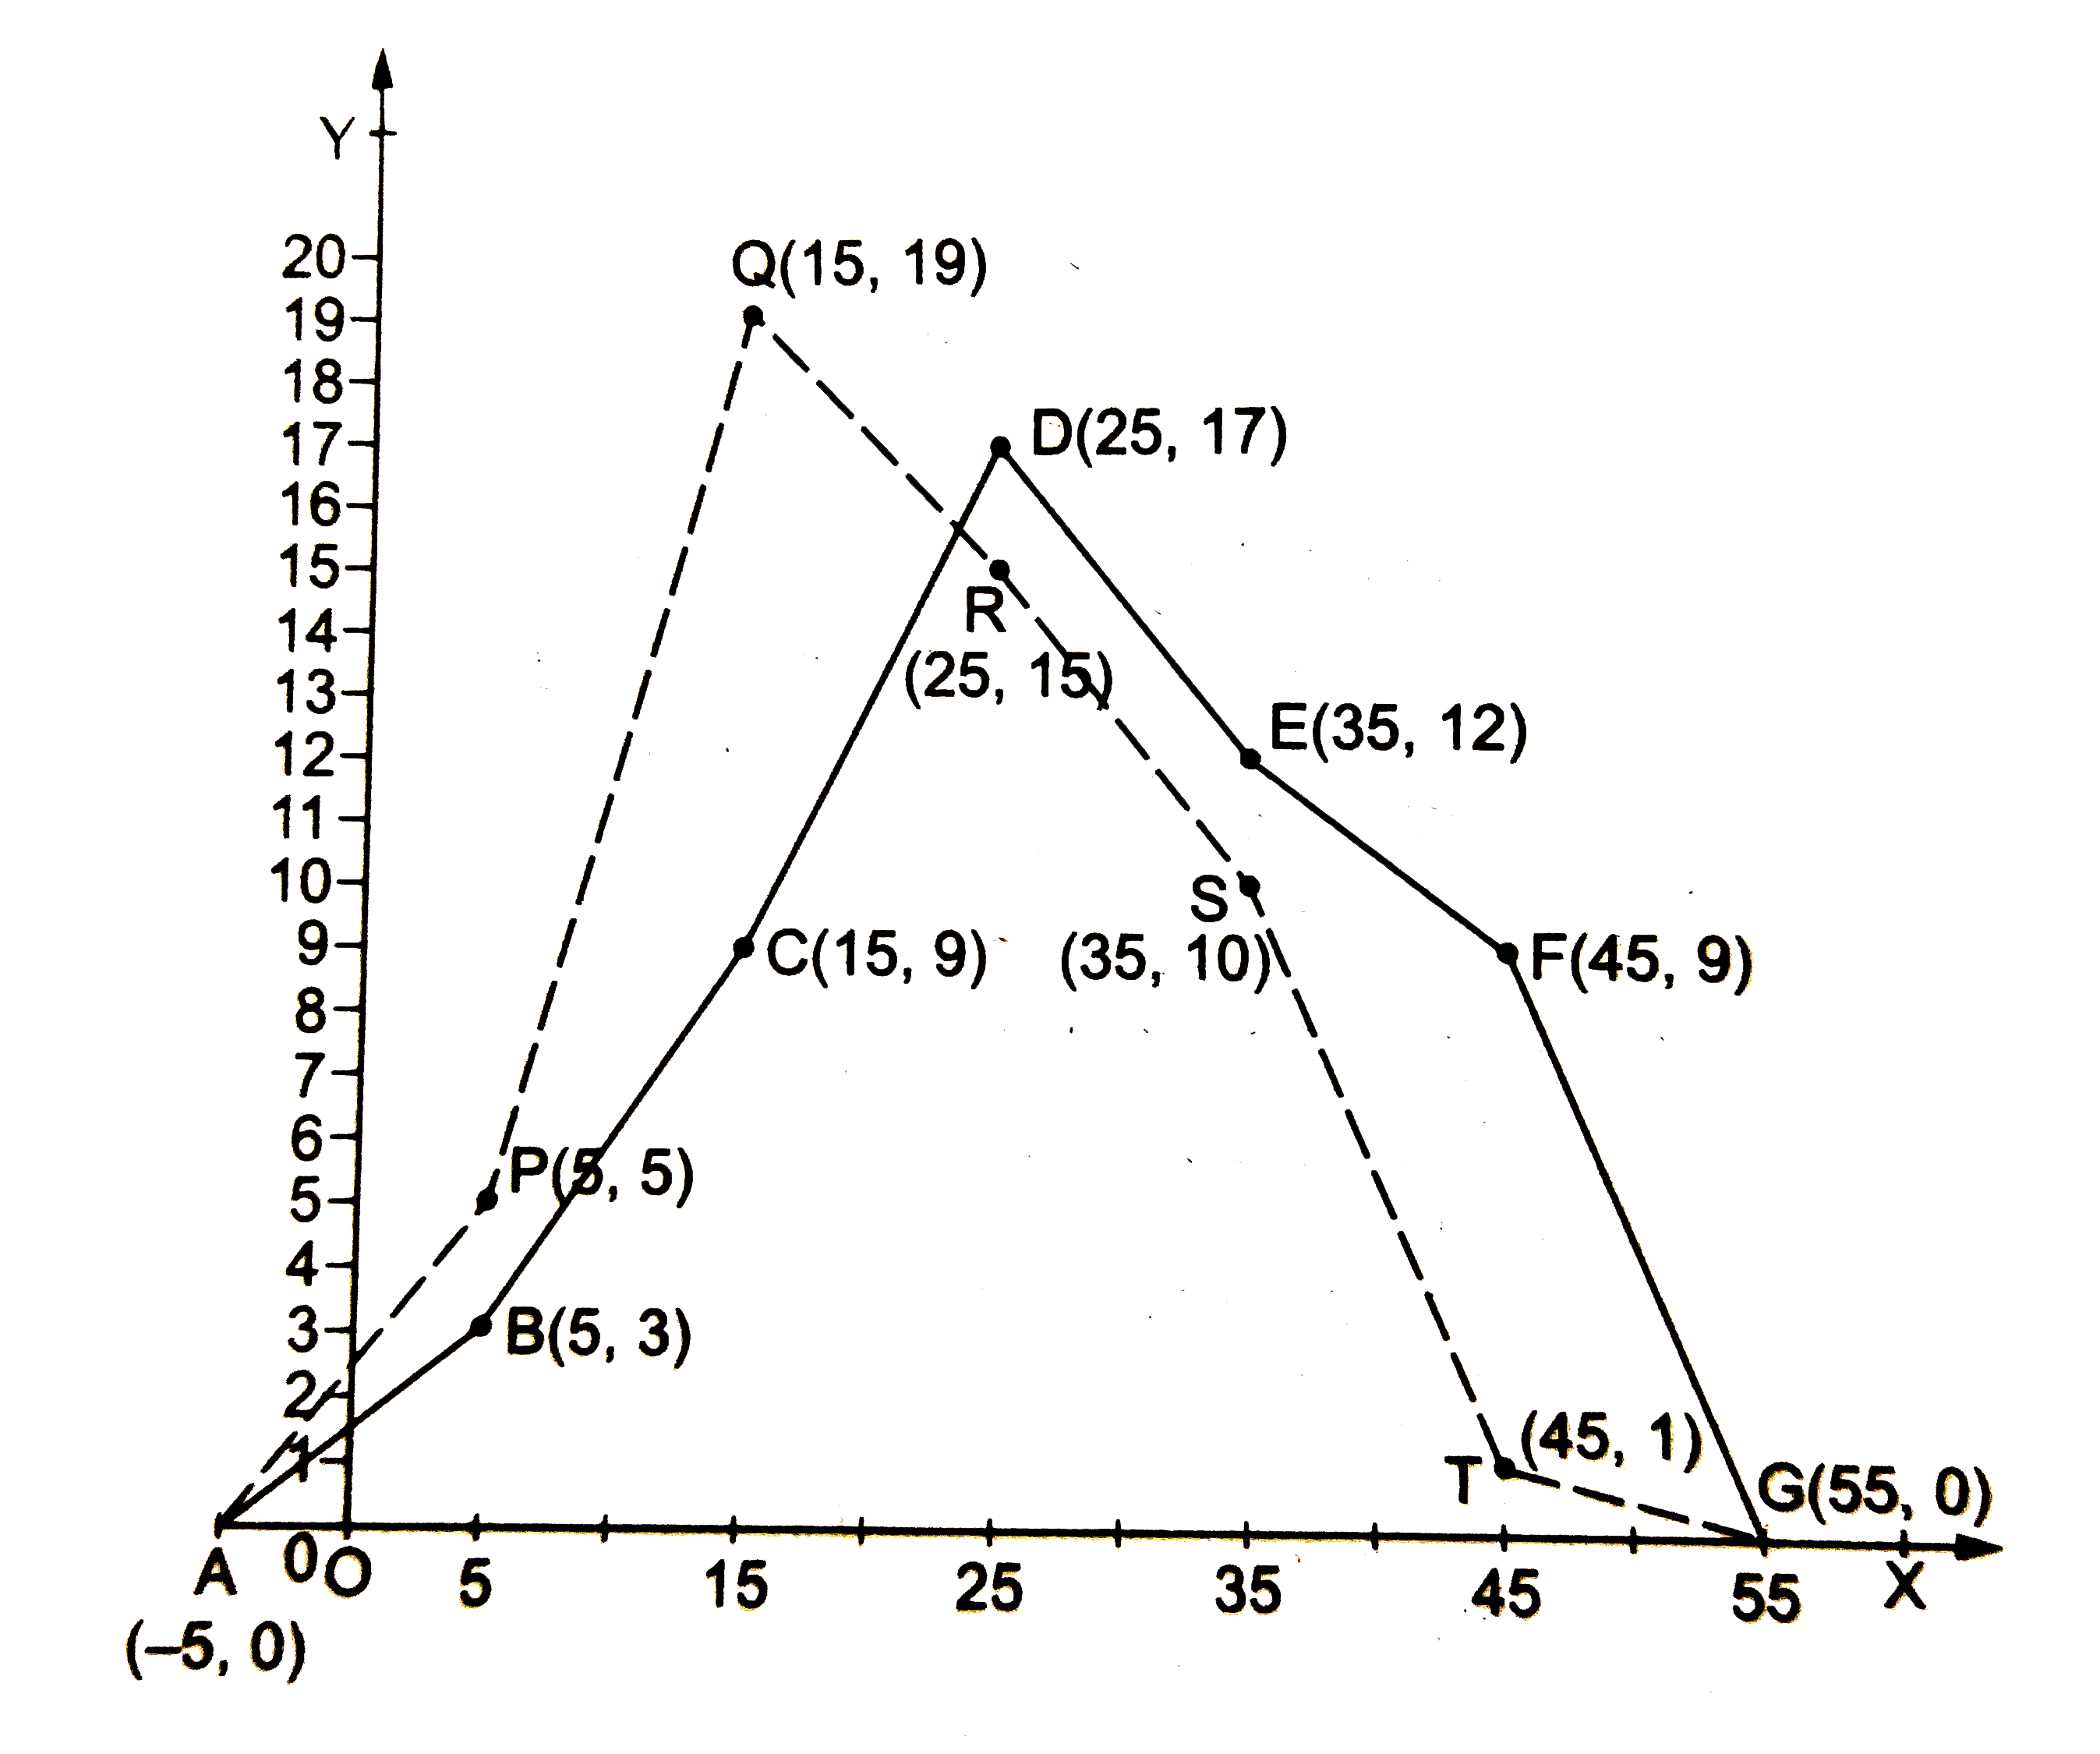
To obtain the frequency polygon of section A, we plot the points A(-5, 0), B(5, 3), C(15, 9), D(25, 17), E(35, 12), F(45, 9) and G(55, 0), Now, join these points in pairs successively to obtain the frequency polygon ABCDEFG, as shown below. To obtain the frequency polygon of section B, we plot the points A(-5, 0), P(5, 5), Q(15, 19), R(25, 15), S(35, 10), T(45, 1) and G(55, 0). Now, join these points successively to obtain the frequency polygon APQRSTG, as shown below.
Topper's Solved these Questions
- BAR GRAPH, HISTOGRAM AND FREQUENCY POLYGONBOOK - RS AGGARWALCHAPTER - BAR GRAPH, HISTOGRAM AND FREQUENCY POLYGONEXERCISE - EXERCISE 17A
12 Videos
- BAR GRAPH, HISTOGRAM AND FREQUENCY POLYGONBOOK - RS AGGARWALCHAPTER - BAR GRAPH, HISTOGRAM AND FREQUENCY POLYGONEXERCISE - EXERCISE 17B
16 Videos
- BAR GRAPH, HISTOGRAM AND FREQUENCY POLYGONBOOK - RS AGGARWALCHAPTER - BAR GRAPH, HISTOGRAM AND FREQUENCY POLYGONEXERCISE - EXERCISE 17B
16 Videos
- AREAS OF TRIANGLES AND QUADRILATERALSBOOK - RS AGGARWALCHAPTER - AREAS OF TRIANGLES AND QUADRILATERALSEXERCISE - Multiple Choice Questions (Mcq)
16 Videos
- CIRCLES BOOK - RS AGGARWALCHAPTER - CIRCLES EXERCISE - MULTIPLE CHOICE QUESTION(MCQ)
37 Videos
Similar Questions
The following table gives the distribution of students of two sections according to the marks obtained by them

Represent the marks of the students of both the sections on the same graph by two frquency polygons. From the two polygons compare the performance of the two sections.
View SolutionThe following table gives the distribution of students of two sections according to the marks obtained by them. Represent the marks of the students of botht the sections on the same graph by two frequency polygon. From the two polygons compare the performance of the two sections.
View SolutionFollowing table gives the distribution of students of sections A and B of a class according to the marks obtained by them.
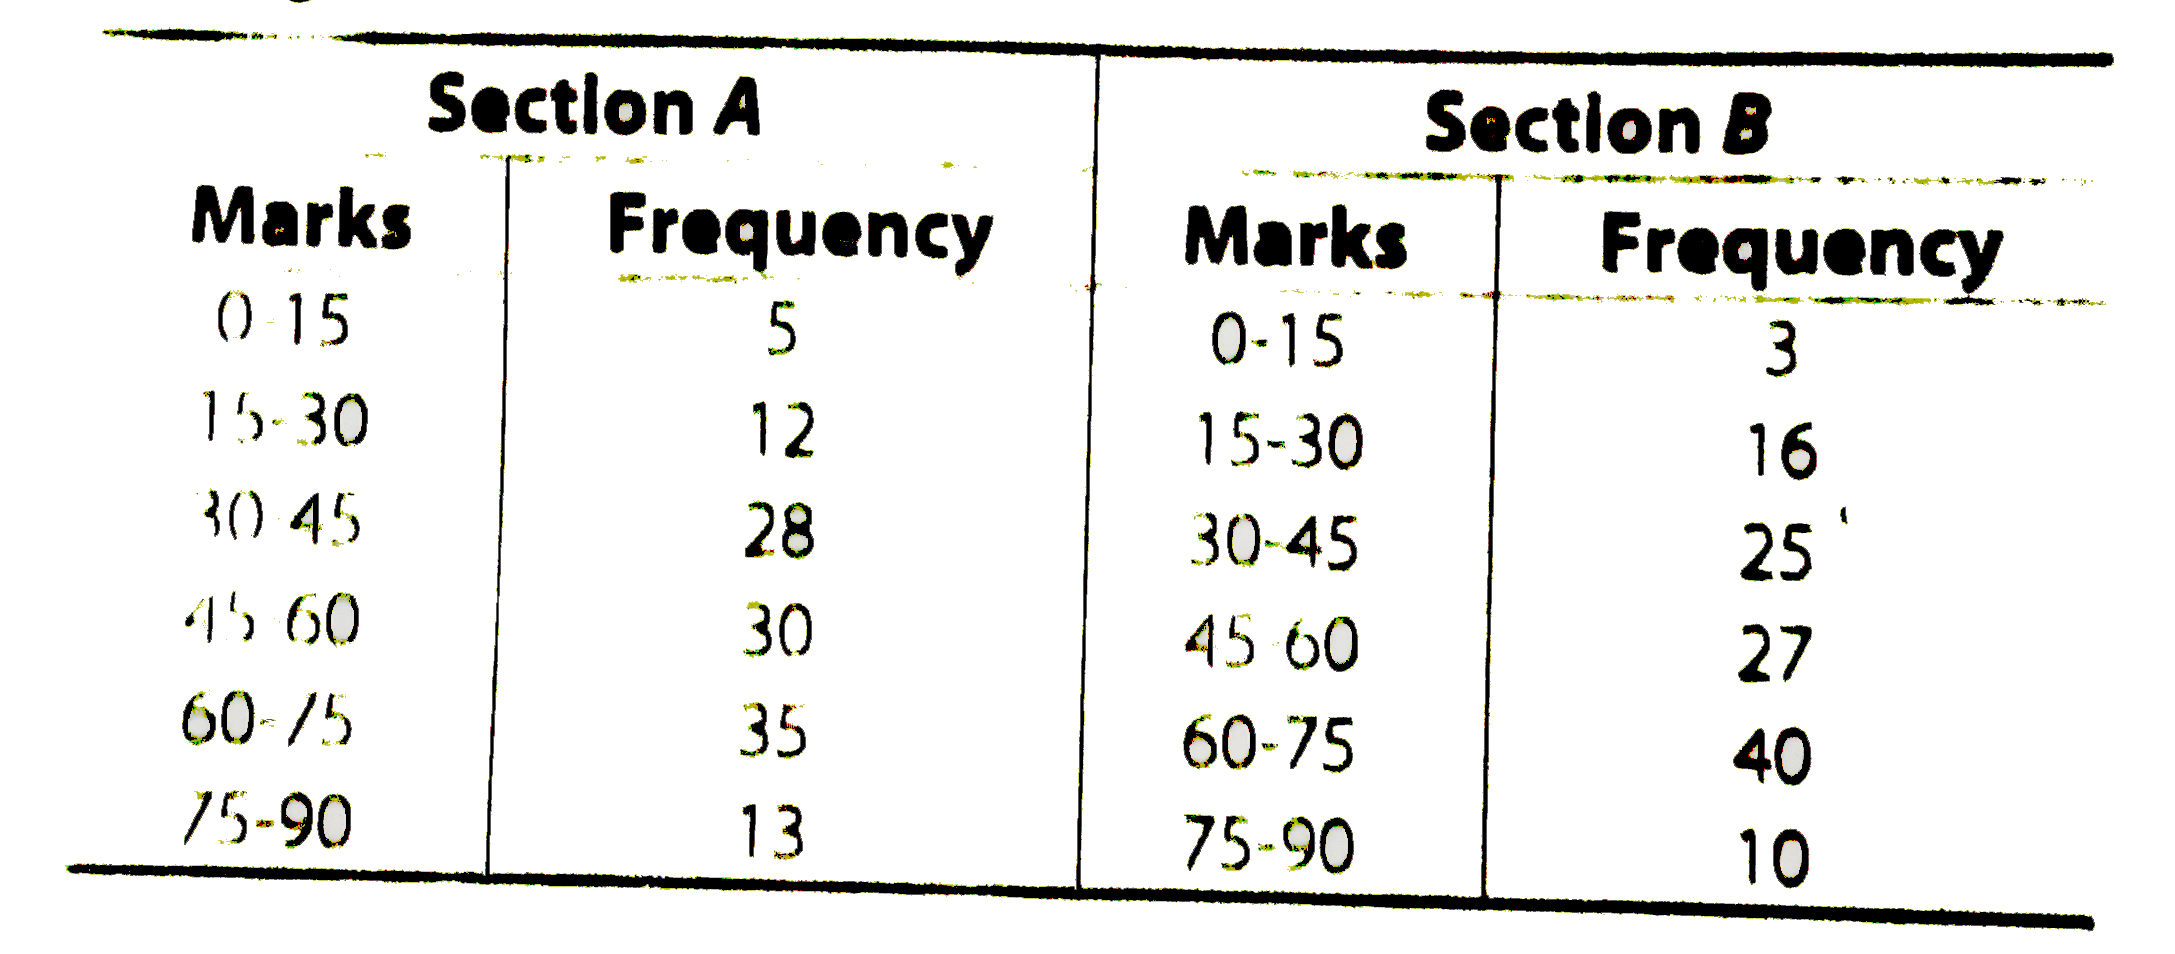
Represent the marks of the students of both the sections on the same graph by two frequency polygons. What do you observe?
View SolutionThe runs scored by two teams A and B on the first 60 balls in a cricket match are given below:
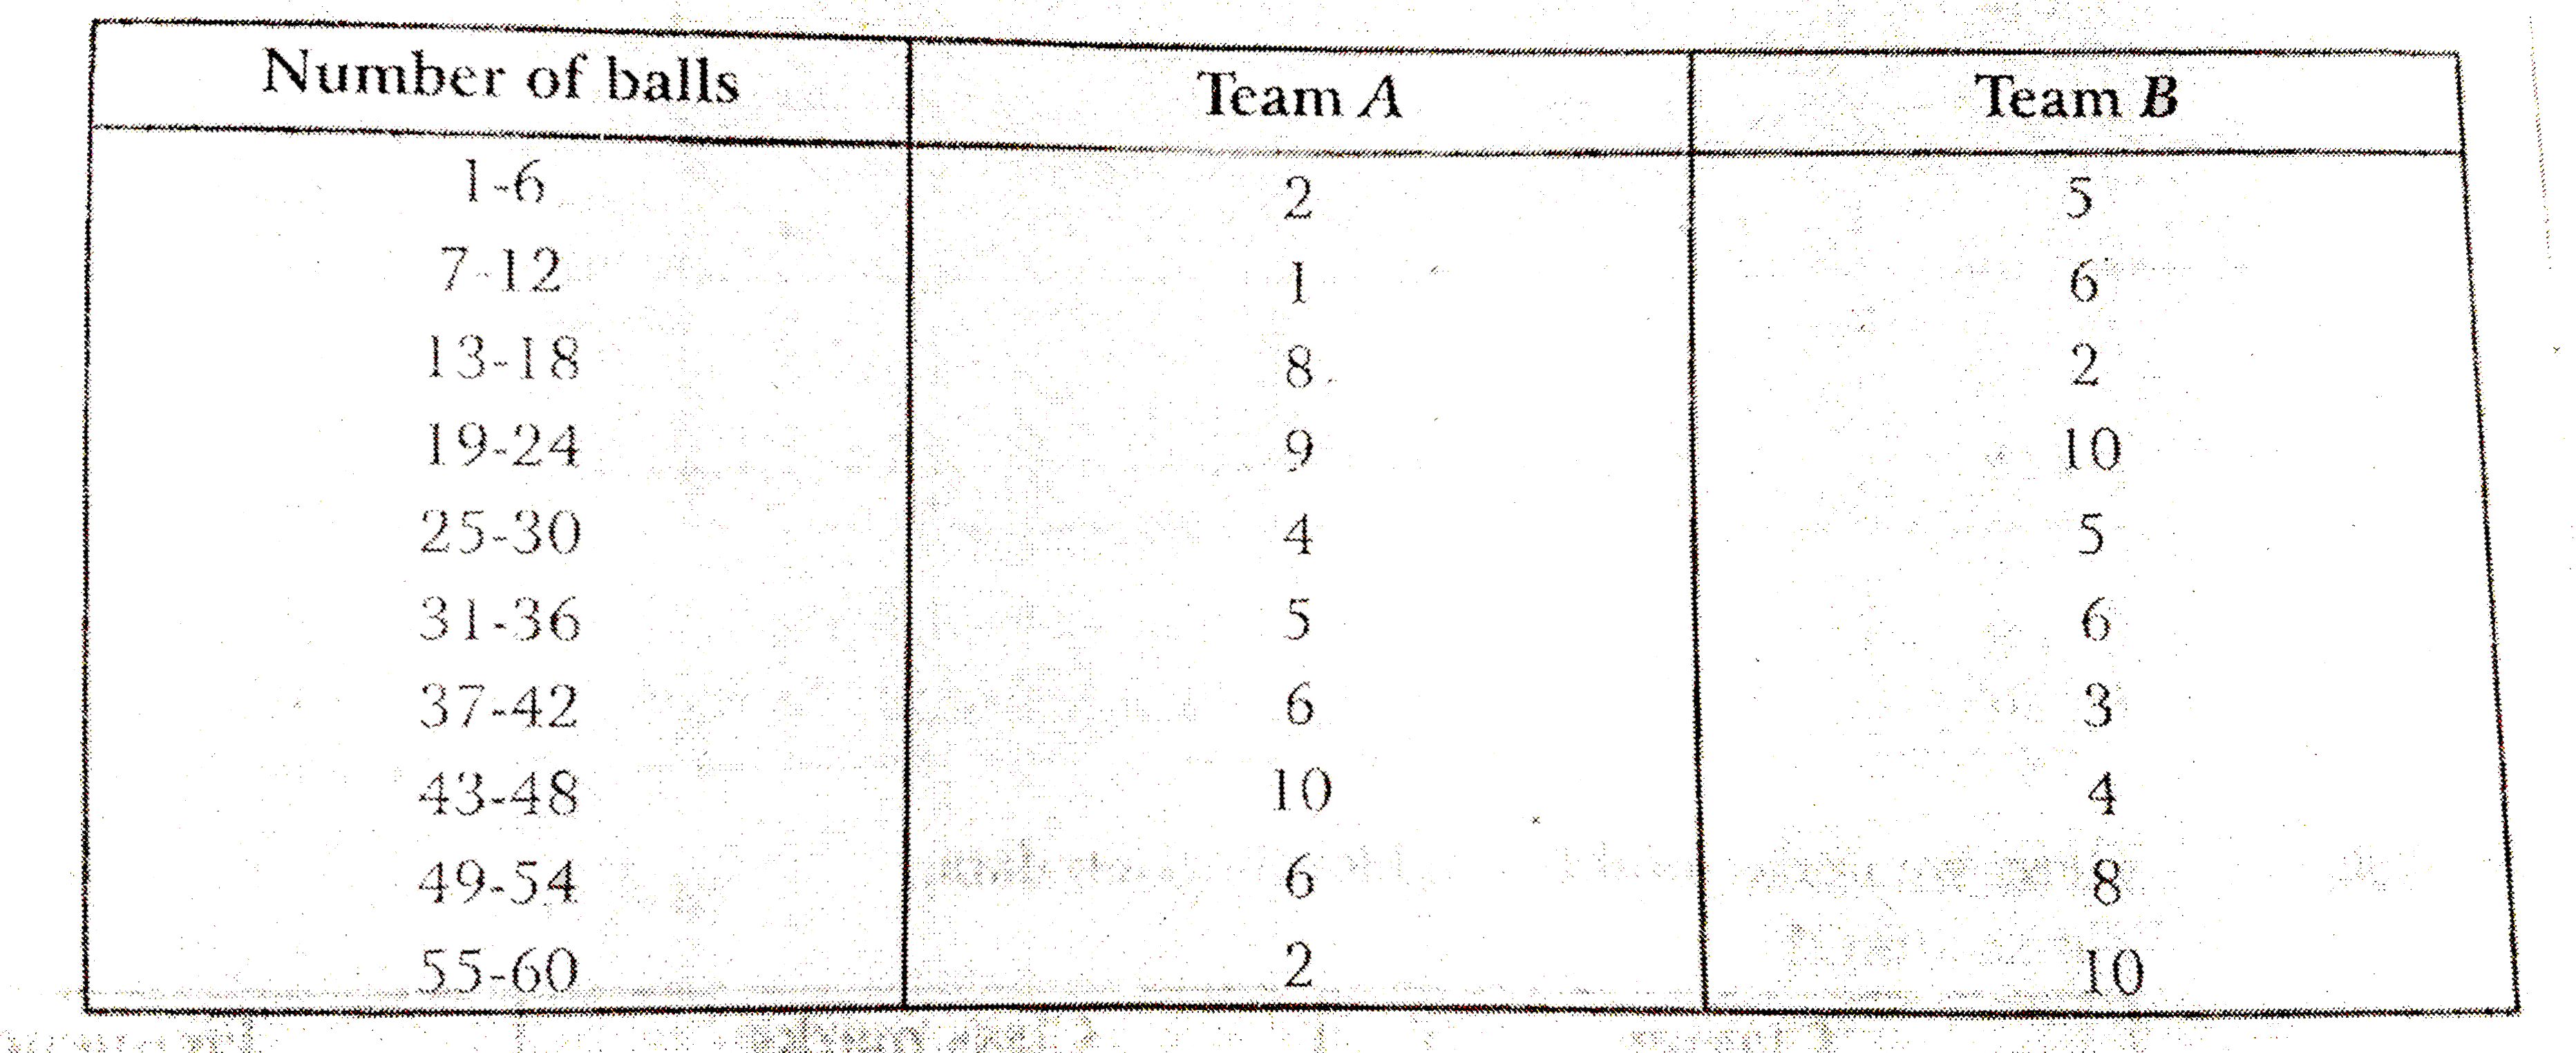
Represent the data of both the teams on the same graph by frequency polygons.
View SolutionConstruction of two frequency polygon in same axes
View SolutionThe following table shows frequency distribution of marks secured by 100 students in a particular examination. Find the mean of the marks.

View SolutionThe following table shows frequency distribution of marks of 100 students of 10th class which they obtianed in a practice examination. Find the median of the marks.

View SolutionThe runs scored by two teams A and B on the first 60 balls in a cricket match are given below:
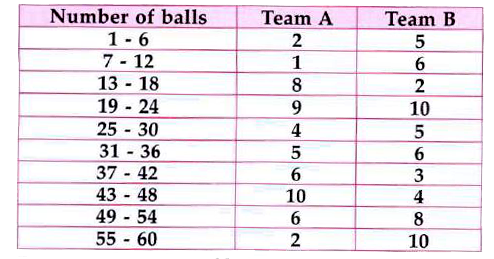
Represent the data of both the teams on the same graph by frequency polygons. [Hint: First make the class intervals continuous]
View SolutionThe following table represent marks obtained by 100 students in a test.

Find mean marks of the students.
View SolutionFollowing data gives the marks obtained by 100 students in a test. Find the median

View Solution
