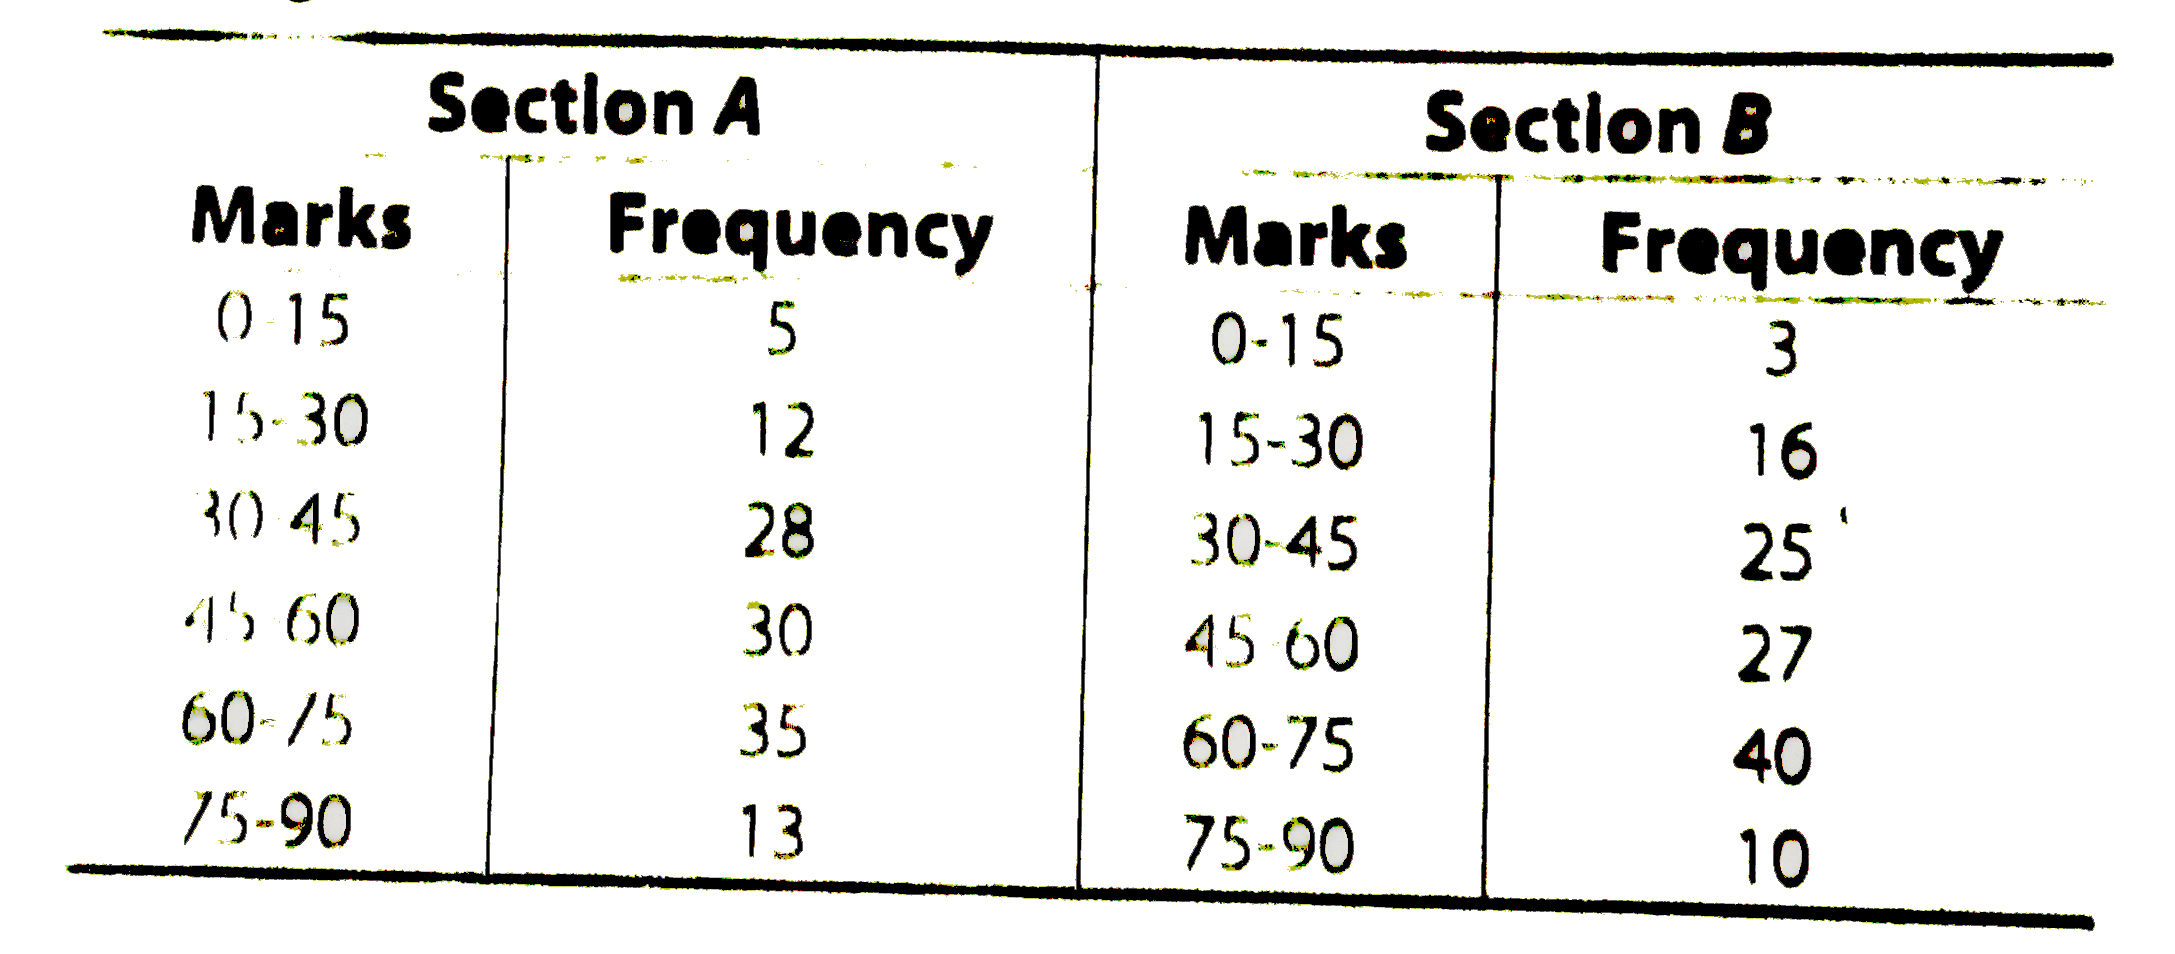
The following table gives the distribution of students of two sections according to the marks obtained by them. Represent the marks of the students of botht the sections on the same graph by two frequency polygon. From the two polygons compare the performance of the two sections.
Please refer to video for frequency polygons of the marks obtained in the given two sections.
From these two polygons, we can say that average marks of section B are less than average marks of section A.
Similar Questions
The following table gives the distribution of students of two sections according to the marks obtained by them

Represent the marks of the students of both the sections on the same graph by two frquency polygons. From the two polygons compare the performance of the two sections.
View SolutionFollowing table gives the distribution of students of sections A and B of a class according to the marks obtained by them.

Represent the marks of the students of both the sections on the same graph by two frequency polygons. What do you observe?
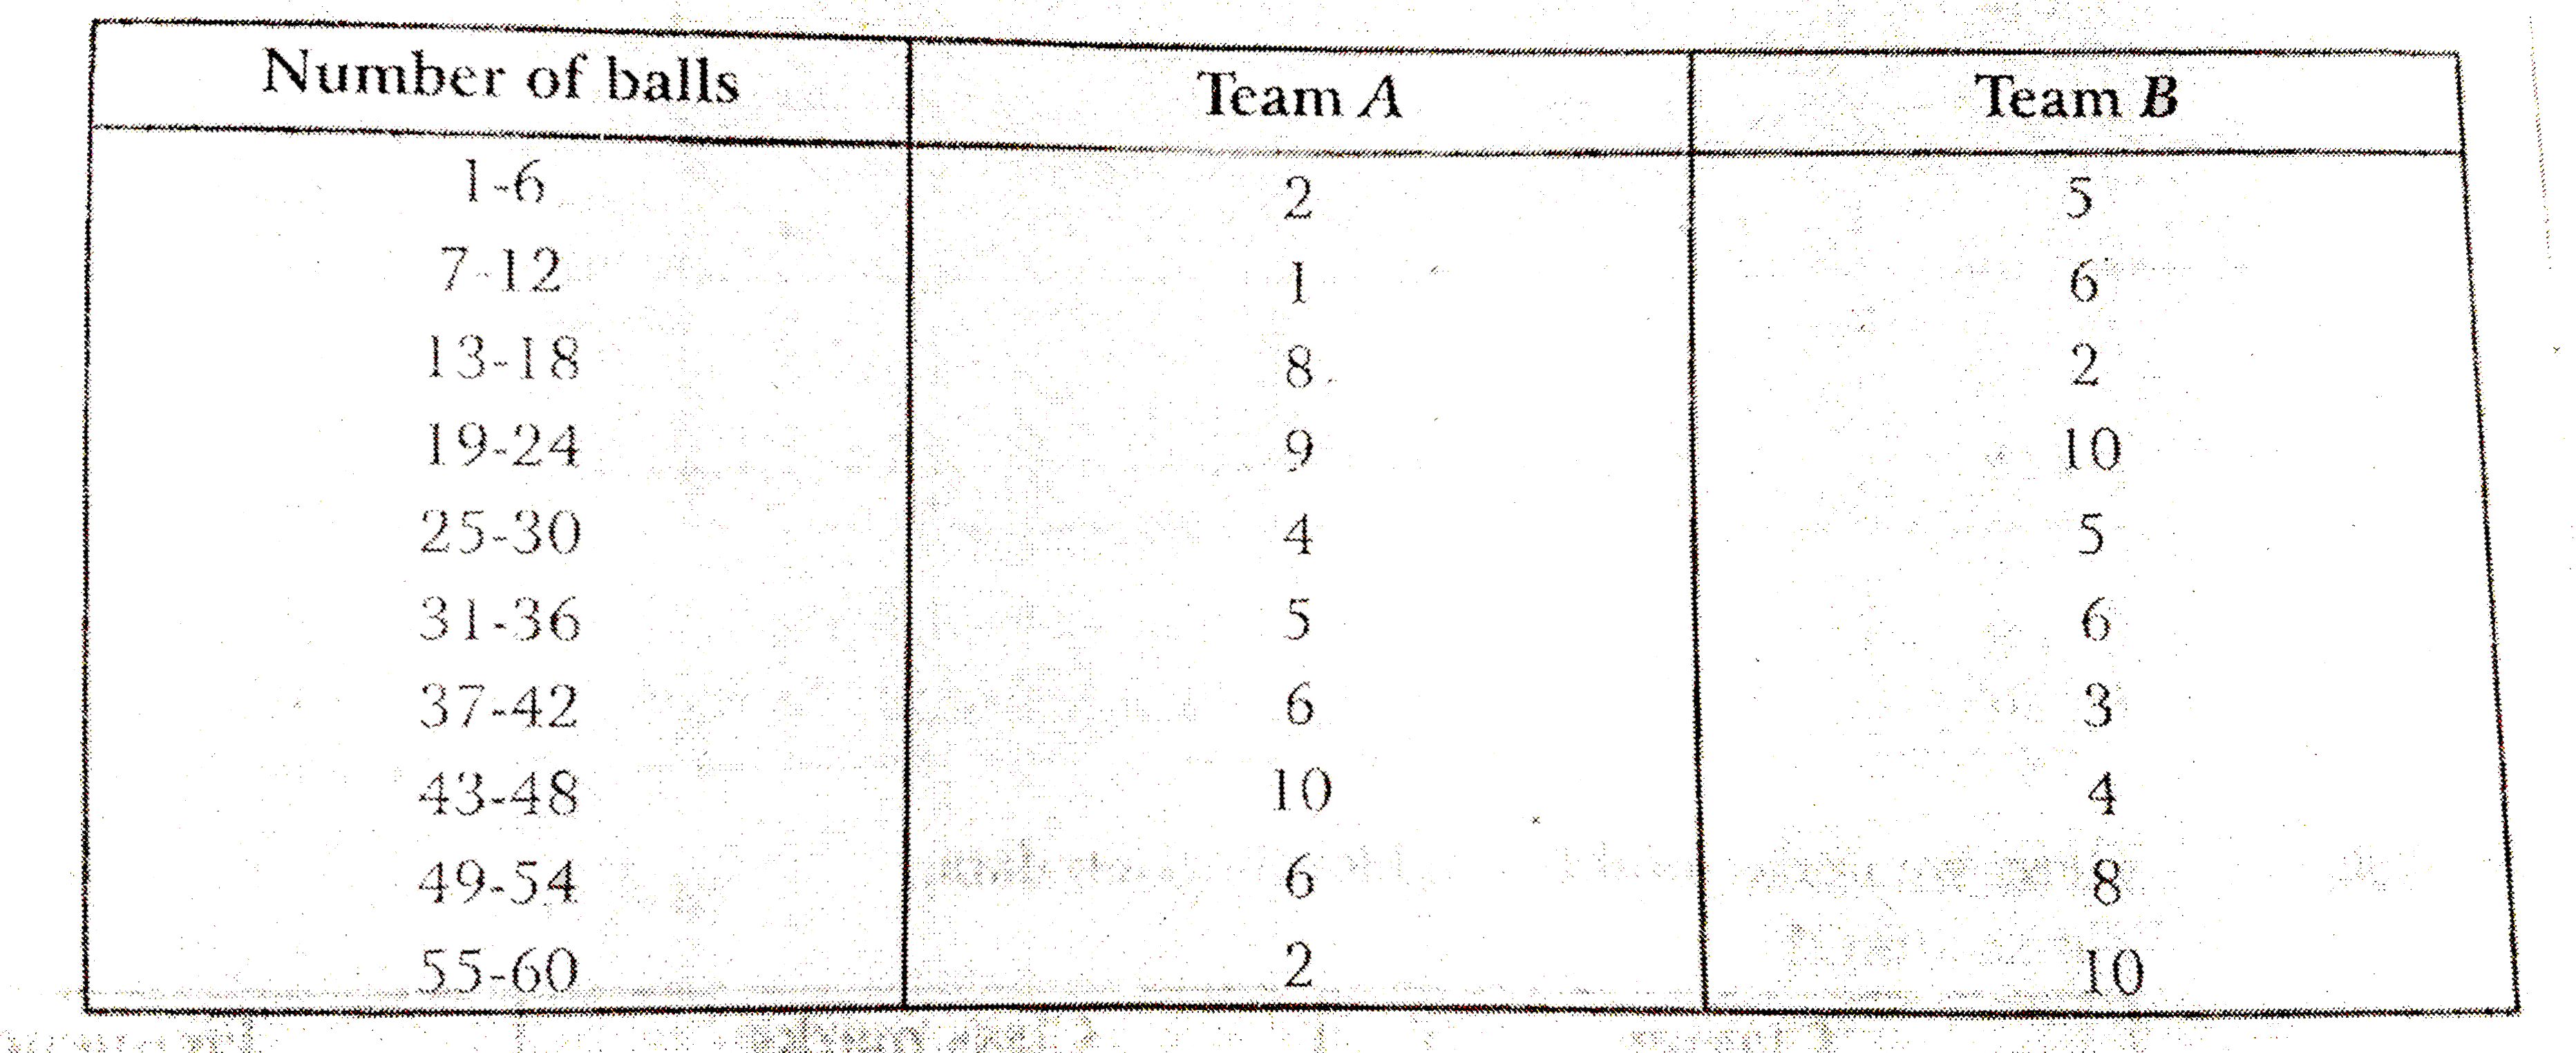
View SolutionThe runs scored by two teams A and B on the first 60 balls in a cricket match are given below:

Represent the data of both the teams on the same graph by frequency polygons.
View SolutionThe following table gives distribution of marks for 50 students of a clas. Calculate mean deviation from the mean and median respectively from the data:

View SolutionThe following table shows the classification of percentages of marks of students and the number of students. Draw a frequency polygon from the table.

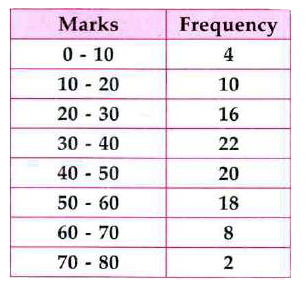
View SolutionThe following table represent marks obtained by 100 students in a test.

Find mean marks of the students.
View SolutionConstruction of two frequency polygon in same axes
View SolutionThe following table shows frequency distribution of marks secured by 100 students in a particular examination. Find the mean of the marks.

View SolutionThe following table shows frequency distribution of marks of 100 students of 10th class which they obtianed in a practice examination. Find the median of the marks.

View SolutionThe following table gives the marks scored by 100 students in an entrance examination

Represent this data in the form of a histogram.
View Solution
