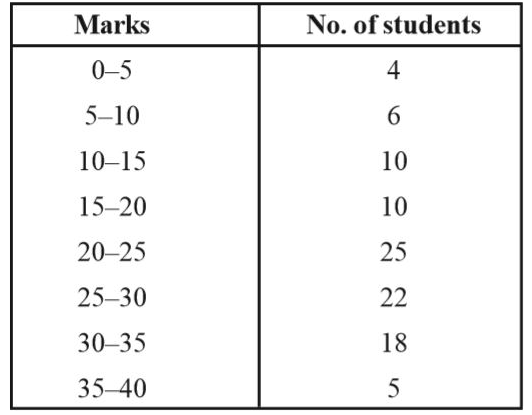
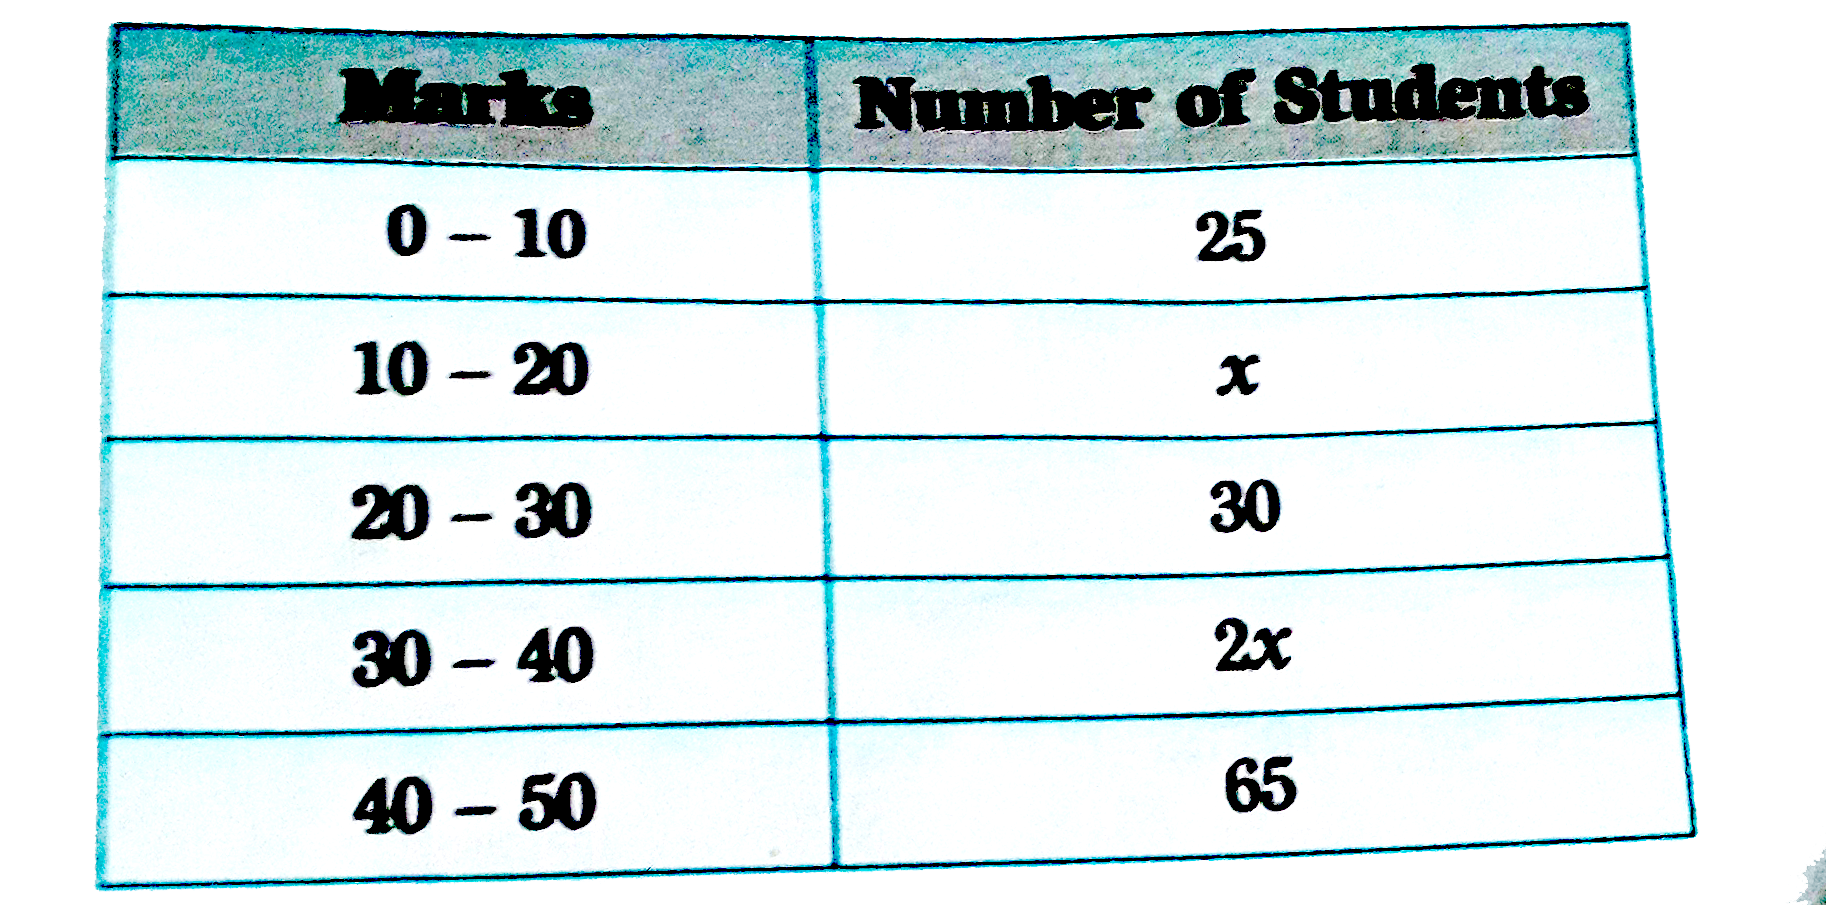
The following table shows frequency distribution of marks of 100 students of 10th class which they obtianed in a practice examination. Find the median of the marks.

The correct Answer is:57.33
Step by step video & image solution for The following table shows frequency distribution of marks of 100 students of 10^(th) class which they obtianed in a practice examination. Find the median of the marks. by Maths experts to help you in doubts & scoring excellent marks in Class 10 exams.
Updated on:21/07/2023Topper's Solved these Questions
- STATISTICSBook:TARGET PUBLICATIONChapter:STATISTICSExercise:Apply your knowledge
Explore 5 Videos
- STATISTICSBook:TARGET PUBLICATIONChapter:STATISTICSExercise:Chapter Assessment
Explore 15 Videos
- STATISTICSBook:TARGET PUBLICATIONChapter:STATISTICSExercise:Multiple Choice Questions
Explore 14 Videos
- SIMILARITY Book:TARGET PUBLICATIONChapter:SIMILARITY Exercise:Chapter Assessment
Explore 19 Videos
- TRIGONOMETRY Book:TARGET PUBLICATIONChapter:TRIGONOMETRY Exercise:Chapter Assessment
Explore 18 Videos
Similar Questions
Knowledge Check
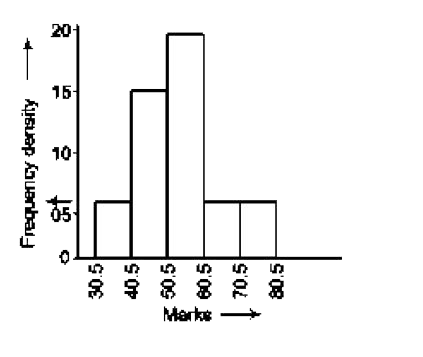
The following histogram shows the distribution of marks of 50 students in a collegeThe average marks of the students, number is
 A43.5B44.5C45.5D74.7
The following table show tha cumulative frequency distribution of marks of 800 students in an examination.
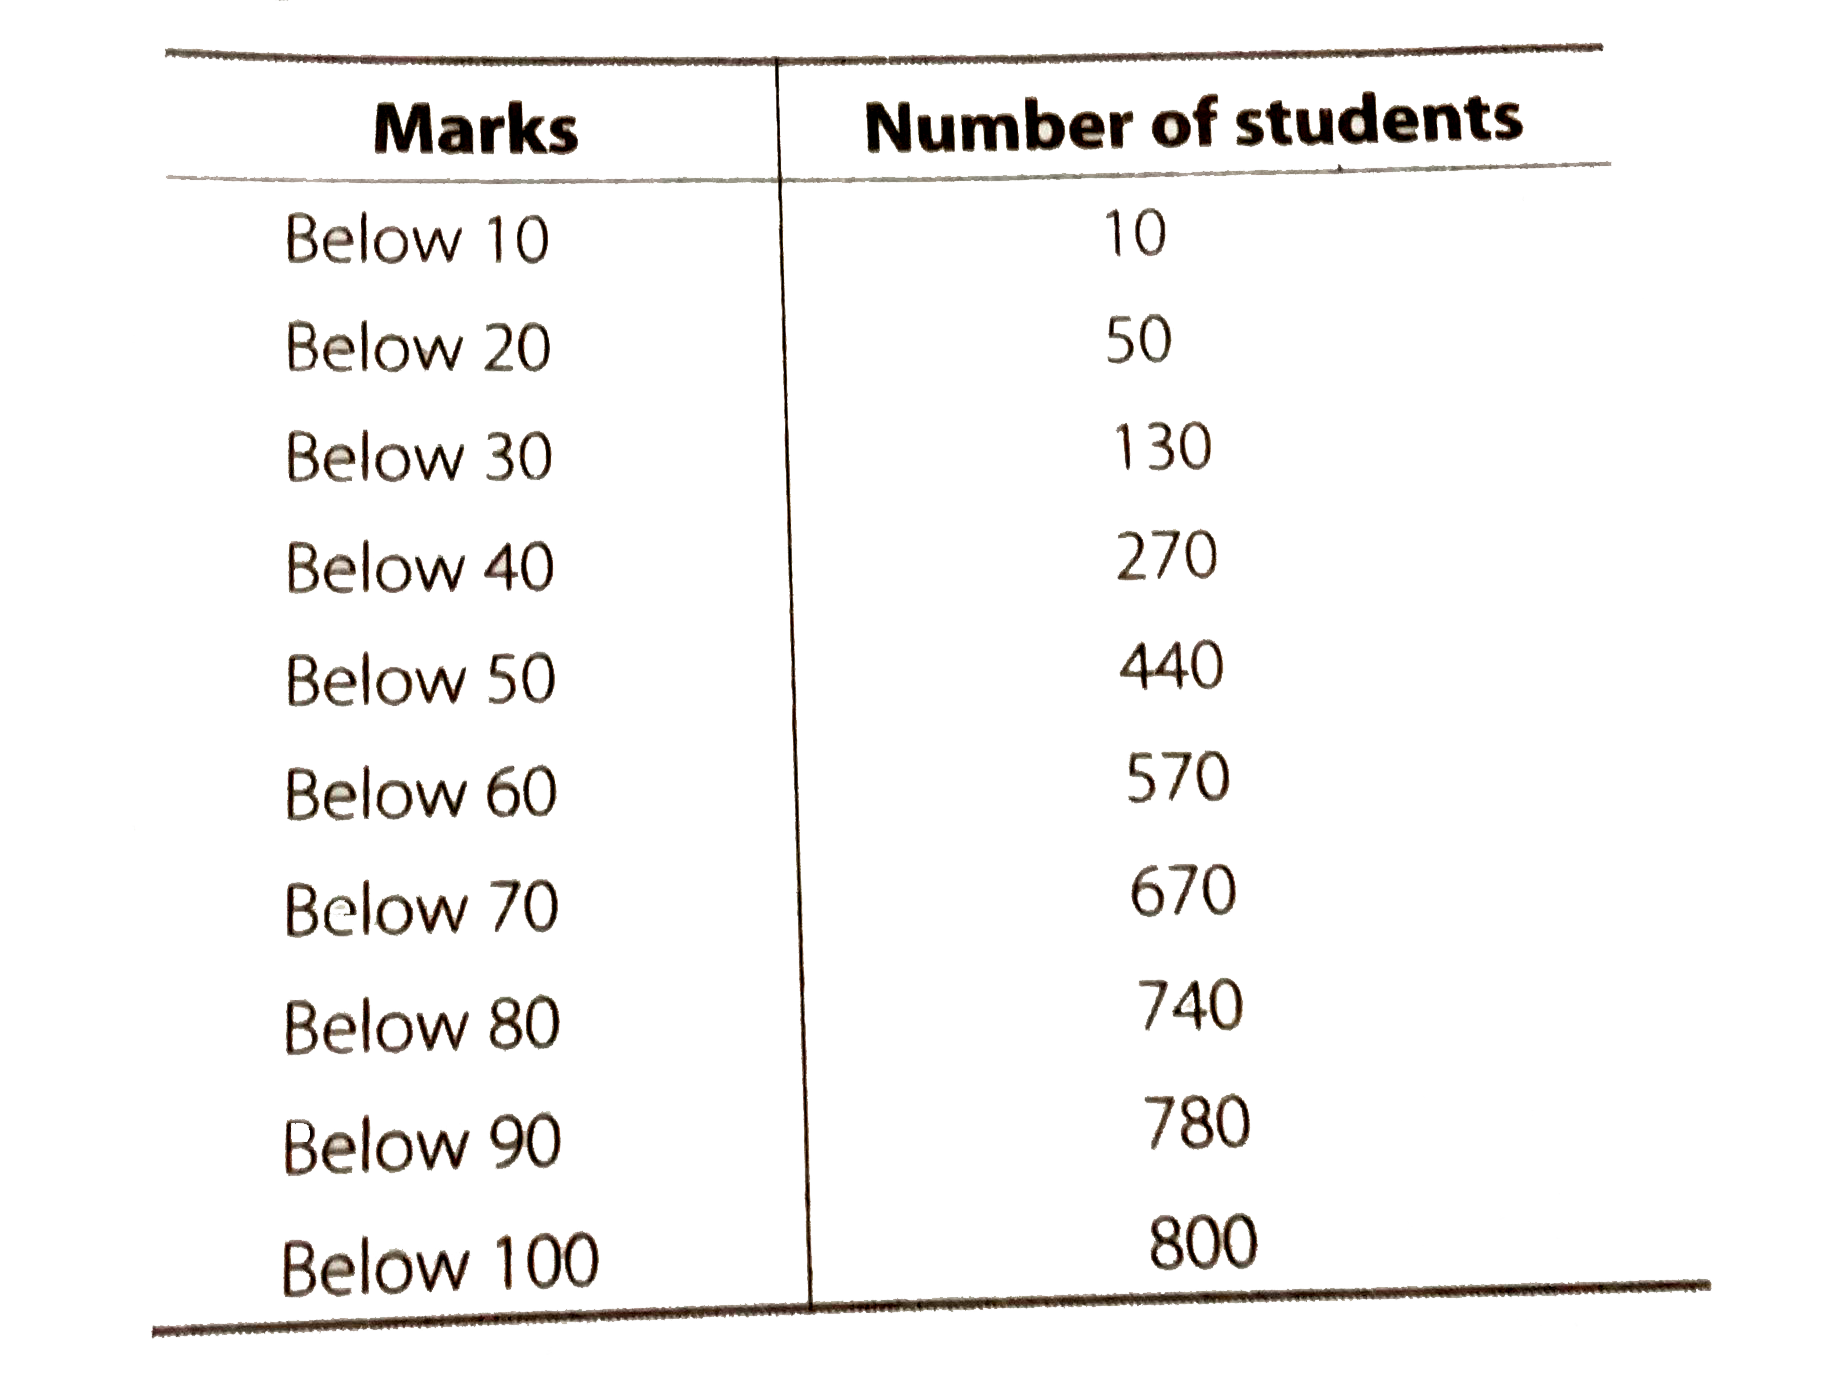
Construct a frequency distribution table for the data above.
View SolutionThere are 60 students in a class. The following is the frequency distribution of the marks obtained by the students in a test:

Where "p" is positive integer. Determine the mean and standard deviation of the marks.
View SolutionThe following table shows the marks obtained by 100 students of Class X in a school during a particular academic session. Find the mode of this distribution.
View SolutionThe following table shows the marks obtained by 100 students of a class in a school during a particular academic session. Find the modal marks.

View SolutionThe following frequency distbution table shows marks obtained by 180 students in Mathematics examination
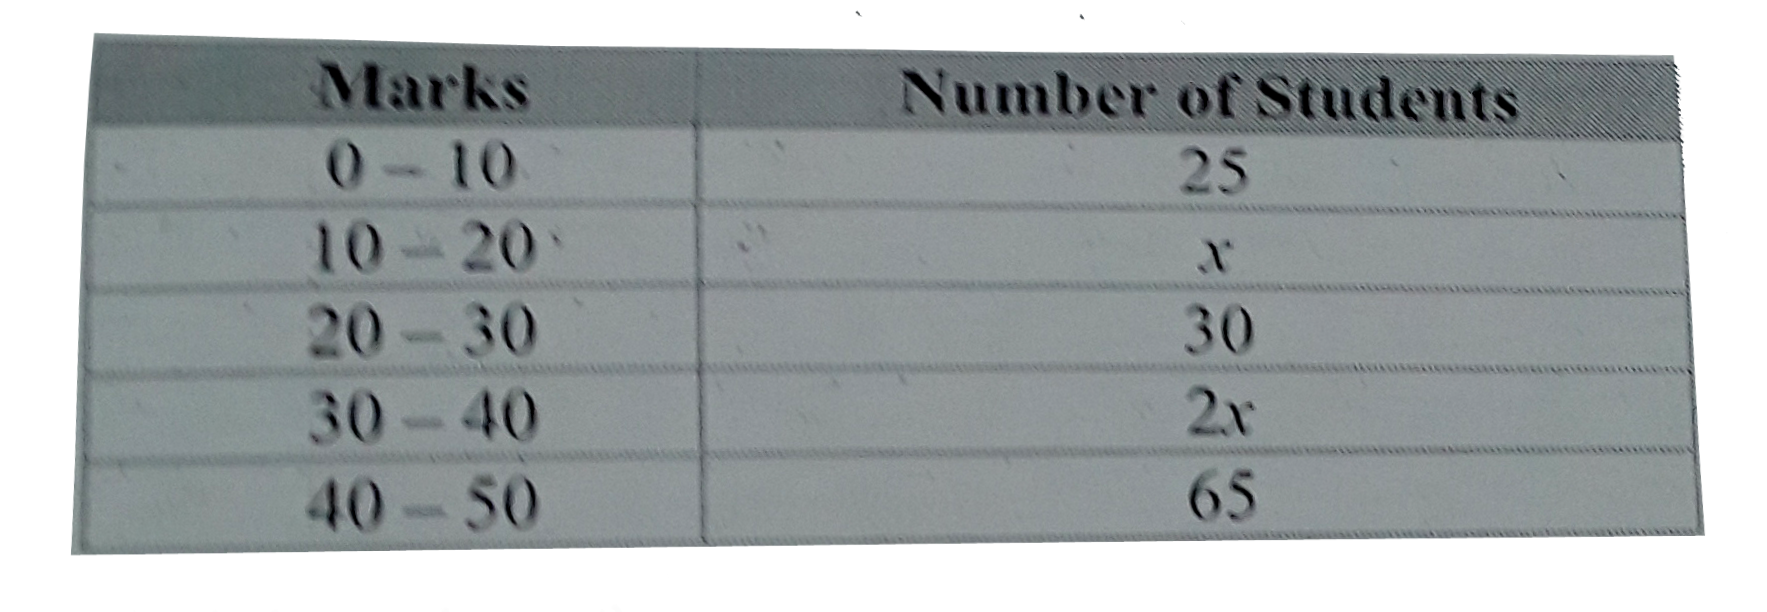
Find the value of x .
View SolutionThe frequency distribution of marks obtained by students in a class test is given below .
Draw frequency polygon and ogive.

View SolutionThe following frequency distribution table shows marks obtained by 180 students in Mathematics examination :
Find the value of x.
Also draw a histogram representing the above informations.
View Solution


