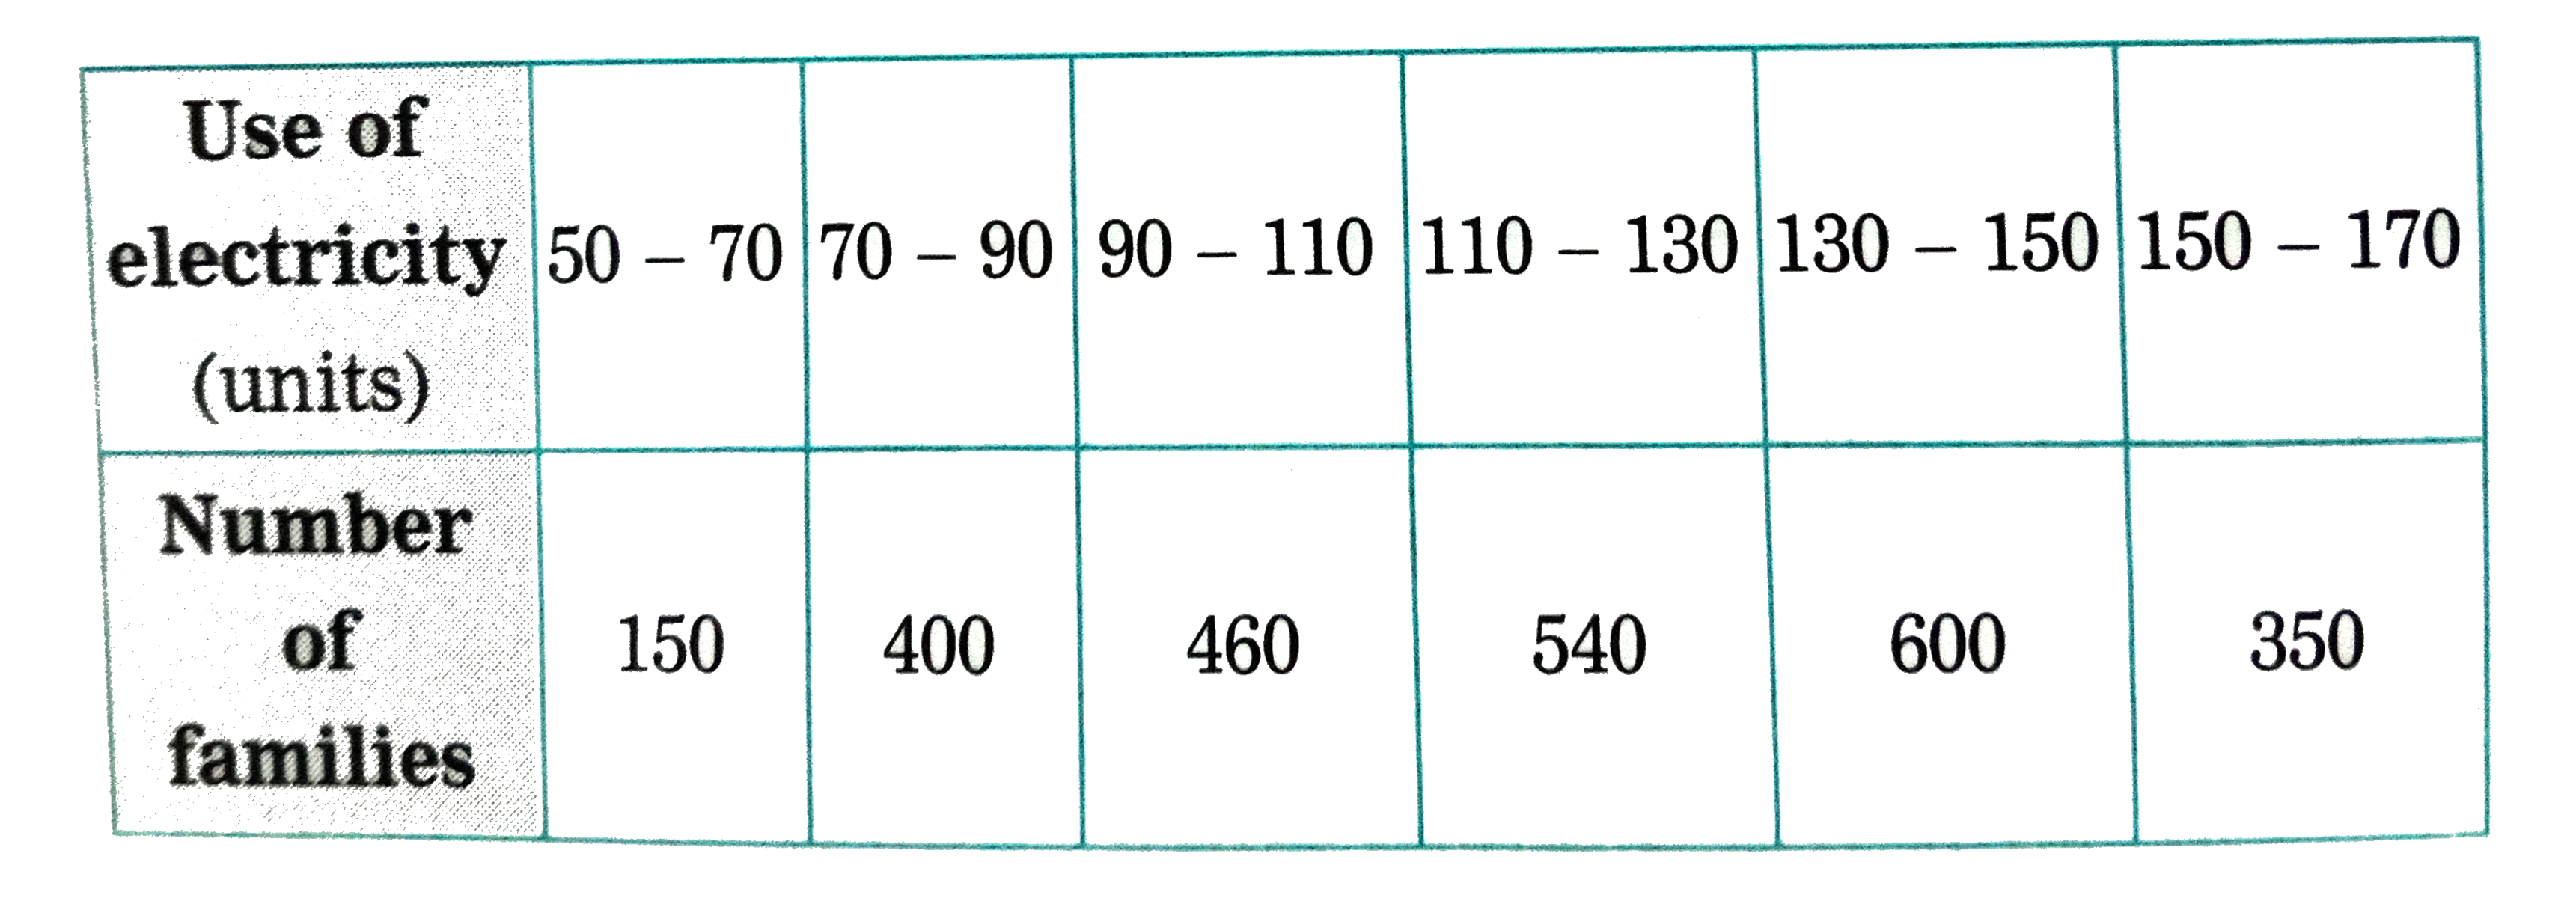
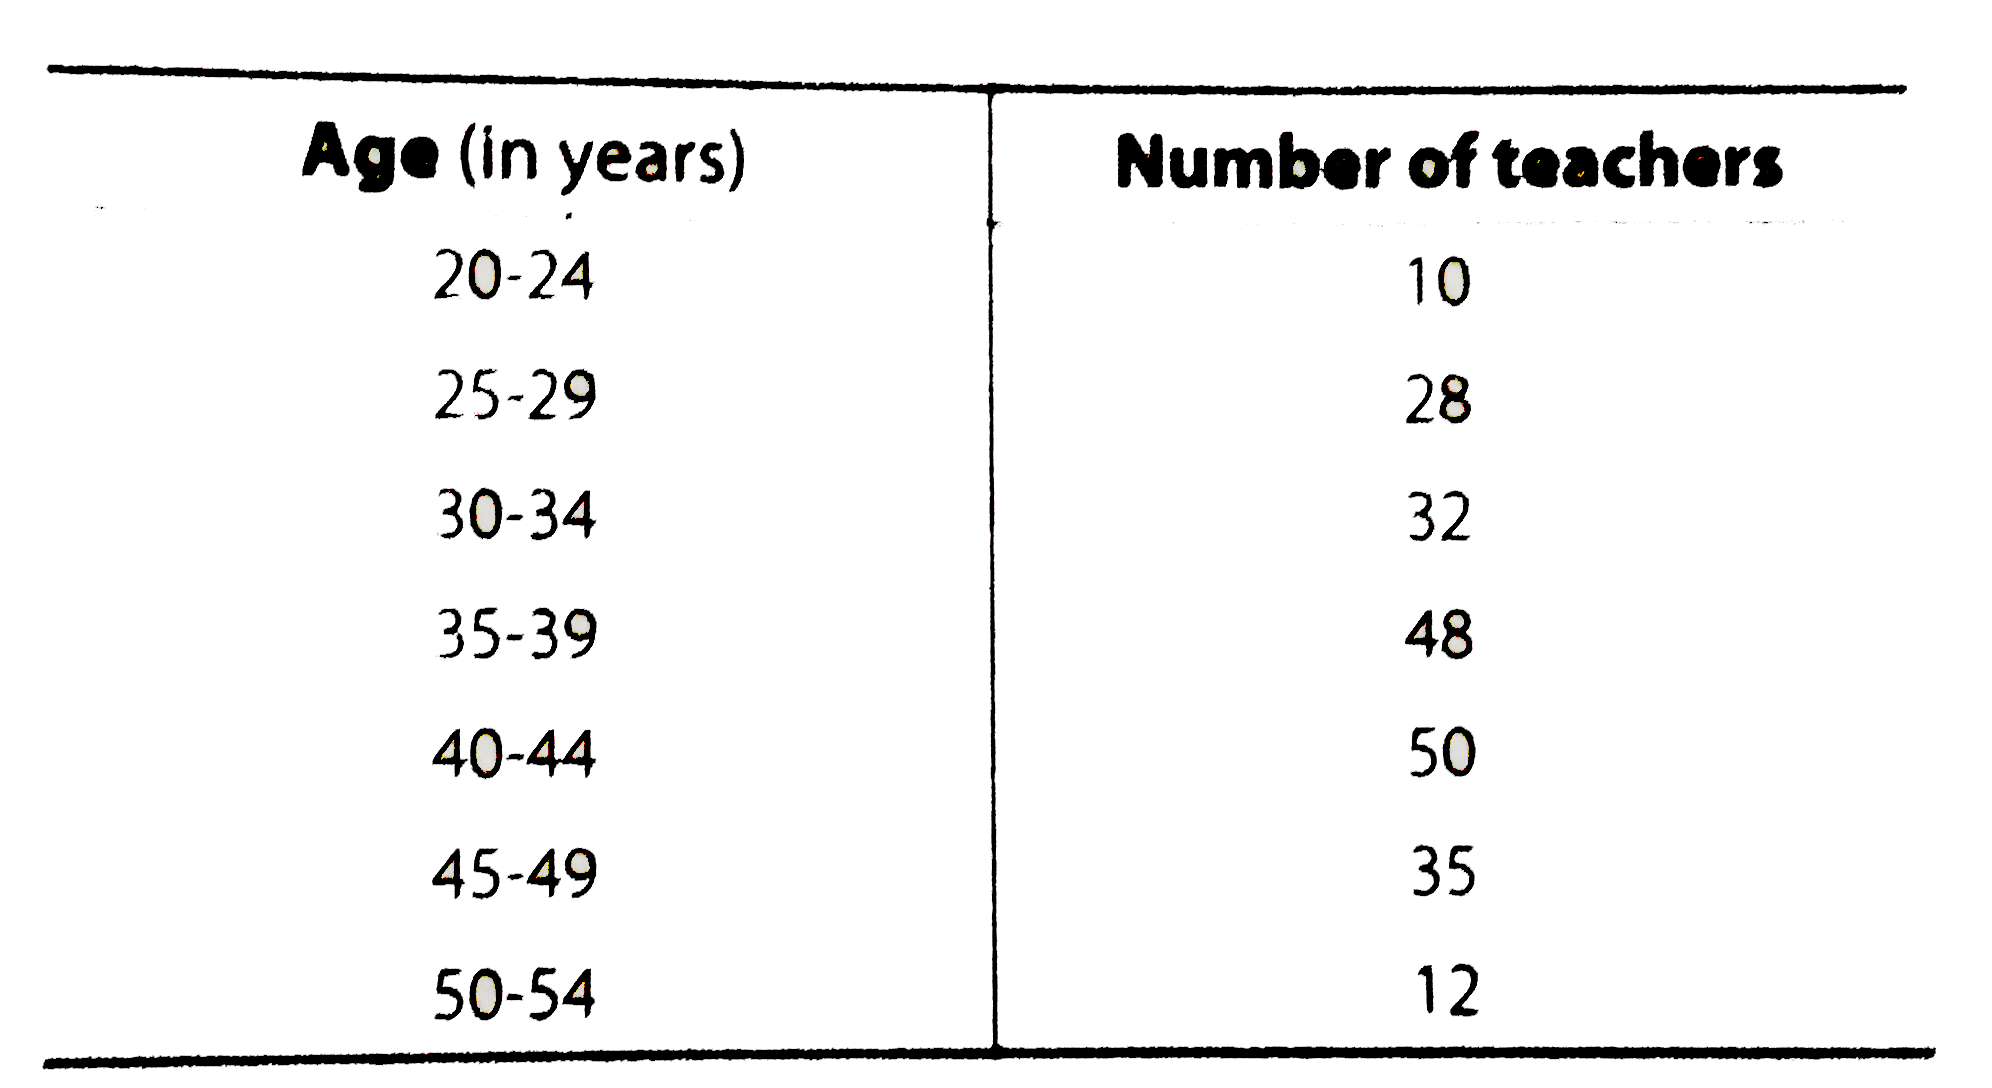
Draw a histogram representing the following distribution.

Step by step video & image solution for Draw a histogram representing the following distribution. by Maths experts to help you in doubts & scoring excellent marks in Class 10 exams.
Updated on:21/07/2023Topper's Solved these Questions
- STATISTICSBook:TARGET PUBLICATIONChapter:STATISTICSExercise:Apply your knowledge
Explore 5 Videos
- STATISTICSBook:TARGET PUBLICATIONChapter:STATISTICSExercise:Chapter Assessment
Explore 15 Videos
- STATISTICSBook:TARGET PUBLICATIONChapter:STATISTICSExercise:Multiple Choice Questions
Explore 14 Videos
- SIMILARITY Book:TARGET PUBLICATIONChapter:SIMILARITY Exercise:Chapter Assessment
Explore 19 Videos
- TRIGONOMETRY Book:TARGET PUBLICATIONChapter:TRIGONOMETRY Exercise:Chapter Assessment
Explore 18 Videos
Similar Questions
Knowledge Check
To draw a histogram to represent the following frequency distribution.
Class Interval 5−1010−1515−2525−4545−75
Frequency 6 12 10 8 15
The adjusted frequency for the class 25−45 isA6B5C3D2
Draw a histogram representing the following information :
NAV( Rupees)8−1010−1212−1414−1616−18Number of mutual funds2040302515
View SolutionDraw the histogram to represent the following data.

View SolutionThe table below shows the net asset value (NAV) per unit of mutual funds of some companies.Draw a histogram representing the information.

View SolutionDraw a histogram for the following frequency distribution.

View SolutionDraw a historgram for the following frequency distribution

View SolutionConstruct a histogram for the following distribution:

View SolutionDraw a histogram to represent the following grouped frequency distribution.

View Solution


