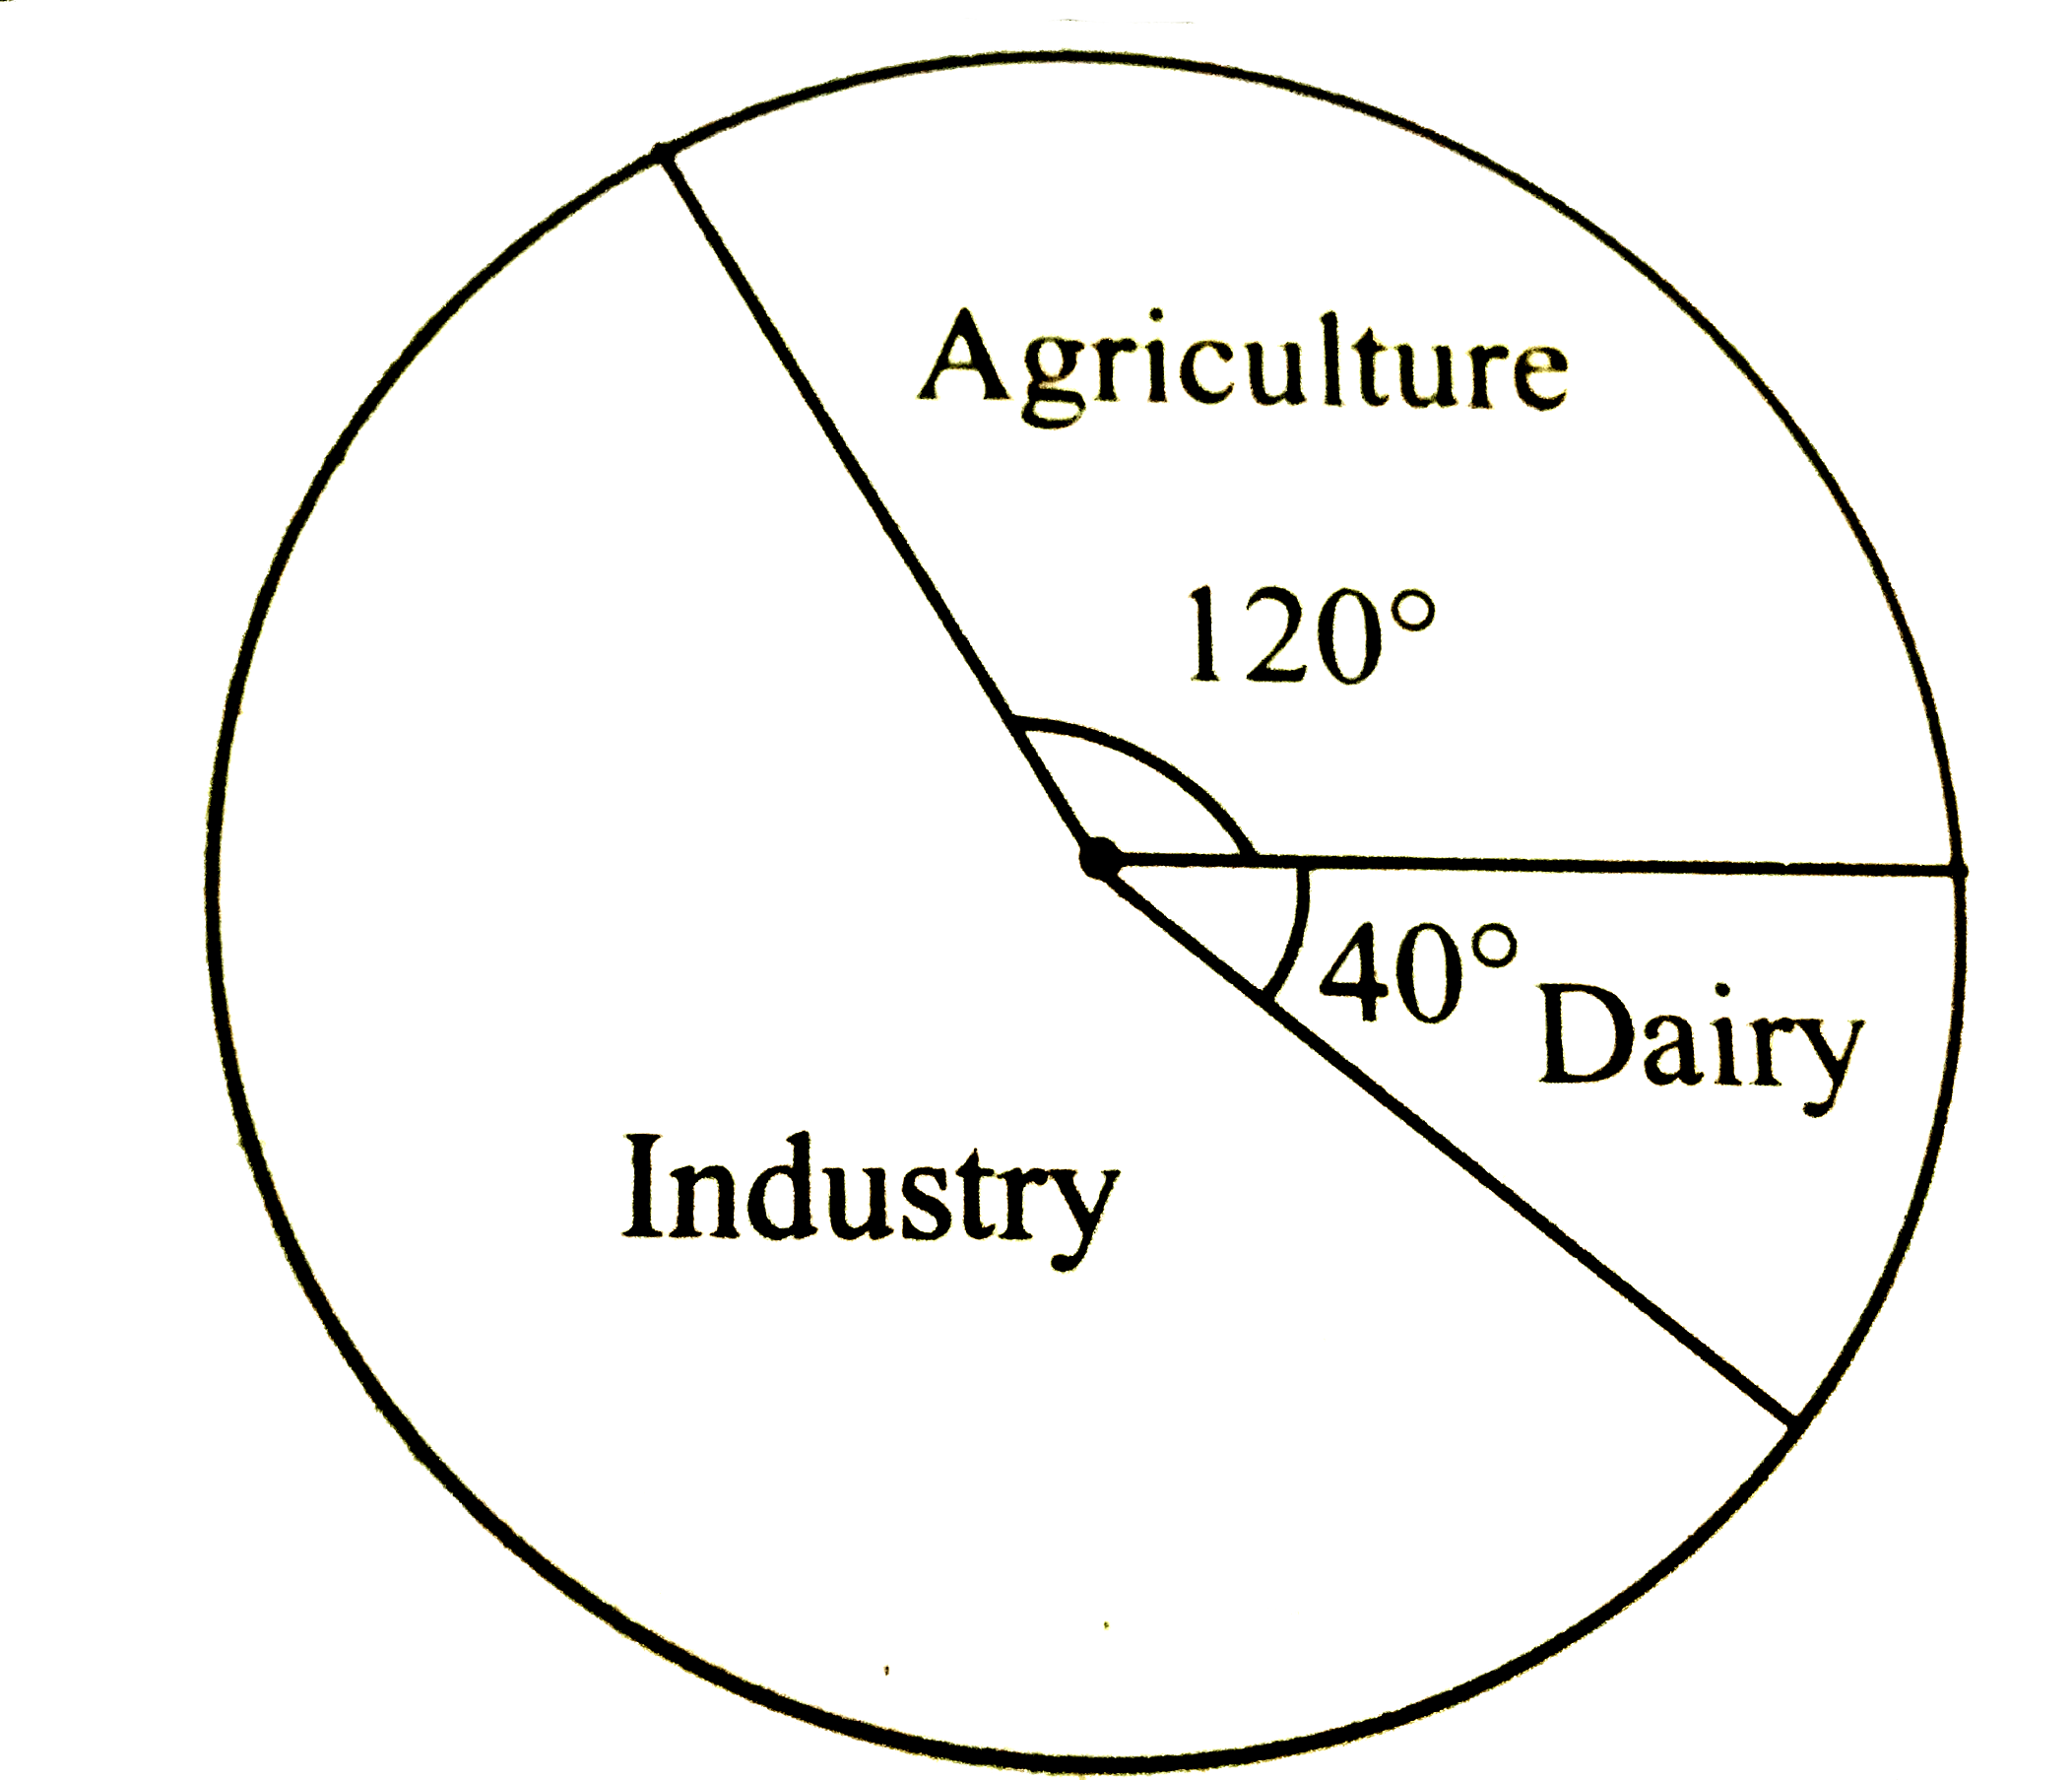
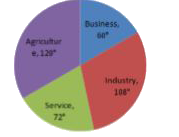
The following pie diagram represents the sectorwise loan amount in crores of rupees distributied by a bank. From the information answer the following questions:
. If the dairy sector receives crores, then find the total loan disbursed.
. Find the loan amount for agriculture sector and also for idustrial sector.
How much additional amount did industrial sector receive than agriculture sector?
The correct Answer is: crores
Agricultural sector crores aand Industrial sector crores
crores
Step by step video & image solution for The following pie diagram represents the sectorwise loan amount in crores of rupees distributied by a bank. From the information answer the following questions: i. If the dairy sector receives Rs20 crores, then find the total loan disbursed. ii. Find the loan amount for agriculture sector and also for idustrial sector. iii How much additional amount did industrial sector receive than agriculture sector? by Maths experts to help you in doubts & scoring excellent marks in Class 10 exams.
Updated on:21/07/2023Topper's Solved these Questions
- STATISTICSBook:TARGET PUBLICATIONChapter:STATISTICSExercise:Apply your knowledge
Explore 5 Videos
- STATISTICSBook:TARGET PUBLICATIONChapter:STATISTICSExercise:Chapter Assessment
Explore 15 Videos
- STATISTICSBook:TARGET PUBLICATIONChapter:STATISTICSExercise:Multiple Choice Questions
Explore 14 Videos
- SIMILARITY Book:TARGET PUBLICATIONChapter:SIMILARITY Exercise:Chapter Assessment
Explore 19 Videos
- TRIGONOMETRY Book:TARGET PUBLICATIONChapter:TRIGONOMETRY Exercise:Chapter Assessment
Explore 18 Videos
Similar Questions
Direction: Study the chart and answer the following questions
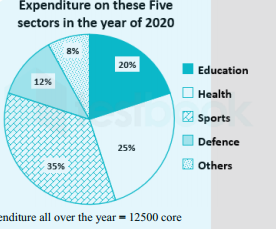
The amount spent on Education Sector is how much percent more / less than the amount of expenditure spent on Others Sector?
View SolutionThe table given below represents the amount of edication loan (in Rs. crores) disturbed by 5 banks of a country over 5 years.

Which of the following is the correct order of percentage increase in loan amount disbursed by the given banks from 2010 t 2014?
View Solution
Knowledge Check
The table given below represents the amount of education loan ( in Rs. Crores ) disbursed by 5 banks of a country over 5 years.

Which of the following is the correct order of percentage increase in loan amount disbursed by the given banks from 2010 to 2014 ?ABank 3 > Bank 5 > Bank 2 > Bank 1 > Bank 4BBank 2 > Bank 3 > Bank 5 > Bank 1 > Bank 4CBank 5 > Bank 2 > Bank 3 > Bank 4 > Bank 1DBank 2 > Bank 5 > Bank 4 > Bank 3 > Bank 1The pie chart shows the value of the total annual agricultural production of a country. Study the diagram and answer the following questions.
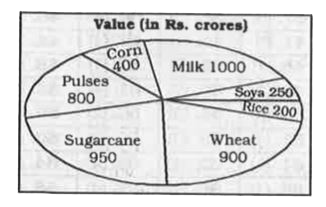
The measured of the central angle of the sector representing the production of milk is ____ degrees.A90B70C100D80Most of the agricultural labourers like Mohan depend upon loan from informal sector. Which of the following statements about this sector is correct:
AThere are govt. bodies to supervise informal sector.BMoney lenders ask for a reasonable rate of interestCCost of informal loans to the borrower is quite high.DMoney lenders use fair means to get their money back
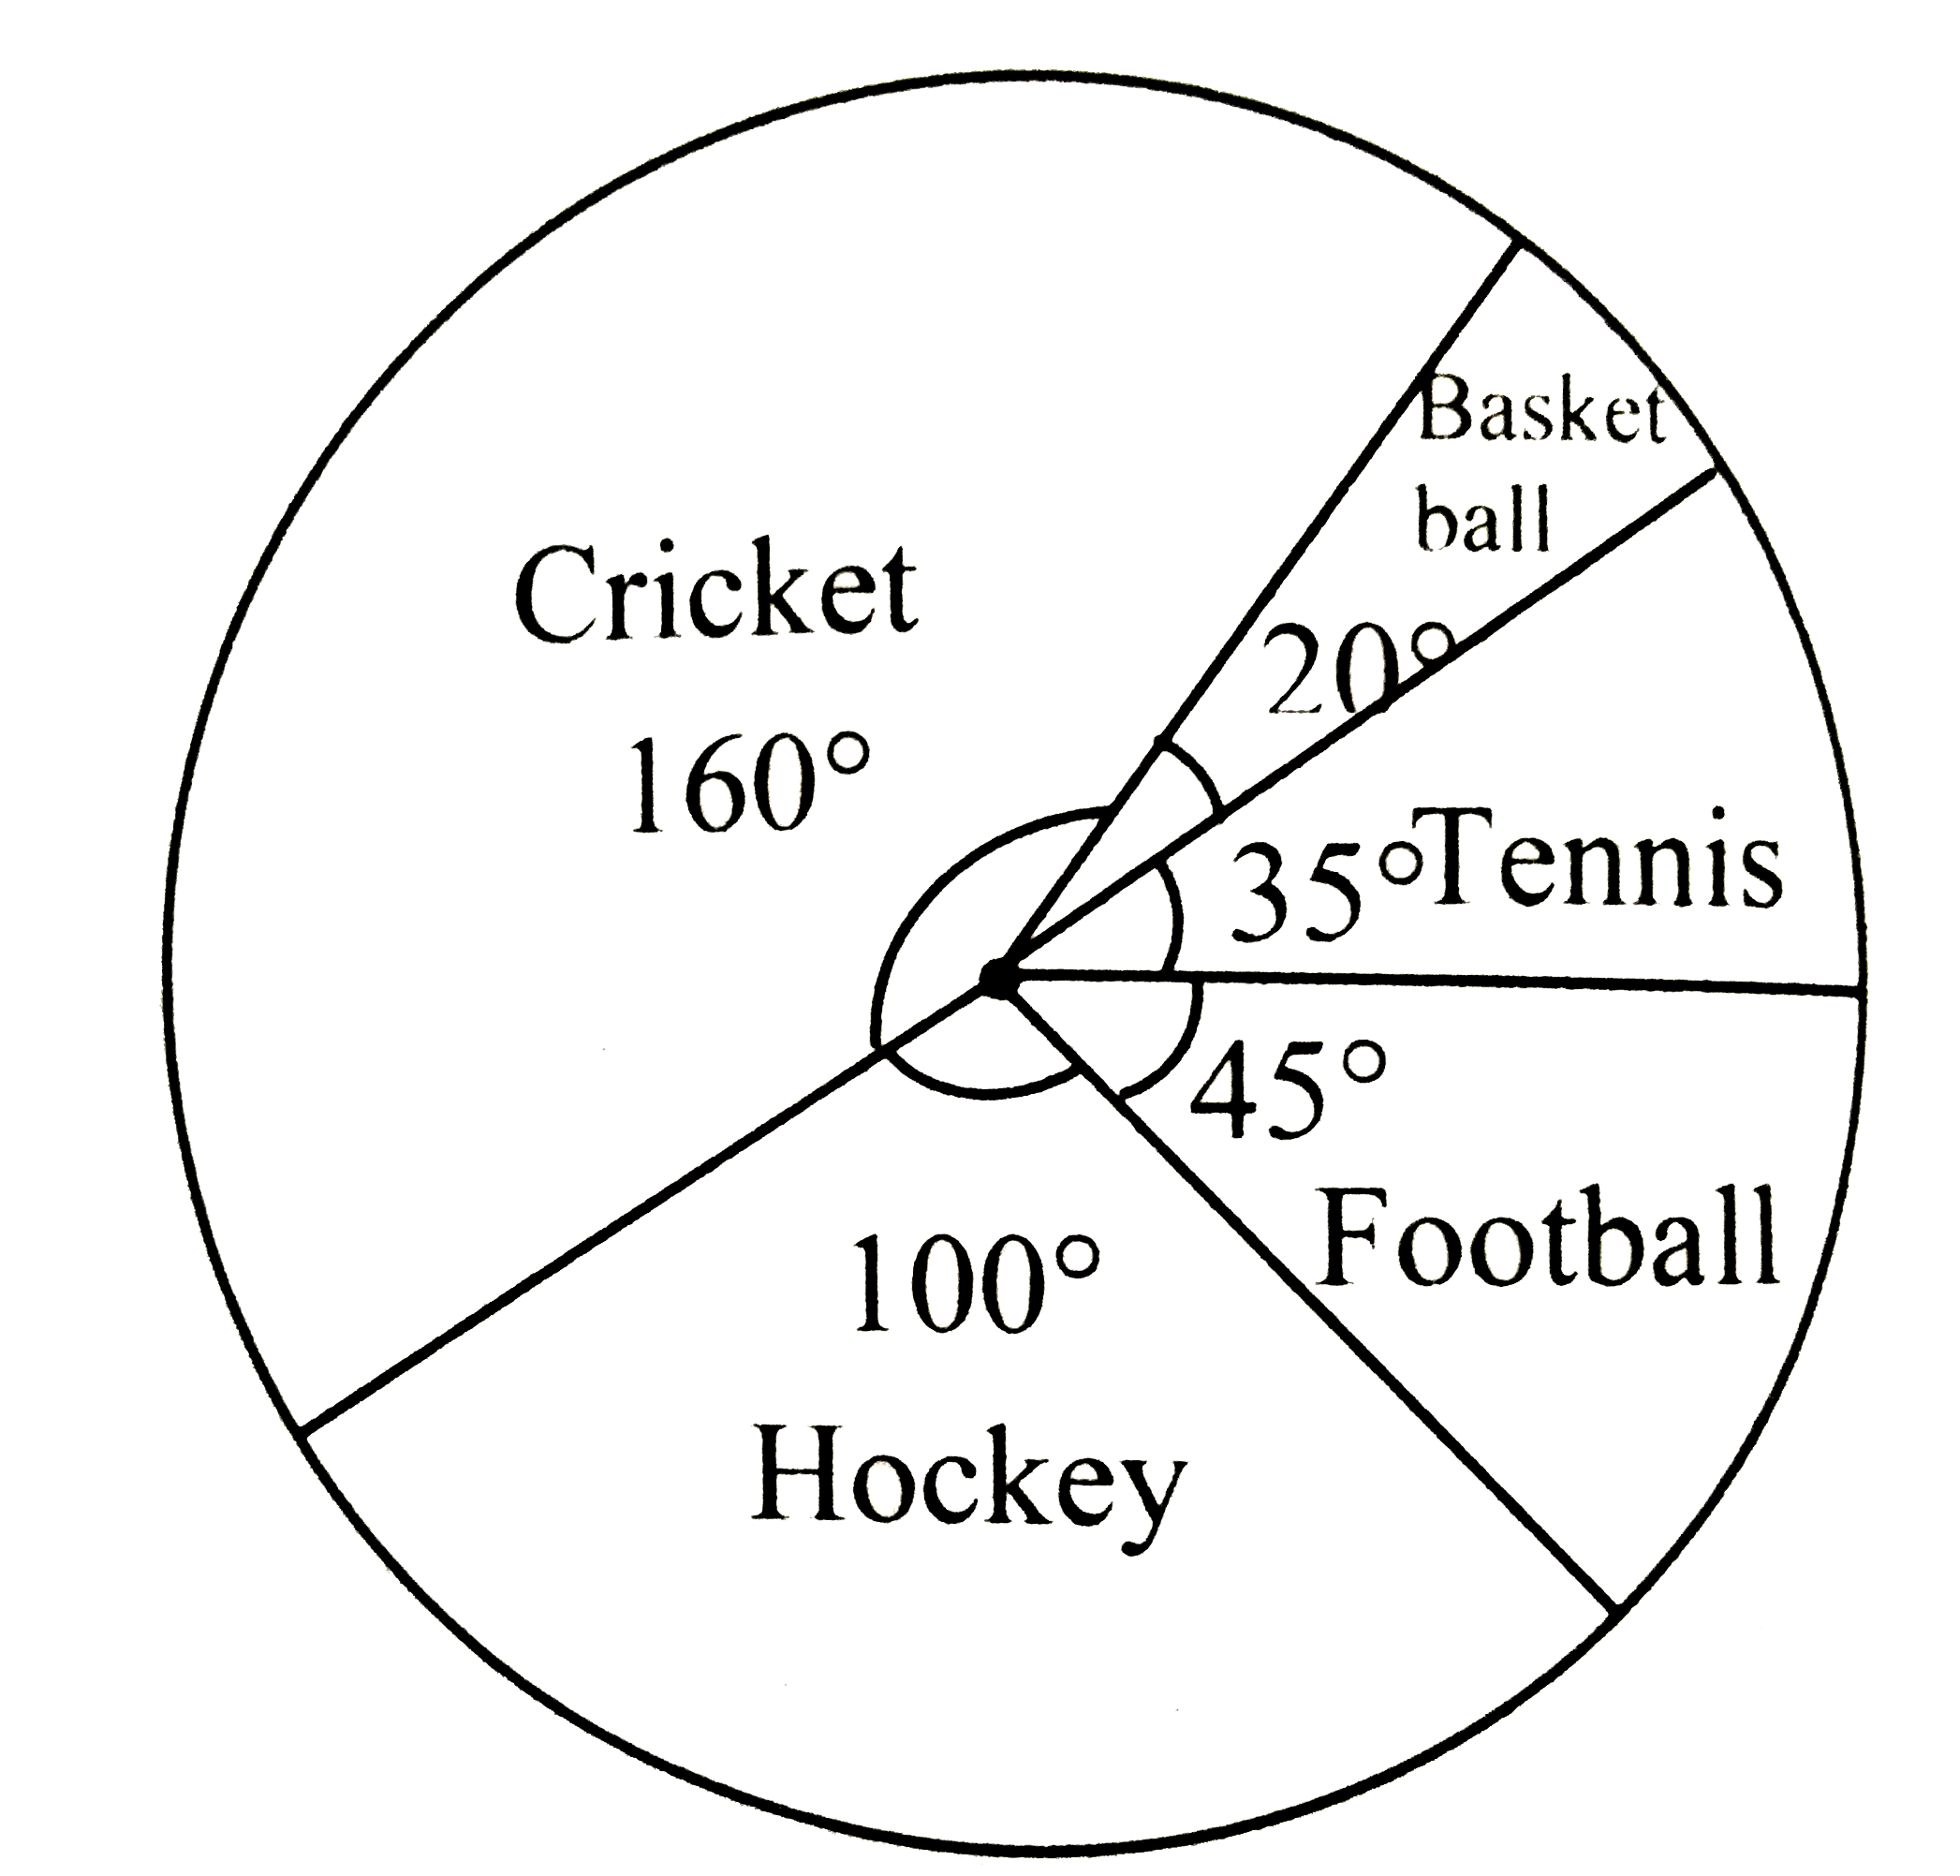
The pie diagram represents the amount spent on different sports by a school administration in a year. If the money spent on football is Rs9000, answer the following questions :
i. What is the total amount spent on sports?
ii. What is the amount spent on hockey?
iii. How much more amount is spent on tennis than on basket ball?
View SolutionThe population of a city is 8000. They have various types of occupation which is given below by the pie-chart. Study the pie-chart and answer the given questions.
How much population percent is less in industry sector than in agriculture sector?
View SolutionMost of the agricultural labourers like Mohan depend upon loans from informal sector. Which of the following statements about this sector is correct?
View SolutionThe table given below represents the amount of edication loan (in Rs. crores) disturbed by 5 banks of a country over 5 years.

What can be said about the two following ratios?
I. Loan amount disbursed by Bank 1 in 2010/ loan disbursed by Bank 2 in 2014
II. Loan amount disbursed by Bank 3 in 2014 / Loan amount disbursed by Bank 4 in 2011
View SolutionThe pie chart shows the value of the total annual agricultural production of a country. Study the diagram and answer the following questions.

The measured of the central angle of the sector representing the production of milk is ____ degrees.
View Solution

