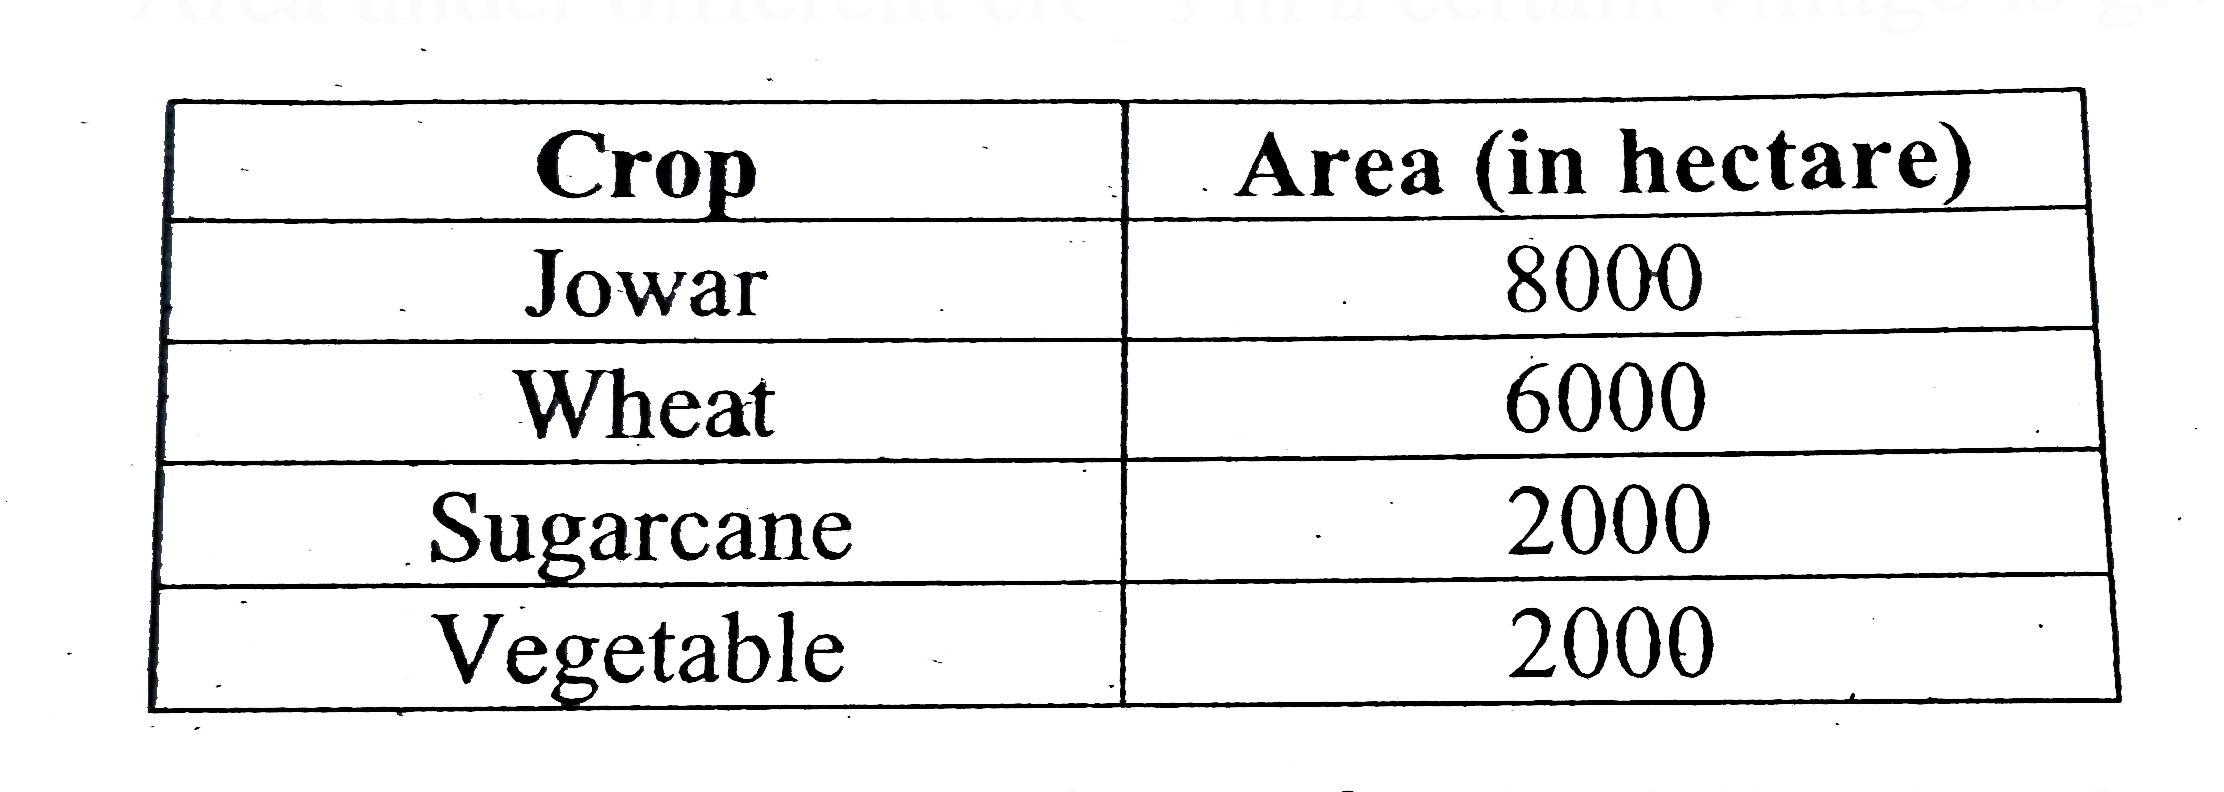
Area under different crops n a certain village is given below : Represent, it by a pie diagram:

Step by step video & image solution for Area under different crops n a certain village is given below : Represent, it by a pie diagram: by Maths experts to help you in doubts & scoring excellent marks in Class 10 exams.
Updated on:21/07/2023Topper's Solved these Questions
- STATISTICSBOOK - TARGET PUBLICATIONCHAPTER - STATISTICSEXERCISE - Apply your knowledge
5 Videos
- STATISTICSBOOK - TARGET PUBLICATIONCHAPTER - STATISTICSEXERCISE - Chapter Assessment
15 Videos
- STATISTICSBOOK - TARGET PUBLICATIONCHAPTER - STATISTICSEXERCISE - Multiple Choice Questions
14 Videos
- SIMILARITY BOOK - TARGET PUBLICATIONCHAPTER - SIMILARITY EXERCISE - Chapter Assessment
19 Videos
- TRIGONOMETRY BOOK - TARGET PUBLICATIONCHAPTER - TRIGONOMETRY EXERCISE - Chapter Assessment
18 Videos
Similar Questions
Knowledge Check
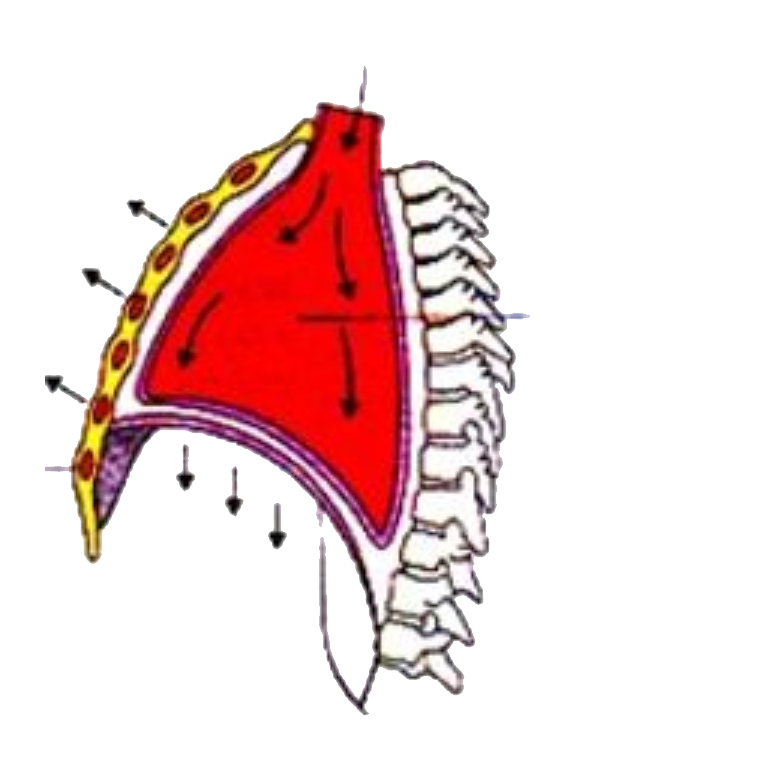
The diagram given below represents
 AinspirationBexpirationCSystoleDdiastole
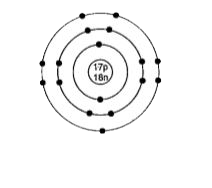
The diagram given below represents an atom of
 APotassiumBChlorineCSulphurDCalcium
The area under different crops in a certain village is given below. Draw a pie diagram showing the information.
CropJowarWheatSugar caneVegetableArea (in hectares) 40 60 50 30
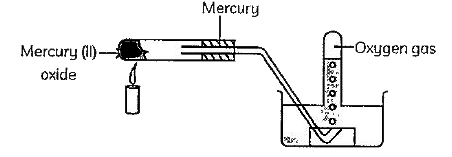
View SolutionThe diagram below represent

View SolutionThe number of hours spent by a school boy in different activities in a day is given below:

Represent the above information using pie diagram.
View SolutionThe number of hours spent by a school boy in different activities in a day is given below :

Represent the above information using a pie diagram.
View SolutionThe marks obtained by a student in an examination are given below :

Represent the data using a pie diagram.
View SolutionThe marks obtained by a student in an examination are given below:

Represent the data using pie diagram.
View Solution


