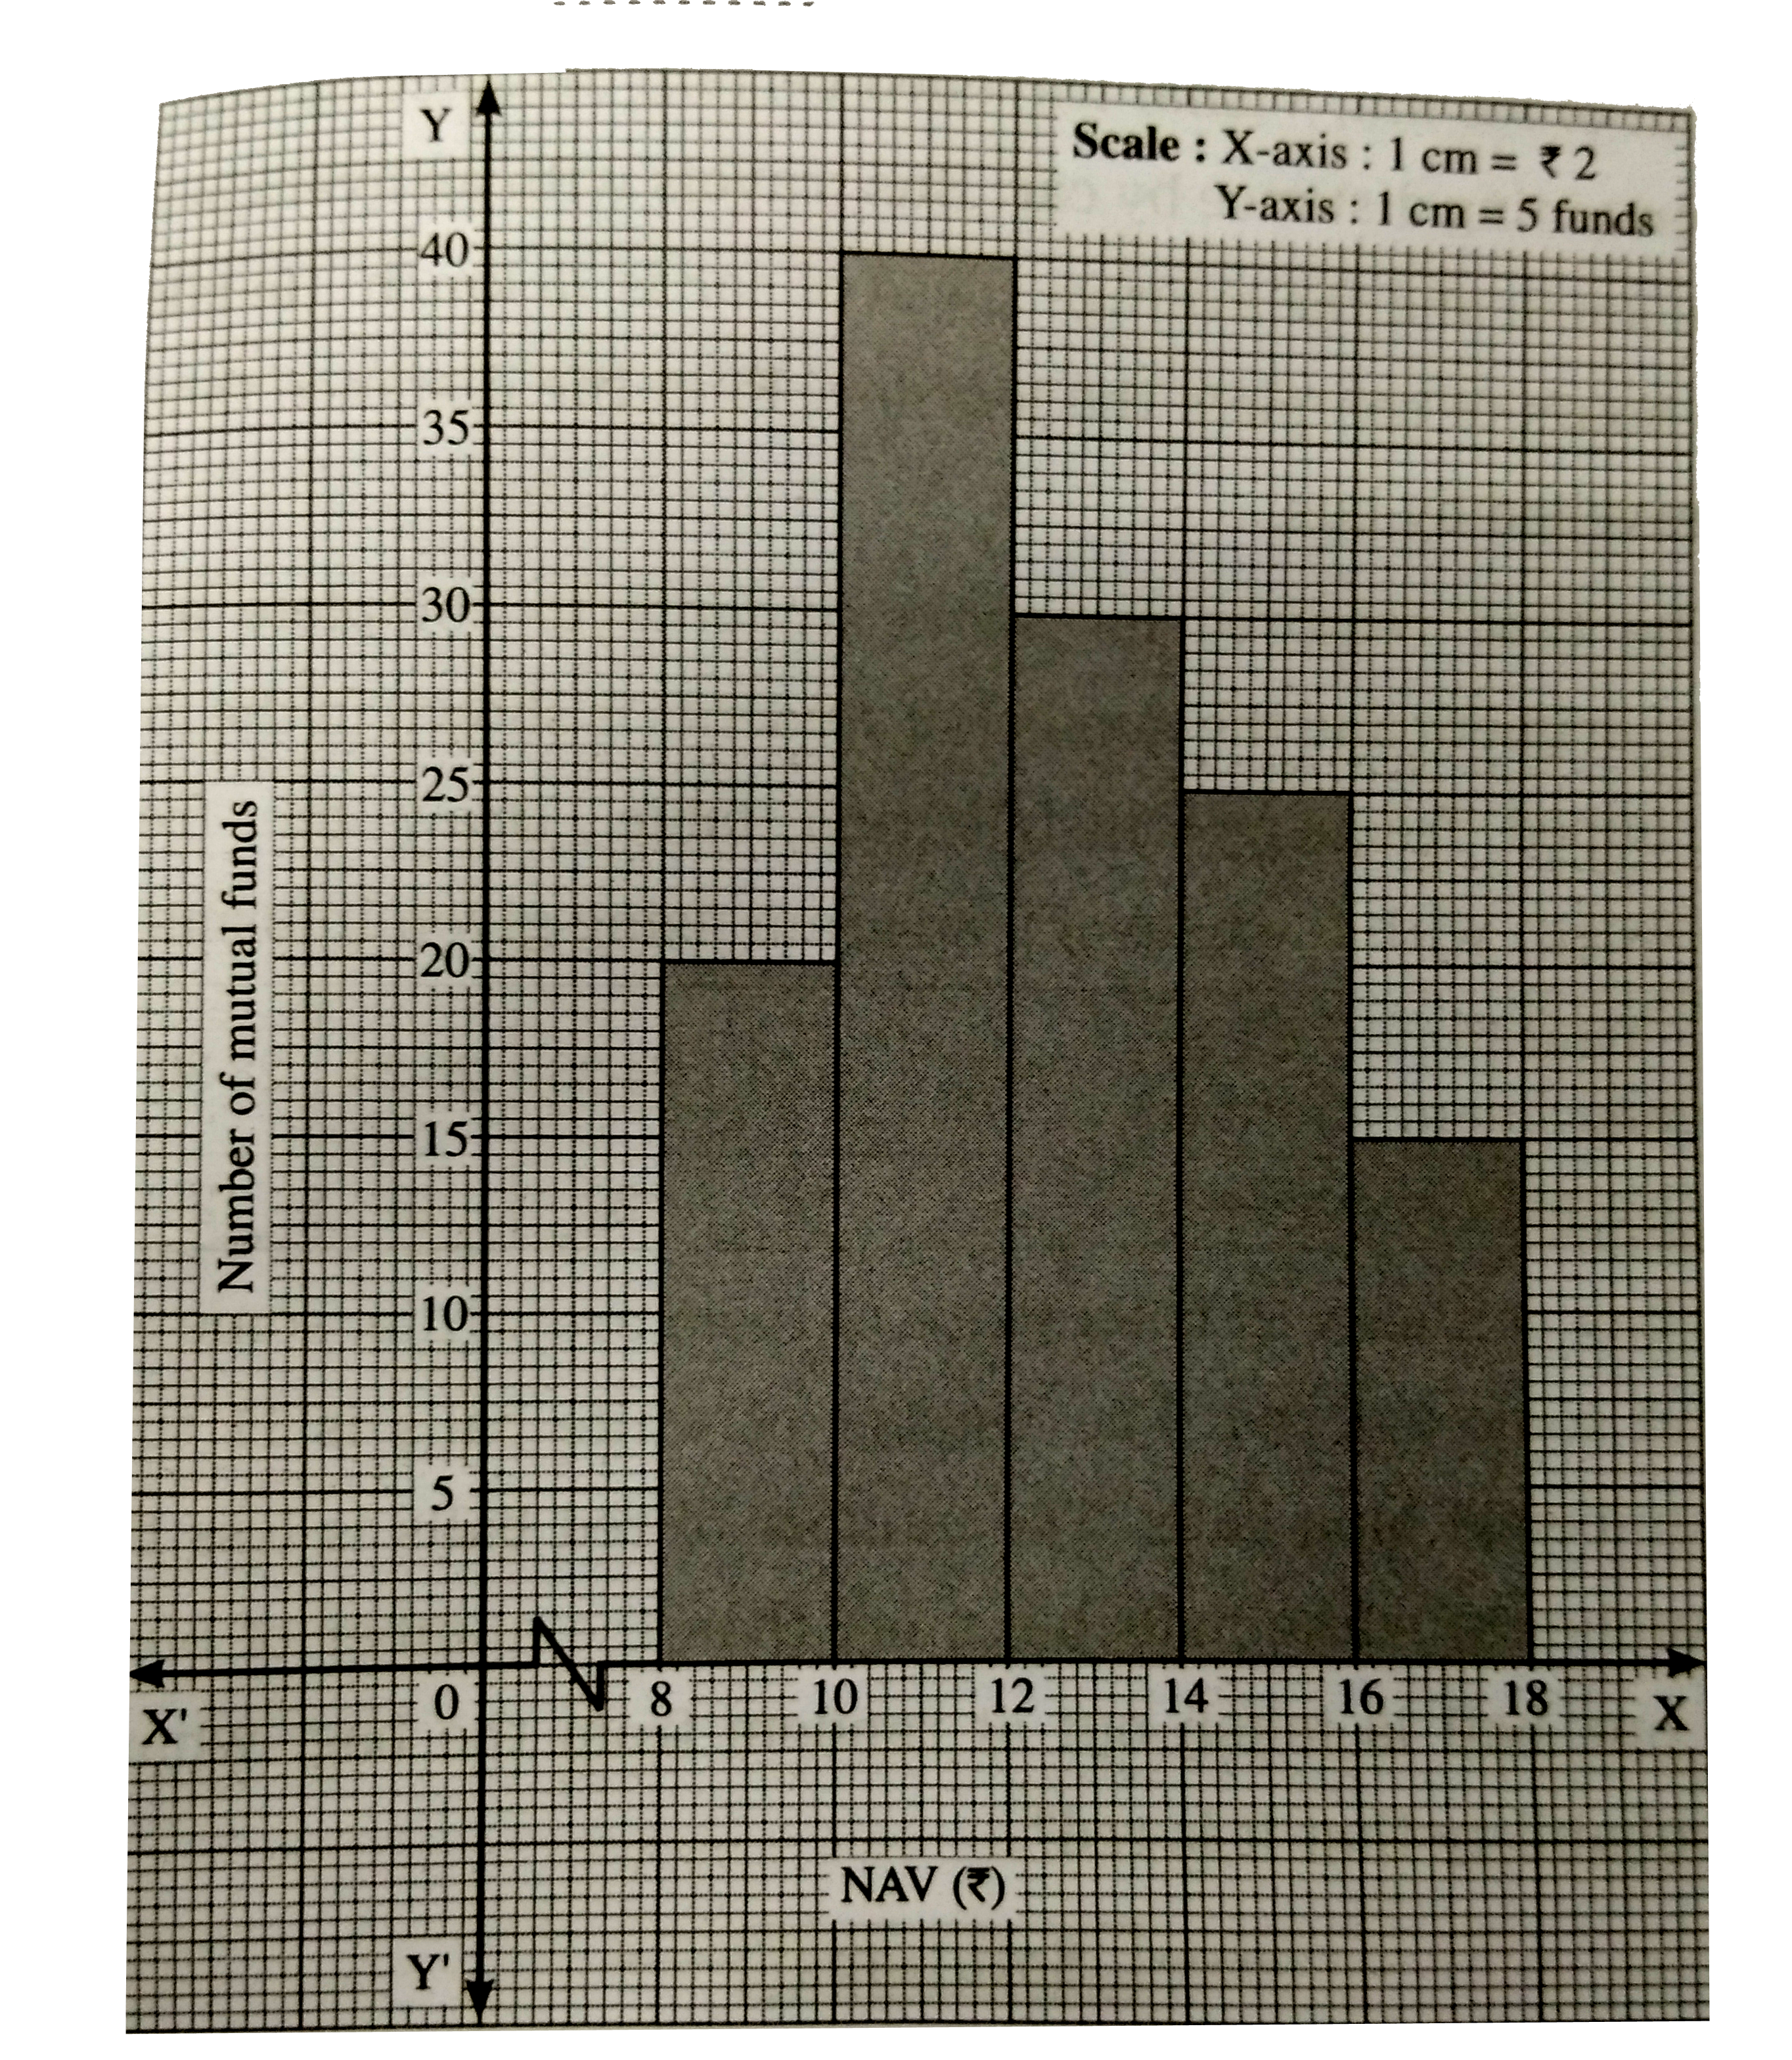
Draw a histogram representing the following information :
NAV( Rupees)8−1010−1212−1414−1616−18Number of mutual funds2040302515
Video Solution
Text Solution
|
Topper's Solved these Questions
- MODEL QUESTION PAPERBOOK - NAVNEET PUBLICATION - MAHARASHTRA BOARDCHAPTER - MODEL QUESTION PAPEREXERCISE - CHOOSE THE CORRECT ALTERNATIVE
4 Videos
- MODEL QUESTION PAPERBOOK - NAVNEET PUBLICATION - MAHARASHTRA BOARDCHAPTER - MODEL QUESTION PAPEREXERCISE - SOLVE THE FOLLOWING SUBQUESTIONS :
4 Videos
- MENSURATIONBOOK - NAVNEET PUBLICATION - MAHARASHTRA BOARDCHAPTER - MENSURATIONEXERCISE - Assignment 8.5
8 Videos
- PRACTICE QUESTION BASEDBOOK - NAVNEET PUBLICATION - MAHARASHTRA BOARDCHAPTER - PRACTICE QUESTION BASEDEXERCISE - STATISTICS
13 Videos
Similar Questions
Knowledge Check
4,6,8,10,12,14,16,18,……are
Aeven numbersBodd numbersCprime numbersDnone of the above10,14,16,18,21 ,24,26
A26B24C21D18
Find out median marks from the following data :
Marks0−1010−2020−3030−4040−50Number of Students 8 30 40 12 10
View SolutionCalculate median of the following of data :
Class Interval0−55−1010−2020−3030−5050−7070−100Number of Students 12 15 25 40 42 14 8
View SolutionArrange the following ratios in ascending order: 15:14,8:12,7:10&16:18
View SolutionCalculate the median from the following data :
Size10121416182022Frequency2512201073
View SolutionFind the mean for each of the following sets 3,10,10,12,14,16,16,18,18,25
View SolutionEstimate the mode of the following data from the histogram.
Class Interval0−1010−2020−3030−4040−5050−6060−7070−80Frequency810151620131412
View Solution

