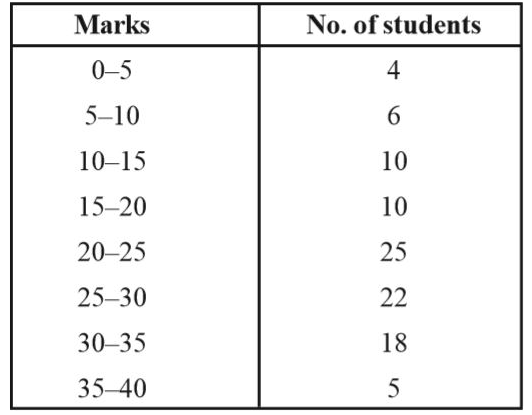
The frequency distribution of marks obtained by students in a class test is given below .
Draw frequency polygon and ogive.

Step by step video, text & image solution for The frequency distribution of marks obtained by students in a class test is given below . Draw frequency polygon and ogive. by Economics experts to help you in doubts & scoring excellent marks in Class 11 exams.
Updated on:21/07/2023Topper's Solved these Questions
- FREQUENCY DIAGRAMS - HISTOGRAM, POLYGON AND OGIVEBook:TARUN JAIN & VK OHRIChapter:FREQUENCY DIAGRAMS - HISTOGRAM, POLYGON AND OGIVEExercise:EXERCISE NCERT
Explore 7 Videos
- FREQUENCY DIAGRAMS - HISTOGRAM, POLYGON AND OGIVEBook:TARUN JAIN & VK OHRIChapter:FREQUENCY DIAGRAMS - HISTOGRAM, POLYGON AND OGIVEExercise:EXERCISE CONCEPT BASED OBJECTIVE
Explore 5 Videos
- DIAGRAMMATIC PRESENTATION OF DATA BAR DIAGRAMS AND PIE DIAGRAMSBook:TARUN JAIN & VK OHRIChapter:DIAGRAMMATIC PRESENTATION OF DATA BAR DIAGRAMS AND PIE DIAGRAMSExercise:NCERT Question (With Hints to Answers)
Explore 3 Videos
- INDEX NUMBERSBook:TARUN JAIN & VK OHRIChapter:INDEX NUMBERSExercise:NCERT Questions (With Hints to Answers)
Explore 12 Videos
Similar Questions
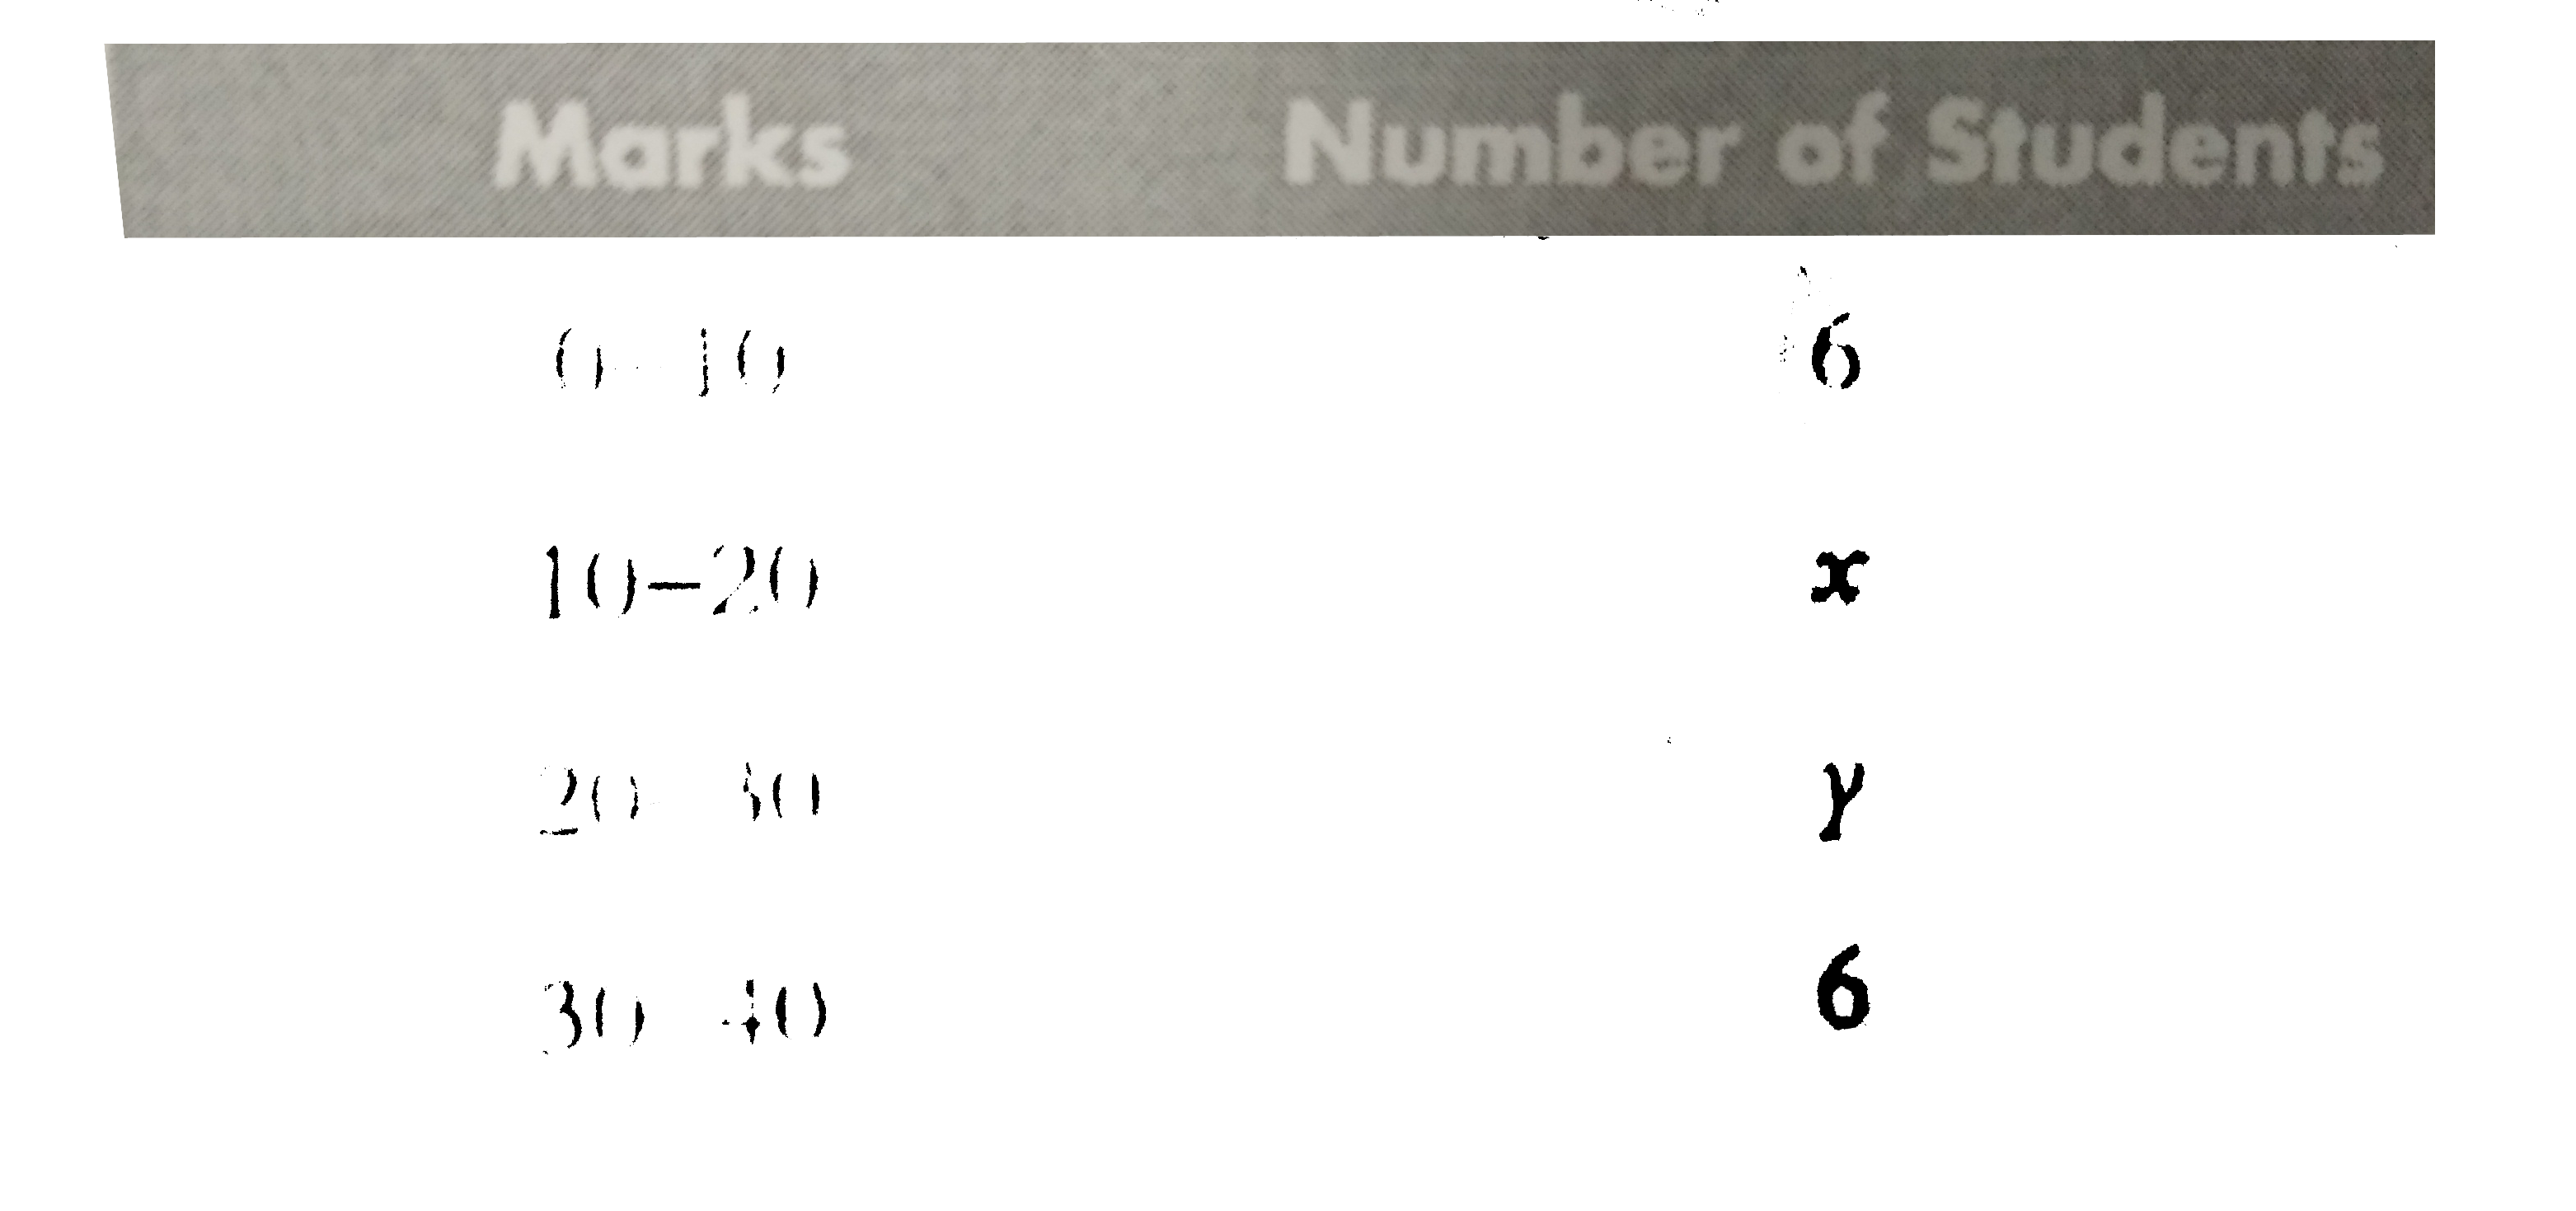
The frequency distribution of the marks obtained by 28 students in a test carrying 40 marks is given below :

If the mean of the above data is 20 , then find the difference between x and y .
View SolutionIf for somex∈R, the frequency distribution of the marks obtained by 20 students in a test is:

Then the mean of the marks is:
View Solution
Knowledge Check
In the given table, frequency distribution of marks obtained by the stubents in a question paper of mathematics are given below

Then, median of marks isA27.7B25C17.3D9The frequency distribution of marks obtained by 28 students in a test carrying 40 marks is given below:
Marks:0−1010−2020−3030−40Number of students:6xy6
If the mean of the above data is 20, then the difference between x and y isA3B2C1D0If for somes x∈R the frequency distribution of marks obtained by 20 students in a test is:

Then the mean of the marks is:A2.5B3.0C2.8D3.2
There are 60 students in a class. The following is the frequency distribution of the marks obtained by the students in a test:

Where "p" is positive integer. Determine the mean and standard deviation of the marks.
View SolutionHow is a frequency polygon obtained?
View SolutionThere are 60 students in a class. The following is the frequency distribution of marks obtained by the students in a test: Marks:, 0, 1, 2, 3, 4, 5 Frequency , x−2 , x , x2 , (x+1)2 , 2x , x+1. Determine mean and standard deviation of the marks.
View SolutionConsider the marks, out of 100, obtained by 50 students of a class given in the table.

Draw a frequency polygon corresponding to this frequency distribution table using histogram.
View SolutionThe distribution given below show the marks of 100 students of a class:
then find Ogive medium of data
View Solution

