Depict the following frequency distribution by a histogram:
Video Solution
Text Solution
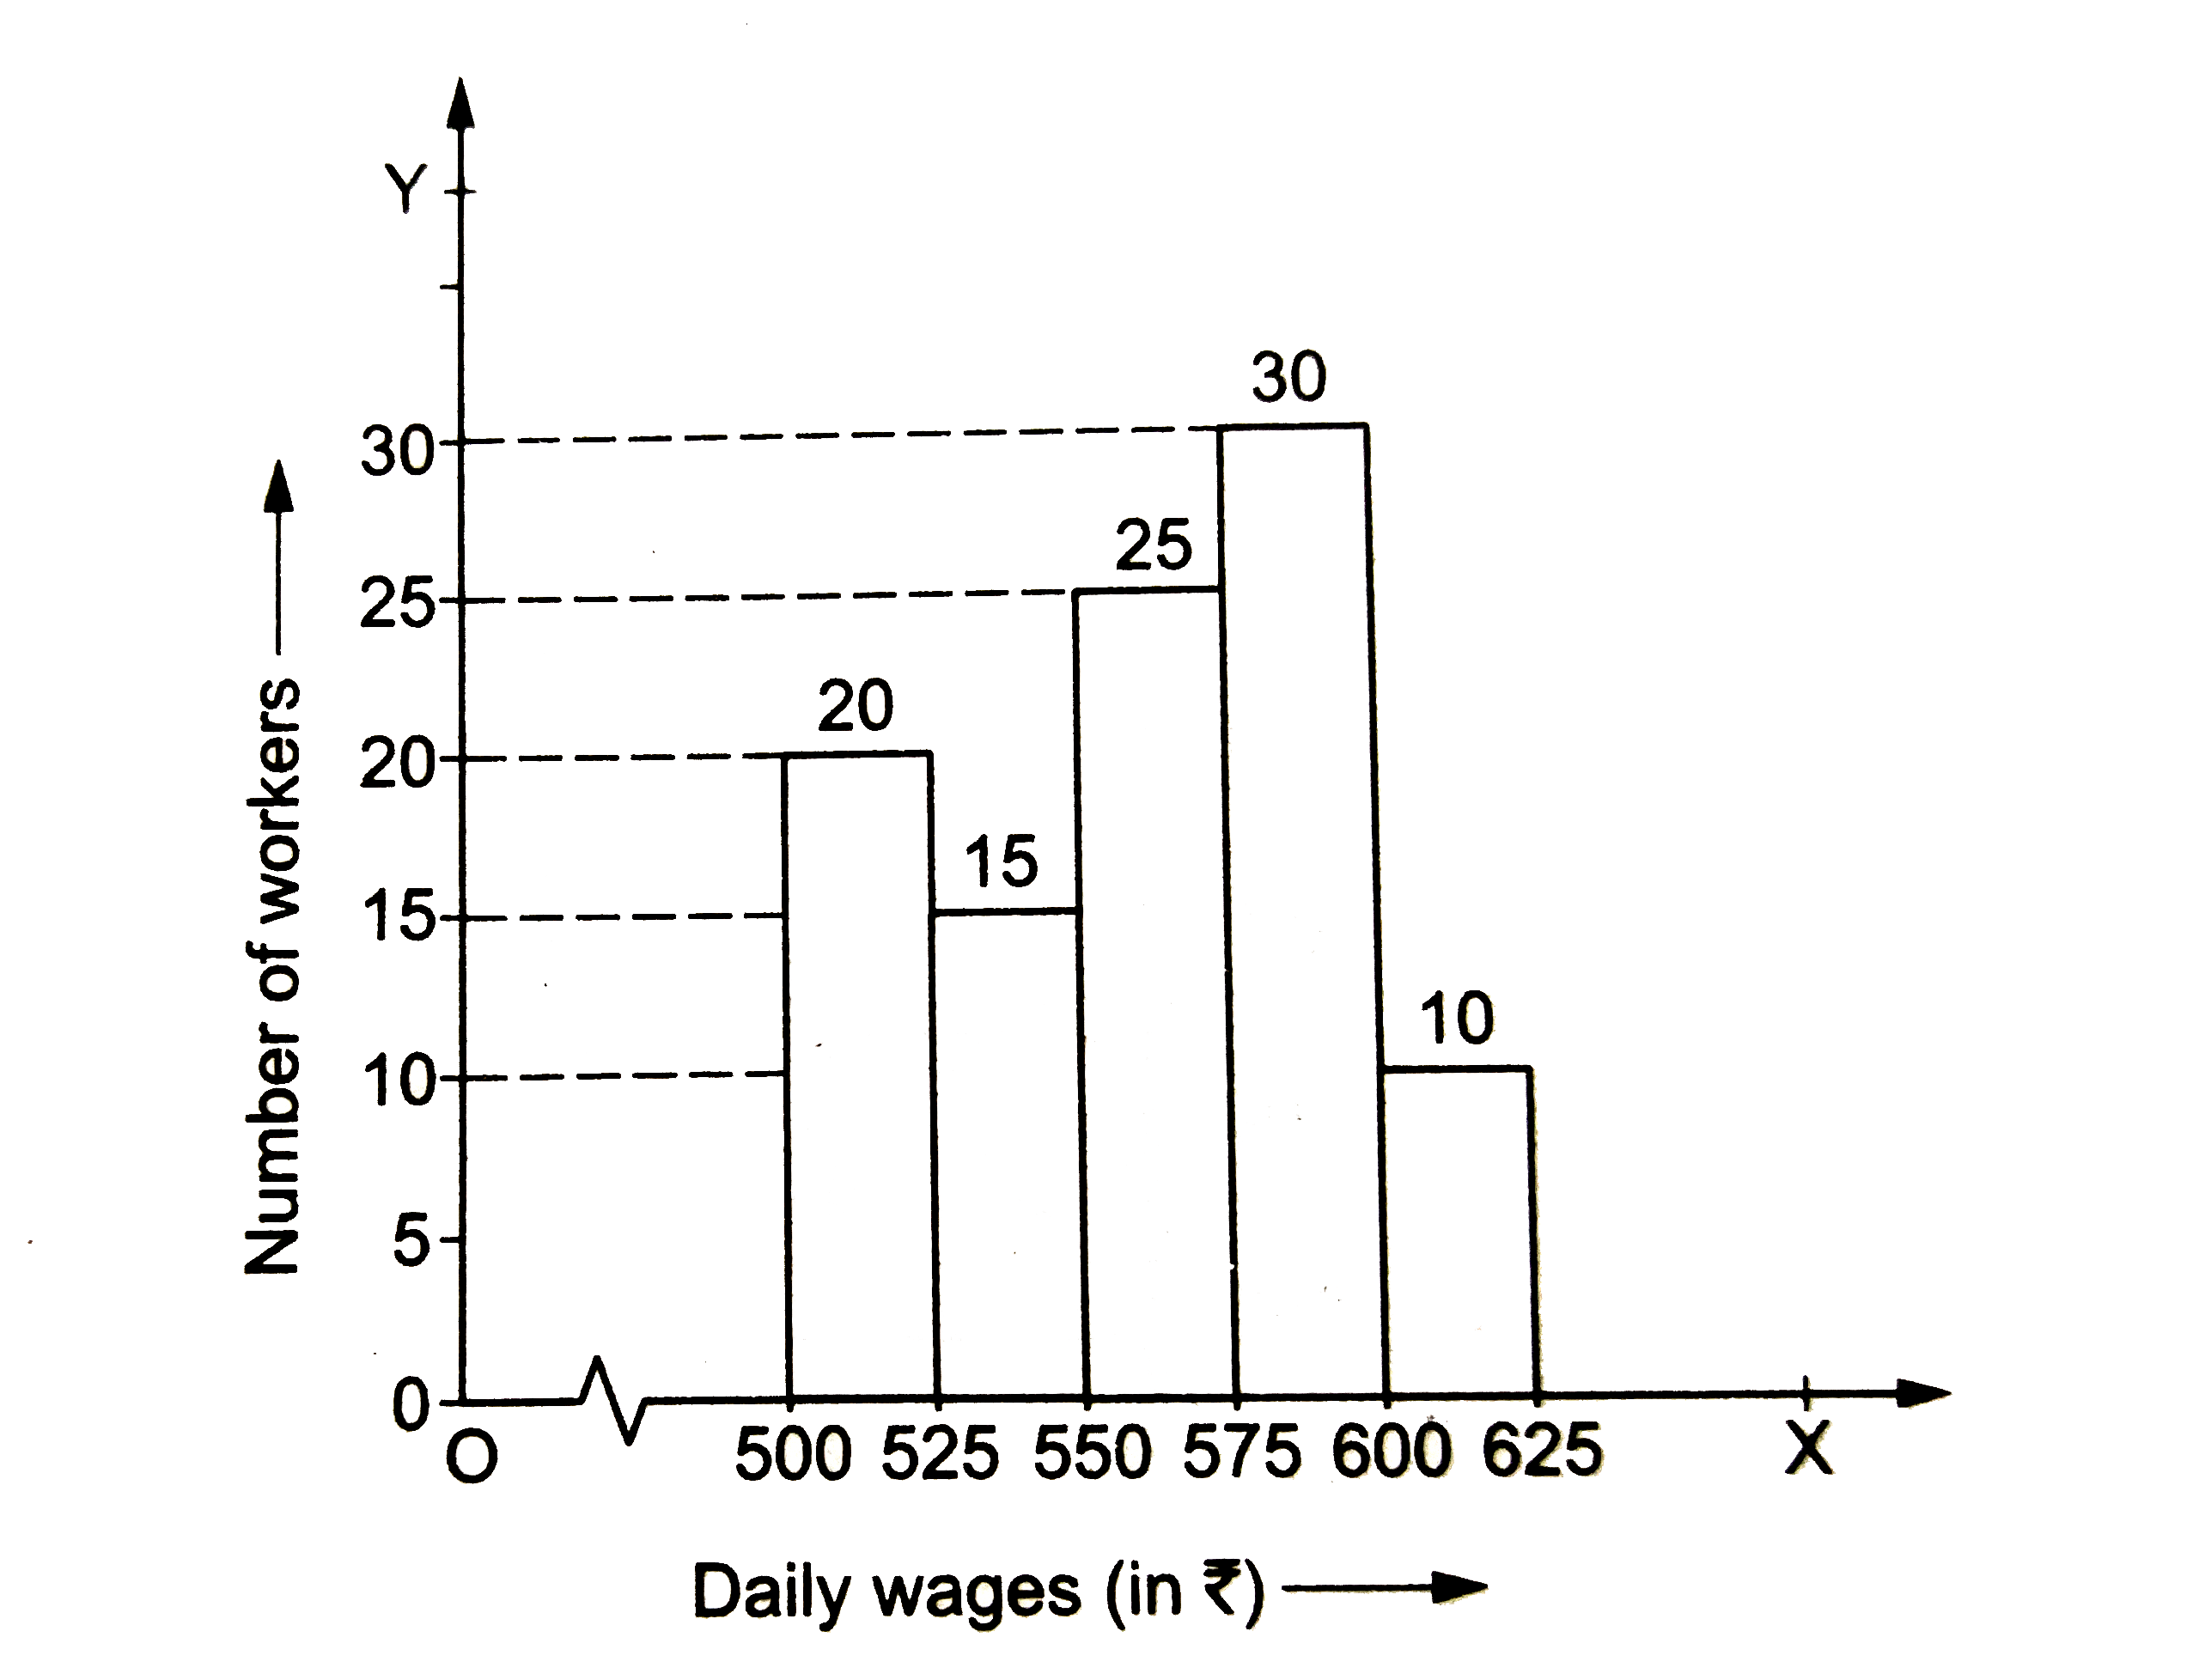
Clearly, the given frequency distribution is in exclusive form. Here, the class intervals represent the daily wages in rupees and the corresponding frequencies represent the number of workers.
We represent the class intervals along the x-axis on a suitable scale and the corresponding frequencies along the y-axis on another suitable scale. Since the scale along the x-axis starts at rupee 500, so a kink, i.e. a break  is indicated at the origin.
We construct rectangles with class intervals as bases and the corresponding frequencies as heights. Thus, we obtain a histogram, as shown below.
|
Topper's Solved these Questions
- BAR GRAPH, HISTOGRAM AND FREQUENCY POLYGONBOOK - RS AGGARWALCHAPTER - BAR GRAPH, HISTOGRAM AND FREQUENCY POLYGONEXERCISE - EXERCISE 17A
12 Videos
- BAR GRAPH, HISTOGRAM AND FREQUENCY POLYGONBOOK - RS AGGARWALCHAPTER - BAR GRAPH, HISTOGRAM AND FREQUENCY POLYGONEXERCISE - EXERCISE 17B
16 Videos
- BAR GRAPH, HISTOGRAM AND FREQUENCY POLYGONBOOK - RS AGGARWALCHAPTER - BAR GRAPH, HISTOGRAM AND FREQUENCY POLYGONEXERCISE - EXERCISE 17B
16 Videos
- AREAS OF TRIANGLES AND QUADRILATERALSBOOK - RS AGGARWALCHAPTER - AREAS OF TRIANGLES AND QUADRILATERALSEXERCISE - Multiple Choice Questions (Mcq)
16 Videos
- CIRCLES BOOK - RS AGGARWALCHAPTER - CIRCLES EXERCISE - MULTIPLE CHOICE QUESTION(MCQ)
37 Videos
Similar Questions
Knowledge Check
To draw a histogram to represent the following frequency distribution.
Class Interval 5−1010−1515−2525−4545−75
Frequency 6 12 10 8 15
The adjusted frequency for the class 25−45 isA6B5C3D2
Consider the following frequency distribution :
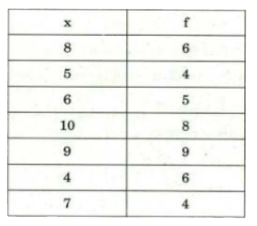
What is the median for the distribution?
View SolutionConsider the following frequency distribution
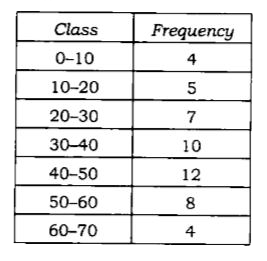
What is the mean of the distribution?
View SolutionConsider the following frequency distribution
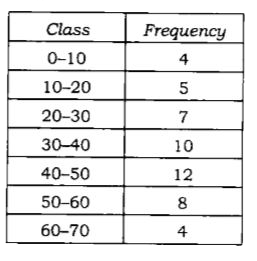
What is the mode of the distribution?
View SolutionFind mode of the following frequency distribution.

View SolutionFind the mode of following frequency distribution :
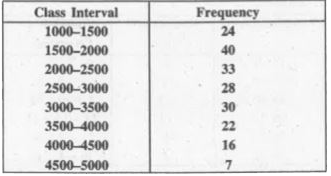
View SolutionThe mean of the following frequency distribution is 50 :

View SolutionFind the frequencies in the following frequency distribution if it is known that the mean of the distribution is 1.46.
View Solution


