Represent the motion of an object thrown upward with the help of velocity-time graph.
To represent the motion of an object thrown upward with the help of a velocity-time graph, we can follow these steps:
Step 1: Understand the Motion
When an object is thrown upward, it initially moves against the force of gravity. As it rises, its velocity decreases until it reaches the highest point, where its velocity becomes zero. After that, it starts to fall back down, and its velocity increases in the downward direction.
Step 2: Define the Variables
- Initial Velocity (u): The velocity at which the object is thrown upward.
- Final Velocity (v): The velocity of the object at any time t.
- Acceleration (a): The acceleration due to gravity (g), which acts downward and is taken as negative in this scenario.
Step 3: Establish the Equation of Motion
Using the first equation of motion:
v=u−gt
Where:
- v is the final velocity,
- u is the initial velocity,
- g is the acceleration due to gravity (approximately 9.81m/s2),
- t is the time.
Step 4: Determine the Graph's Axes
- The vertical axis (y-axis) represents velocity (v).
- The horizontal axis (x-axis) represents time (t).
Step 5: Identify Key Points on the Graph
1. Y-Intercept: At t=0, the velocity is u. This is where the graph intersects the y-axis.
2. Zero Velocity Point: The object will reach its maximum height when v=0. We can find the time at which this occurs using the equation 0=u−gt, giving us t=ug.
3. Negative Velocity: After reaching the maximum height, the object will start falling back down, and its velocity will become negative.
Step 6: Draw the Graph
- Start at the point (0,u) on the y-axis.
- Draw a straight line with a negative slope, which represents the decrease in velocity as the object rises until it reaches the maximum height at t=ug where the velocity is zero.
- After this point, continue the line downward, indicating that the object is falling back down with increasing negative velocity.
Step 7: Label the Graph
- Label the axes: "Velocity (m/s)" for the vertical axis and "Time (s)" for the horizontal axis.
- Mark the y-intercept as u and the point where the velocity is zero.
- Indicate that the slope of the line represents the acceleration due to gravity, which is negative.
Final Graph
The resulting graph will show a straight line starting from the initial velocity u, decreasing to zero at the peak of the motion, and then continuing downward into negative velocity as the object falls back to the ground.
---
When an object is thrown upward, it initially moves against the force of gravity. As it rises, its velocity decreases until it reaches the highest point, where its velocity becomes zero. After that, it starts to fall back down, and its velocity increases in the downward direction.
- Initial Velocity (u): The velocity at which the object is thrown upward.
- Final Velocity (v): The velocity of the object at any time t.
- Acceleration (a): The acceleration due to gravity (g), which acts downward and is taken as negative in this scenario.
Using the first equation of motion:
v=u−gt
Where:
- v is the final velocity,
- u is the initial velocity,
- g is the acceleration due to gravity (approximately 9.81m/s2),
- t is the time.
- The vertical axis (y-axis) represents velocity (v).
- The horizontal axis (x-axis) represents time (t).
1. Y-Intercept: At t=0, the velocity is u. This is where the graph intersects the y-axis.
2. Zero Velocity Point: The object will reach its maximum height when v=0. We can find the time at which this occurs using the equation 0=u−gt, giving us t=ug.
3. Negative Velocity: After reaching the maximum height, the object will start falling back down, and its velocity will become negative.
- Start at the point (0,u) on the y-axis.
- Draw a straight line with a negative slope, which represents the decrease in velocity as the object rises until it reaches the maximum height at t=ug where the velocity is zero.
- After this point, continue the line downward, indicating that the object is falling back down with increasing negative velocity.
- Label the axes: "Velocity (m/s)" for the vertical axis and "Time (s)" for the horizontal axis.
- Mark the y-intercept as u and the point where the velocity is zero.
- Indicate that the slope of the line represents the acceleration due to gravity, which is negative.
The resulting graph will show a straight line starting from the initial velocity u, decreasing to zero at the peak of the motion, and then continuing downward into negative velocity as the object falls back to the ground.
Topper's Solved these Questions
- MOTION IN A STRAIGHT LINE BOOK - MODERN PUBLICATIONCHAPTER - MOTION IN A STRAIGHT LINE EXERCISE - REVISION EXERCISE (FILL IN THE BLANKS)
10 Videos
- MOTION IN A STRAIGHT LINE BOOK - MODERN PUBLICATIONCHAPTER - MOTION IN A STRAIGHT LINE EXERCISE - REVISION EXERCISE (SHORT ANSWER QUESTIONS)
19 Videos
- MOTION IN A STRAIGHT LINE BOOK - MODERN PUBLICATIONCHAPTER - MOTION IN A STRAIGHT LINE EXERCISE - HIGHER ORDER THINKING SKILL AND ADVANCED LEVEL QUESTION WITH ANSWER
5 Videos
- MOTION IN A PLANE BOOK - MODERN PUBLICATIONCHAPTER - MOTION IN A PLANE EXERCISE - Chapter Practice Test
15 Videos
- OSCILLATIONS BOOK - MODERN PUBLICATIONCHAPTER - OSCILLATIONS EXERCISE - Practice Test (For Board Examination)
12 Videos
Similar Questions
Knowledge Check
Asserion : The acceleration of an object at a particular time is the slope of the velocity-time graph at that instant of time.
Reason : For uniform motion acceleration is zero.AIf both assertion and reason are trure and reason is the correct explanation of assertion.BIf both assertion and reason are true but reason is not the correct explanations of assertion.CIf assertion is true but reason is false.DIf both assertion and reason is false
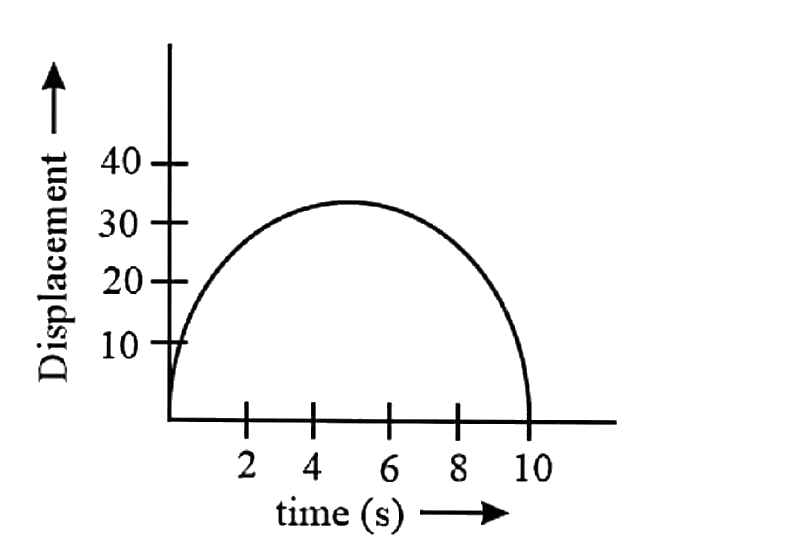
The displacement-time of a moving object is shown in figure. Which of the velocity-time graphs shown in figure could represent the motion of the same body?

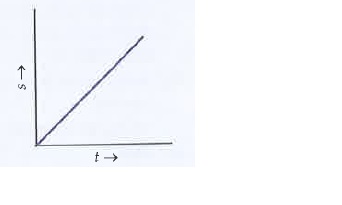
View SolutionDisplacement-time graph of any object is shown in the adjacent figure. Draw velocity-time graph for this motion.

View SolutionAcceleration-time graph of a moving object is shown in figure. Draw the velocity- time graph and displacement-time graph corresponding to this type of motion.
 .
.
View SolutionRepresent the motion of an object in unifrom motion along a straight line when both initial distance and velocity of the object is positive .
View SolutionDraw the position-time graph for an object in uniform motion. Show that the slope of the position-time graph gives the velocity of the object.
View SolutionGraphs are very useful to represent a physical situation. Various quantities can be easily represented on graphs and other quantites can be determined from the graph. For example the slope of velocity-time graph represents instantaneous acceleration. For a motion with constant acceleration slope of velocity-time graph is constant. If acceleration is changing with time, slope with change and thus velocity-time graph will be a non-linear curve. Further the area of velocity-time graph gives displacement.
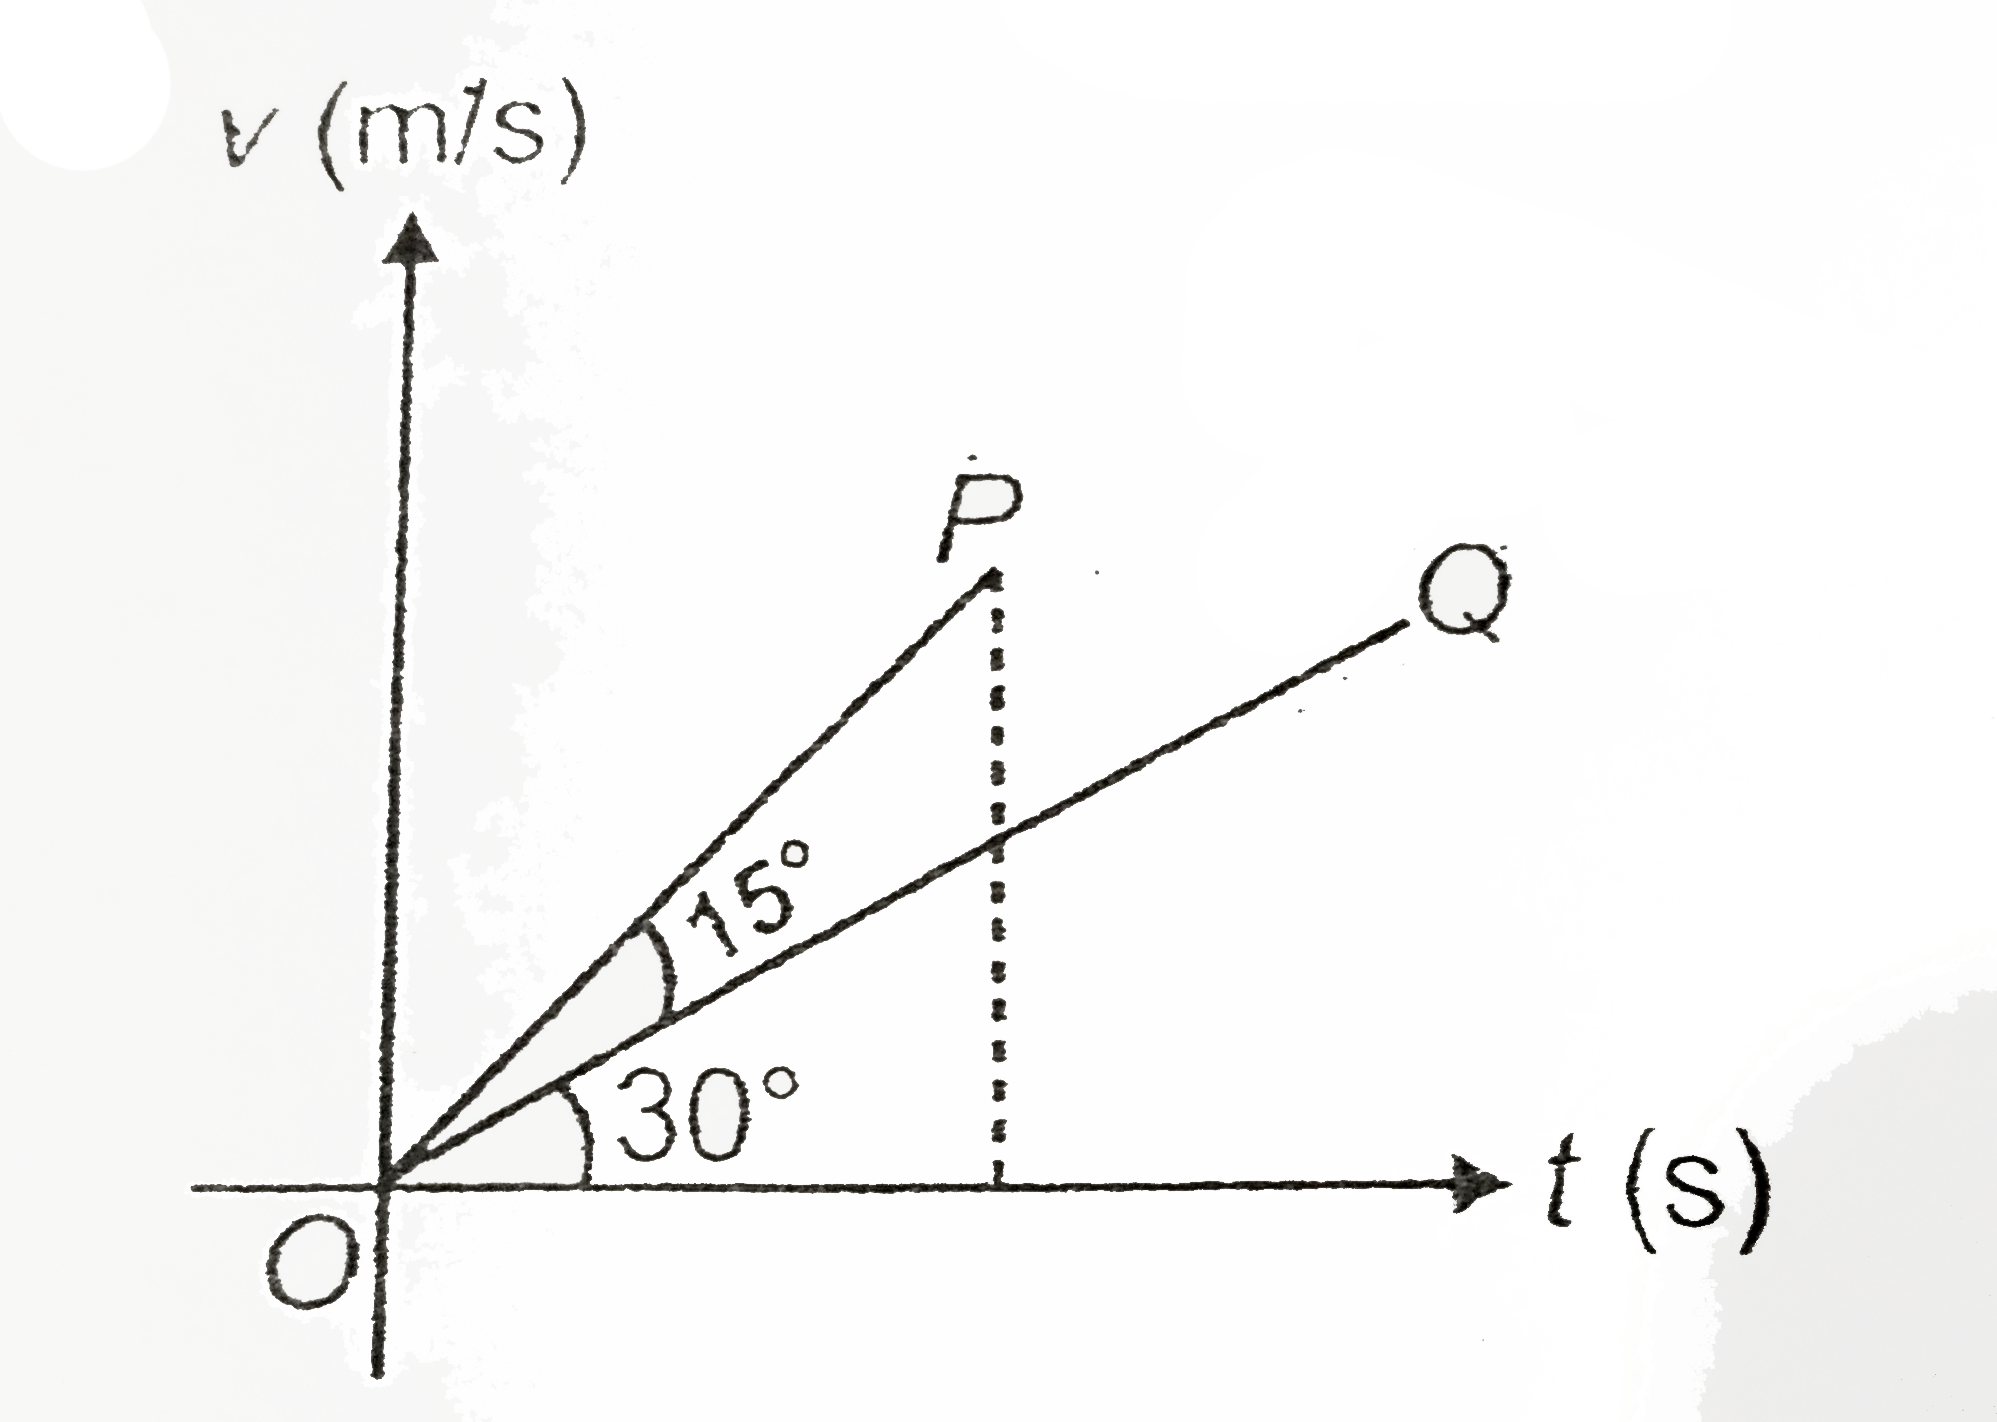
The velocity-time graph for two objects P and Q are shown. The ratio of their respective acceleration is

View SolutionGraphs are very useful to represent a physical situation. Various quantities can be easily represented on graphs and other quantites can be determined from the graph. For example the slope of velocity-time graph represents instantaneous acceleration. For a motion with constant acceleration slope of velocity-time graph is constant. If acceleration is changing with time, slope with change and thus velocity-time graph will be a non-linear curve. Further the area of velocity-time graph gives displacement.
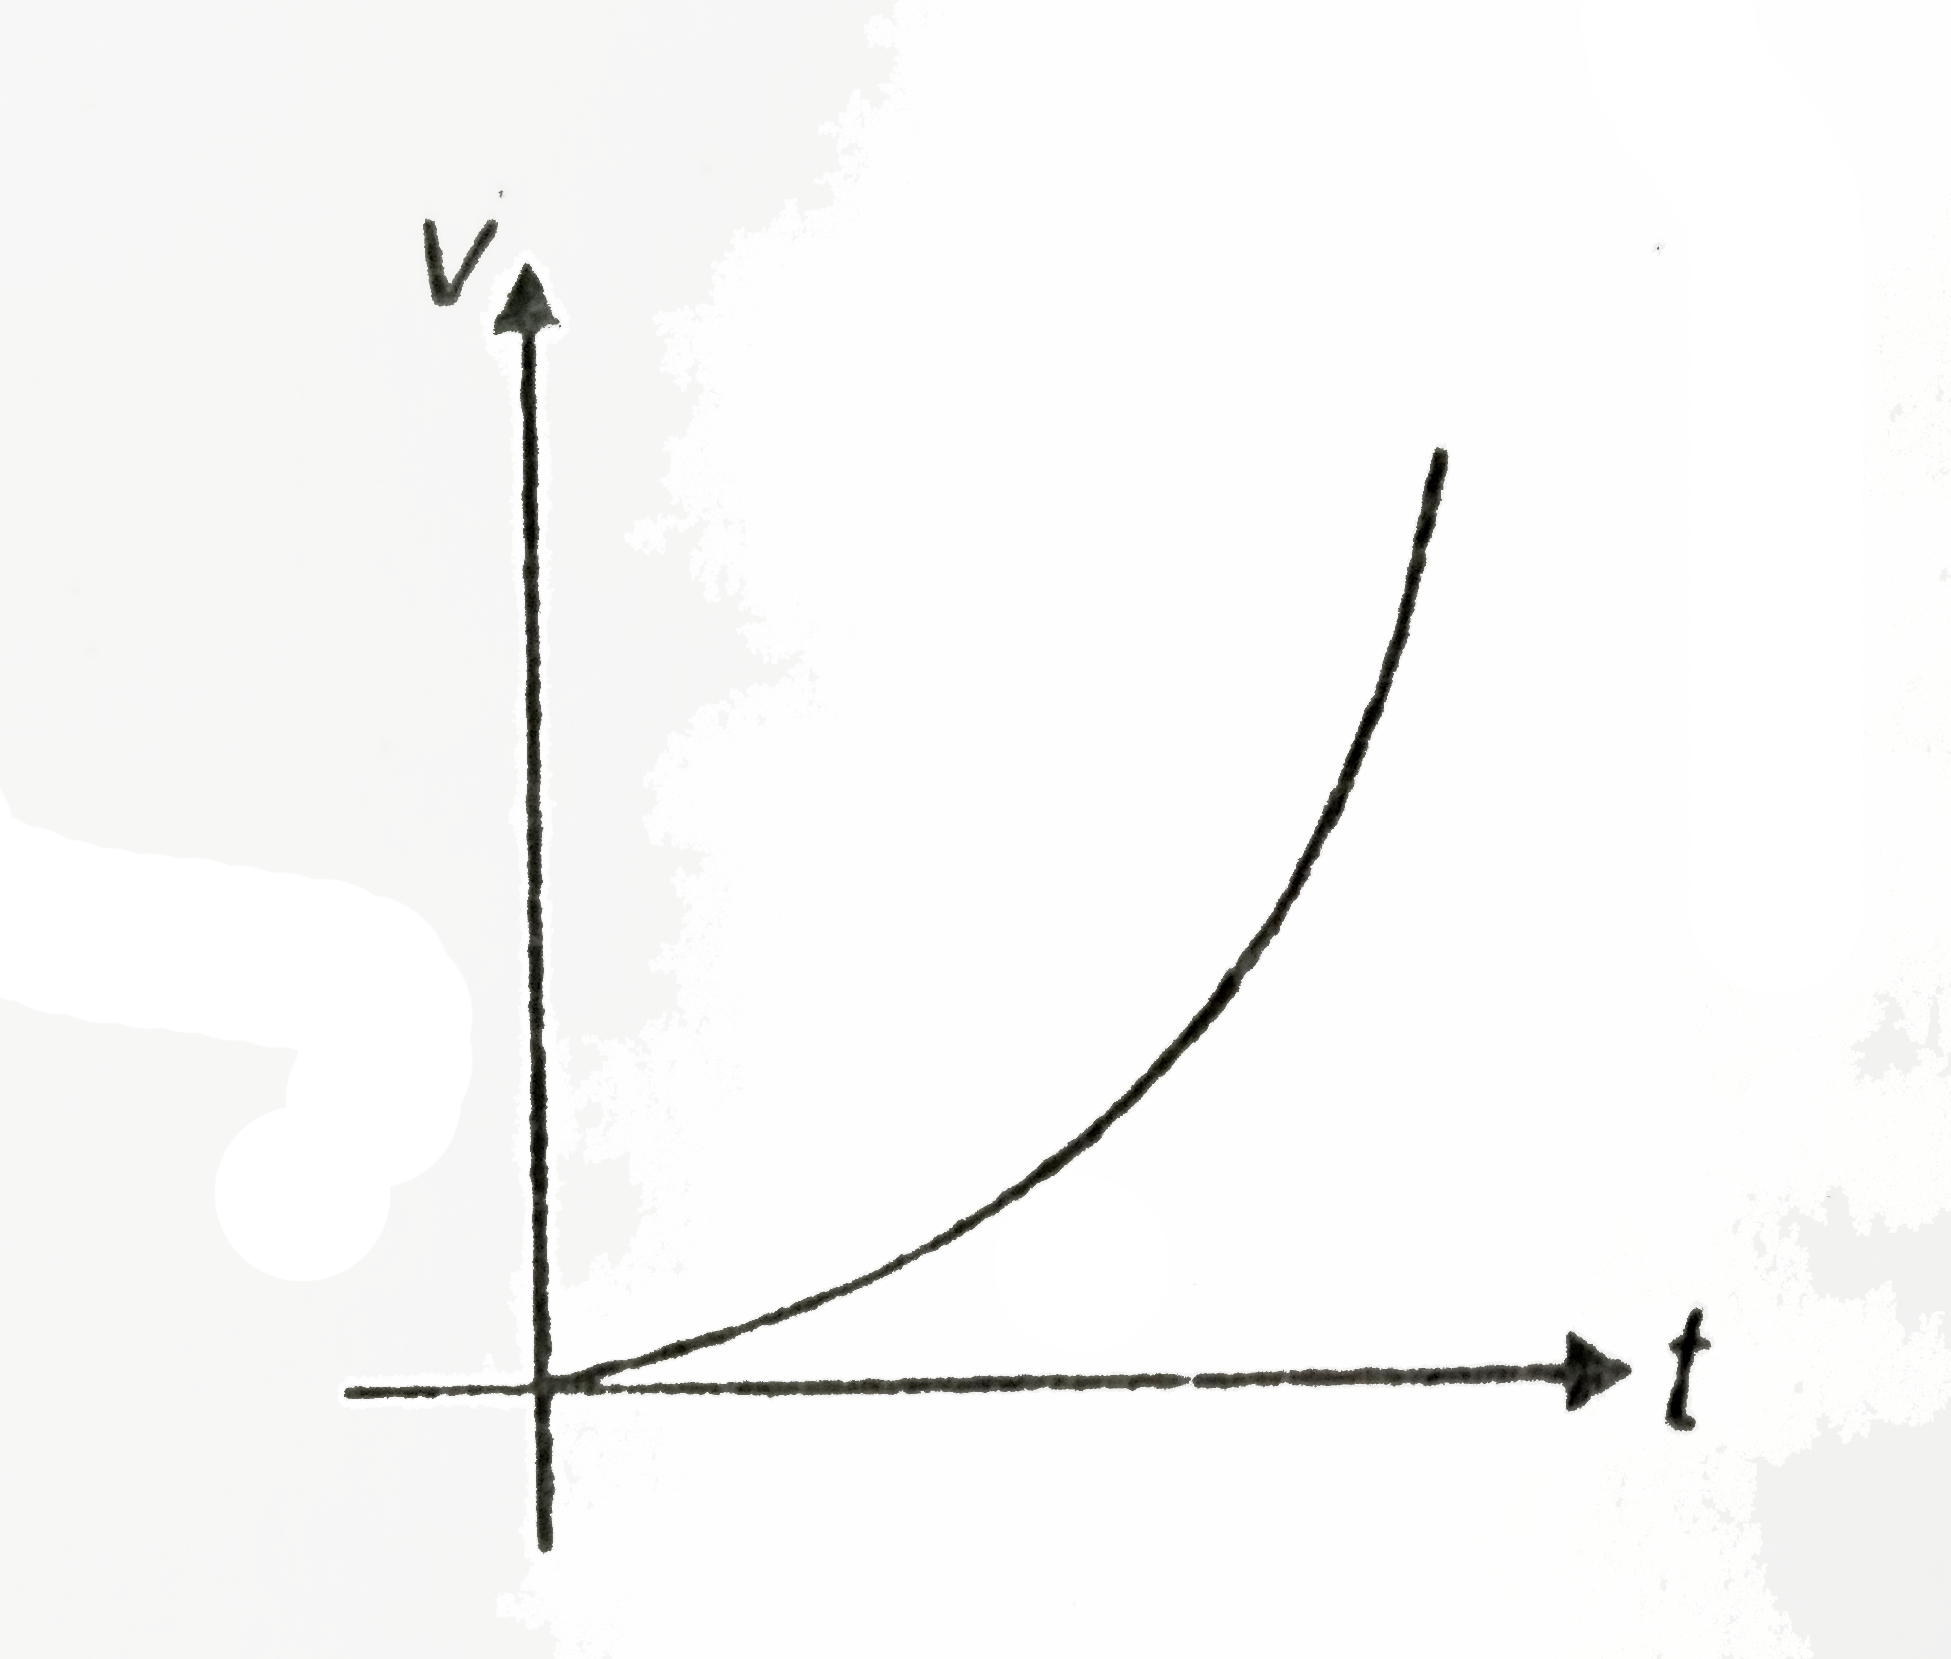
For the given velocity-time graph the possibly correct acceleration-time relationship is

View Solution
