Mention one use of velocity-time curve of an accelerating object.
Step-by-Step Solution:
1. Understanding the Velocity-Time Curve: The velocity-time curve is a graphical representation that shows how the velocity of an object changes over time. The x-axis represents time, while the y-axis represents velocity.
2. Identifying the Relationship: The slope of the velocity-time curve is crucial as it represents the acceleration of the object. Mathematically, acceleration (a) is defined as the rate of change of velocity with respect to time, which can be expressed as:
a=dvdt
Here, dv is the change in velocity, and dt is the change in time.
3. Finding the Slope: To determine the acceleration from the velocity-time curve, we need to find the slope of the curve at a specific point. This can be done by drawing a tangent line to the curve at that point.
4. Calculating the Slope: The slope of the tangent line can be calculated using the formula:
slope=tan(θ)
where θ is the angle that the tangent line makes with the horizontal axis (time axis).
5. Conclusion: One significant use of the velocity-time curve of an accelerating object is to determine the acceleration of the object at any given point in time. By analyzing the slope of the curve, we can gain insights into how quickly the object's velocity is changing.
Final Answer: One use of the velocity-time curve of an accelerating object is to determine the acceleration of the object at any point in time by analyzing the slope of the curve.
---
a=dvdt
Here, dv is the change in velocity, and dt is the change in time.
slope=tan(θ)
where θ is the angle that the tangent line makes with the horizontal axis (time axis).
Topper's Solved these Questions
- MOTION IN A STRAIGHT LINE BOOK - MODERN PUBLICATIONCHAPTER - MOTION IN A STRAIGHT LINE EXERCISE - REVISION EXERCISE (FILL IN THE BLANKS)
10 Videos
- MOTION IN A STRAIGHT LINE BOOK - MODERN PUBLICATIONCHAPTER - MOTION IN A STRAIGHT LINE EXERCISE - REVISION EXERCISE (SHORT ANSWER QUESTIONS)
19 Videos
- MOTION IN A STRAIGHT LINE BOOK - MODERN PUBLICATIONCHAPTER - MOTION IN A STRAIGHT LINE EXERCISE - HIGHER ORDER THINKING SKILL AND ADVANCED LEVEL QUESTION WITH ANSWER
5 Videos
- MOTION IN A PLANE BOOK - MODERN PUBLICATIONCHAPTER - MOTION IN A PLANE EXERCISE - Chapter Practice Test
15 Videos
- OSCILLATIONS BOOK - MODERN PUBLICATIONCHAPTER - OSCILLATIONS EXERCISE - Practice Test (For Board Examination)
12 Videos
Similar Questions
Knowledge Check
Area of velocity - time curve of body gives
Aits initial velocityBits accelerationCits final velocityDdisplacementGraphs are very useful to represent a physical situation. Various quantities can be easily represented on graphs and other quantites can be determined from the graph. For example the slope of velocity-time graph represents instantaneous acceleration. For a motion with constant acceleration slope of velocity-time graph is constant. If acceleration is changing with time, slope with change and thus velocity-time graph will be a non-linear curve. Further the area of velocity-time graph gives displacement.
The average velocity of the car for the entire trip isAv0Bv02Cv03Dv04Graphs are very useful to represent a physical situation. Various quantities can be easily represented on graphs and other quantites can be determined from the graph. For example the slope of velocity-time graph represents instantaneous acceleration. For a motion with constant acceleration slope of velocity-time graph is constant. If acceleration is changing with time, slope with change and thus velocity-time graph will be a non-linear curve. Further the area of velocity-time graph gives displacement.
The correct relation between v0,a1,a2andt0 isAv0=(a1a2a1+a2)t20Bv0=(a1a2a1+a2)t0Cv0=(a1+a22)t0Dv0=√a1a2t0
Draw the velocity-time graph for uniformly accelerated motion. Show that slope of the velocity-time graph gives acceleration of the object.
View SolutionGraphs are very useful to represent a physical situation. Various quantities can be easily represented on graphs and other quantites can be determined from the graph. For example the slope of velocity-time graph represents instantaneous acceleration. For a motion with constant acceleration slope of velocity-time graph is constant. If acceleration is changing with time, slope with change and thus velocity-time graph will be a non-linear curve. Further the area of velocity-time graph gives displacement.
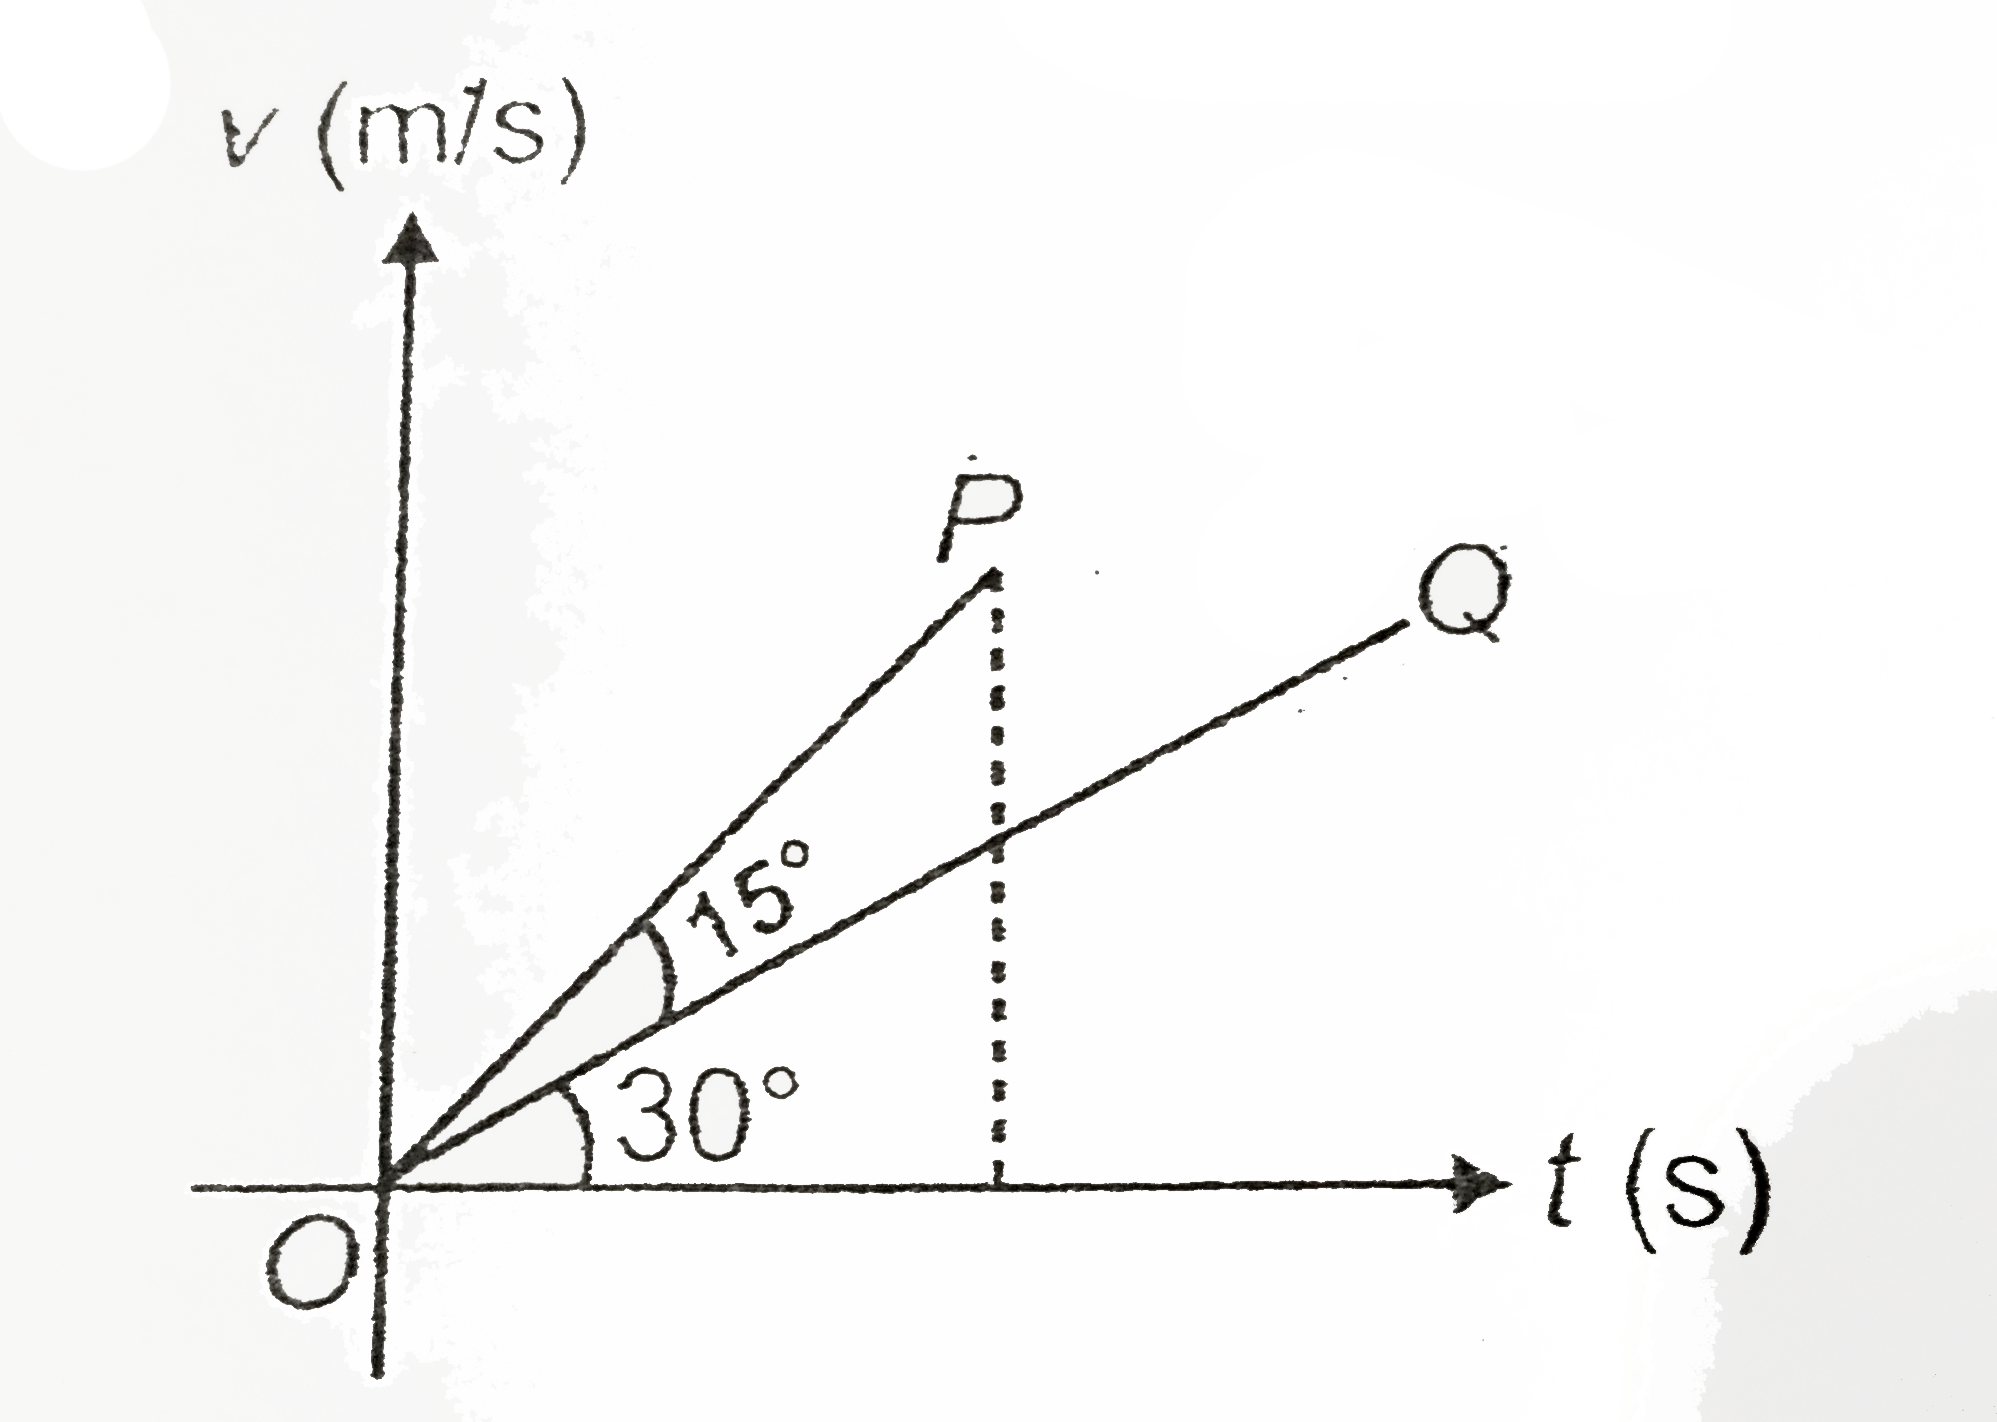
The velocity-time graph for two objects P and Q are shown. The ratio of their respective acceleration is

View SolutionGraphs are very useful to represent a physical situation. Various quantities can be easily represented on graphs and other quantites can be determined from the graph. For example the slope of velocity-time graph represents instantaneous acceleration. For a motion with constant acceleration slope of velocity-time graph is constant. If acceleration is changing with time, slope with change and thus velocity-time graph will be a non-linear curve. Further the area of velocity-time graph gives displacement.
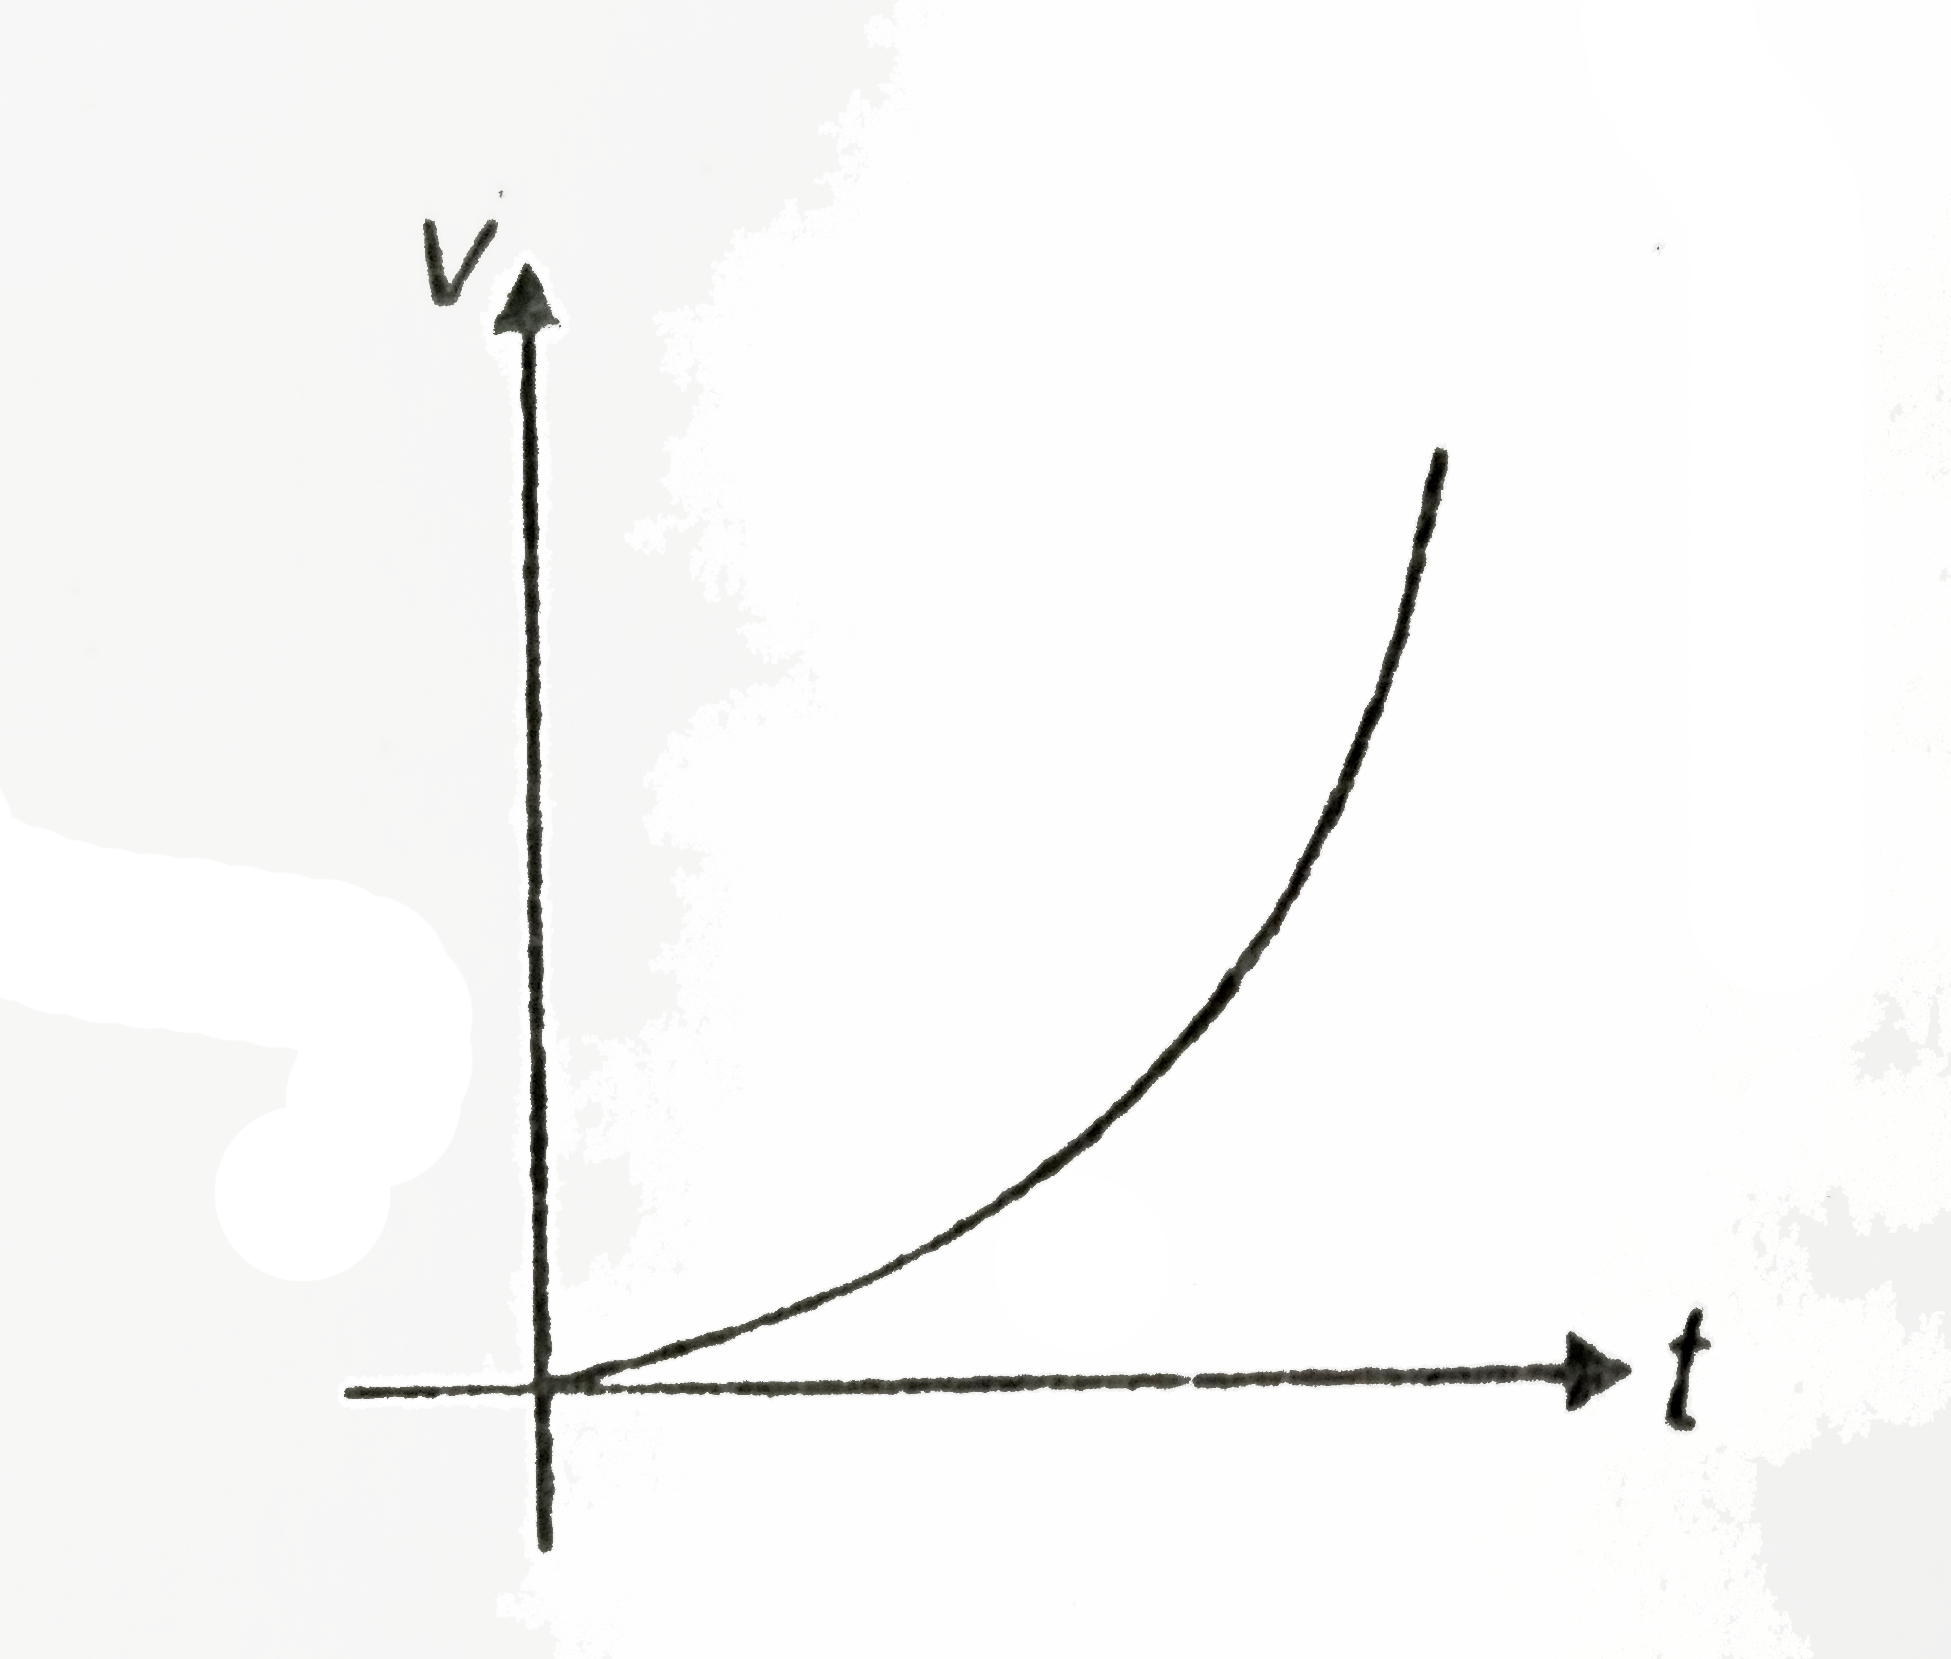
For the given velocity-time graph the possibly correct acceleration-time relationship is

View SolutionGraphs are very useful to represent a physical situation. Various quantities can be easily represented on graphs and other quantites can be determined from the graph. For example the slope of velocity-time graph represents instantaneous acceleration. For a motion with constant acceleration slope of velocity-time graph is constant. If acceleration is changing with time, slope with change and thus velocity-time graph will be a non-linear curve. Further the area of velocity-time graph gives displacement.
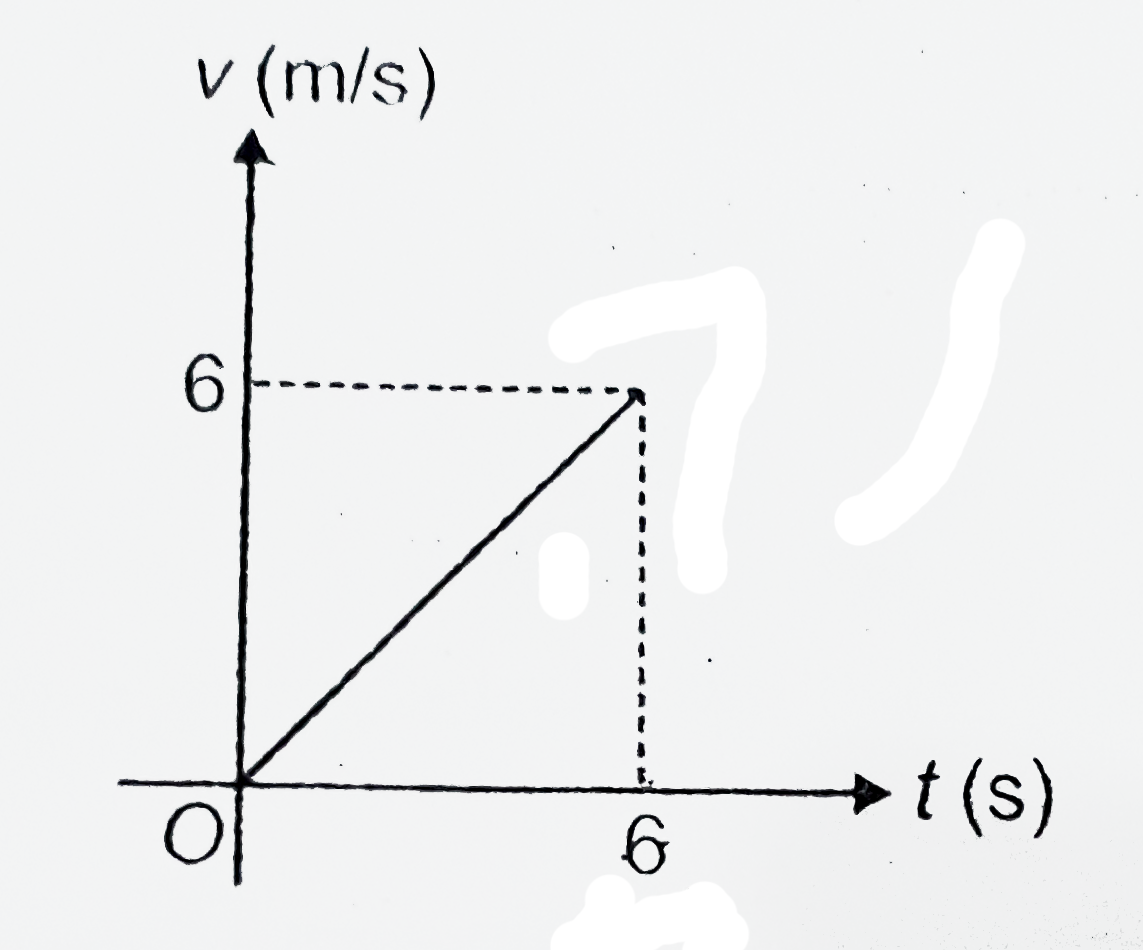
For the given velocity-time graph the fisplacement of the object vetween t = 2 s to t = 4 s is

View SolutionGraphs are very useful to represent a physical situation. Various quantities can be easily represented on graphs and other quantites can be determined from the graph. For example the slope of velocity-time graph represents instantaneous acceleration. For a motion with constant acceleration slope of velocity-time graph is constant. If acceleration is changing with time, slope with change and thus velocity-time graph will be a non-linear curve. Further the area of velocity-time graph gives displacement.
For the above situation let t1 be the time of accelerated motion and t2 be the time or retarded motion, then the correct relation is
View Solution
