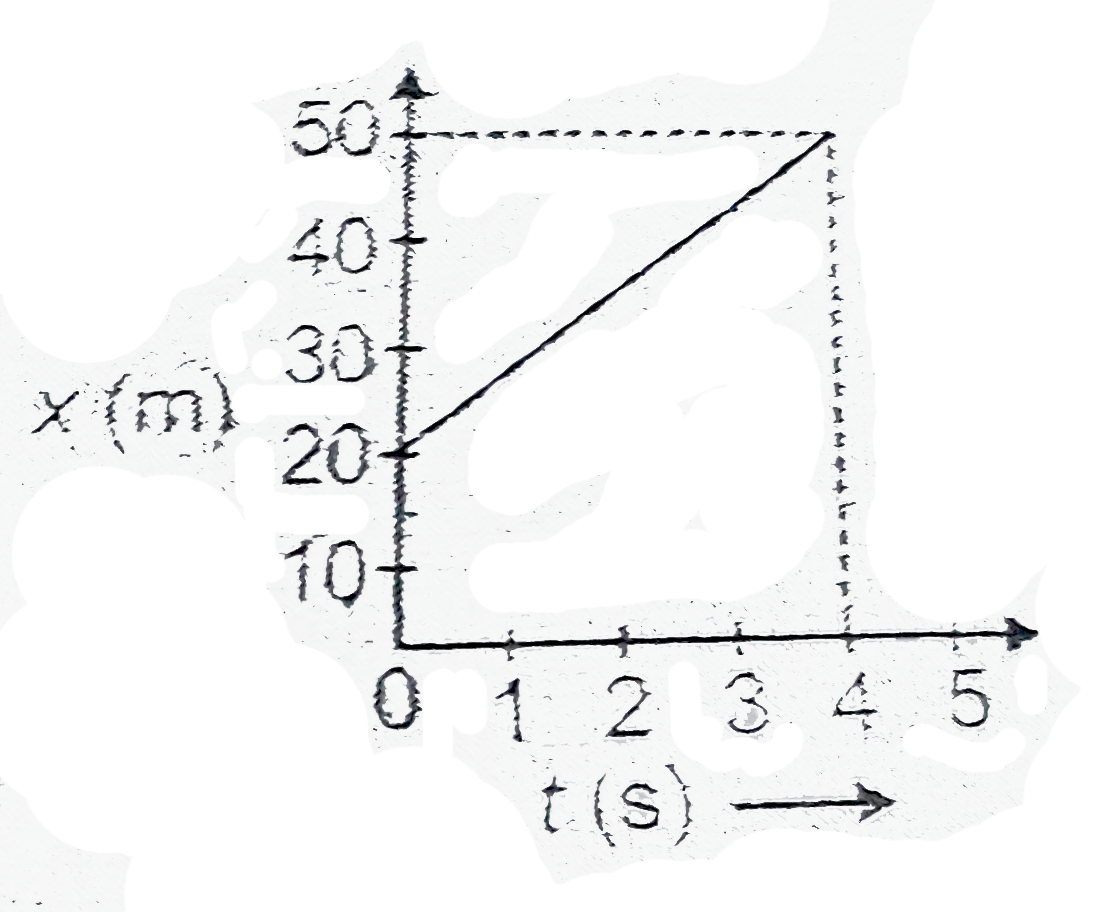
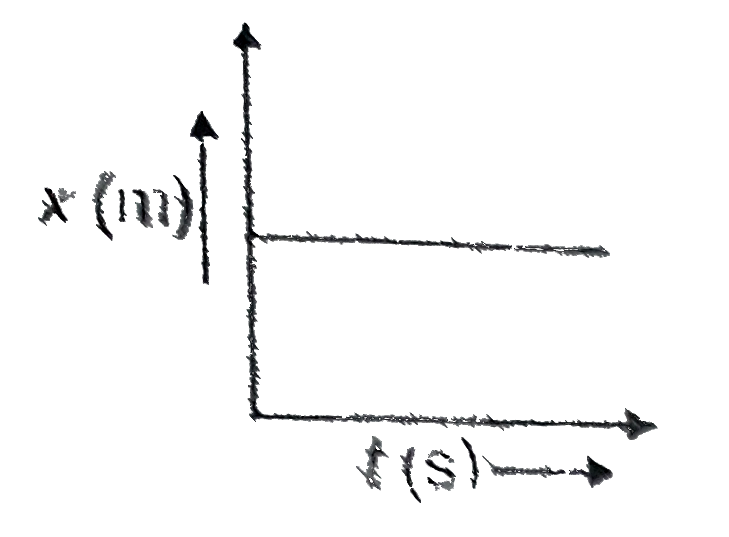
Draw the position-time graph for an object in uniform motion. Show that the slope of the position-time graph gives the velocity of the object.
To solve the problem, we will follow these steps:
Step 1: Understand Uniform Motion
Uniform motion means that an object moves with a constant velocity. This implies that the position of the object changes by equal distances in equal intervals of time.
Step 2: Draw the Position-Time Graph
1. Axes: Draw a Cartesian plane. Label the horizontal axis as "Time (T)" and the vertical axis as "Position (S)".
2. Origin: Start at the origin (0,0), where the object is at position S=0 at time T=0.
3. Straight Line: Since the object is in uniform motion, plot points at equal intervals of time with equal increments in position. Connect these points with a straight line. This line will have a constant slope.
Step 3: Identify Points on the Graph
- Let’s choose two points on the line: Point A at (T1, S1) and Point B at (T2, S2).
- Here, T1 and T2 are two different times, and S1 and S2 are the corresponding positions.
Step 4: Calculate the Slope of the Graph
The slope of the position-time graph can be calculated using the formula:
Slope=Change in PositionChange in Time=S2−S1T2−T1
This slope represents the velocity of the object.
Step 5: Relate Slope to Velocity
- The slope calculated above is equal to the average velocity of the object between the two points A and B.
- Since the motion is uniform, the average velocity is constant and equal to the slope of the line.
Conclusion
Thus, we have shown that for an object in uniform motion, the slope of the position-time graph gives the velocity of the object.
---
Uniform motion means that an object moves with a constant velocity. This implies that the position of the object changes by equal distances in equal intervals of time.
1. Axes: Draw a Cartesian plane. Label the horizontal axis as "Time (T)" and the vertical axis as "Position (S)".
2. Origin: Start at the origin (0,0), where the object is at position S=0 at time T=0.
3. Straight Line: Since the object is in uniform motion, plot points at equal intervals of time with equal increments in position. Connect these points with a straight line. This line will have a constant slope.
- Let’s choose two points on the line: Point A at (T1, S1) and Point B at (T2, S2).
- Here, T1 and T2 are two different times, and S1 and S2 are the corresponding positions.
The slope of the position-time graph can be calculated using the formula:
Slope=Change in PositionChange in Time=S2−S1T2−T1
This slope represents the velocity of the object.
- The slope calculated above is equal to the average velocity of the object between the two points A and B.
- Since the motion is uniform, the average velocity is constant and equal to the slope of the line.
Thus, we have shown that for an object in uniform motion, the slope of the position-time graph gives the velocity of the object.
Topper's Solved these Questions
Similar Questions
Draw the velocity-time graph for an object in uniform motion. Show that the area under the velocity-time graph gives the displacement of the object in the given time interval.
View SolutionDraw the x-t graph of an object in uniform motion.
View SolutionDraw the position-time graph of a stationary object.
View SolutionDraw the velocity-time graph for uniformly accelerated motion. Show that slope of the velocity-time graph gives acceleration of the object.
View SolutionThe position-time graph of an object is given below. What is the velocity of the object?

View SolutionThe position-time graph of an object is given below. What is the velocity of the object?

View SolutionWrite some uses of velocity-time graph of an object in uniform motion.
View SolutionShow that the slope of displacement-time graph is equal to the velcoity of unitorm motion.
View SolutionThe position - time graph of an object is given below. What is the velocity of the object?

View SolutionThe position - time graph of an object is given below. What is the velocity of the object?

View Solution
