What does the slope of velocity-time graph represent ?
To determine what the slope of a velocity-time graph represents, we can follow these steps:
1. Understanding the Graph:
- A velocity-time graph plots velocity (y-axis) against time (x-axis). The graph can show various types of motion, including uniform and non-uniform motion.
2. Identifying Points on the Graph:
- Select two points on the graph: Point 1 at time T1 with velocity V1 and Point 2 at time T2 with velocity V2.
3. Calculating the Slope:
- The slope of the graph between these two points can be calculated using the formula for slope:
slope=change in velocitychange in time=V2−V1T2−T1
- Here, V2−V1 represents the change in velocity (ΔV), and T2−T1 represents the change in time (ΔT).
4. Relating Slope to Acceleration:
- The formula for slope can be rewritten as:
slope=ΔVΔT
- This expression represents the definition of acceleration, which is the rate of change of velocity with respect to time.
5. Conclusion:
- Therefore, the slope of the velocity-time graph represents the acceleration of the object. If the slope is positive, the object is accelerating; if the slope is negative, the object is decelerating; and if the slope is zero, the object is moving at a constant velocity.
- A velocity-time graph plots velocity (y-axis) against time (x-axis). The graph can show various types of motion, including uniform and non-uniform motion.
- Select two points on the graph: Point 1 at time T1 with velocity V1 and Point 2 at time T2 with velocity V2.
- The slope of the graph between these two points can be calculated using the formula for slope:
slope=change in velocitychange in time=V2−V1T2−T1
- Here, V2−V1 represents the change in velocity (ΔV), and T2−T1 represents the change in time (ΔT).
- The formula for slope can be rewritten as:
slope=ΔVΔT
- This expression represents the definition of acceleration, which is the rate of change of velocity with respect to time.
- Therefore, the slope of the velocity-time graph represents the acceleration of the object. If the slope is positive, the object is accelerating; if the slope is negative, the object is decelerating; and if the slope is zero, the object is moving at a constant velocity.
Topper's Solved these Questions
Similar Questions
What does the slope of a work-time graph represent?
View SolutionGraphs are very useful to represent a physical situation. Various quantities can be easily represented on graphs and other quantites can be determined from the graph. For example the slope of velocity-time graph represents instantaneous acceleration. For a motion with constant acceleration slope of velocity-time graph is constant. If acceleration is changing with time, slope with change and thus velocity-time graph will be a non-linear curve. Further the area of velocity-time graph gives displacement.
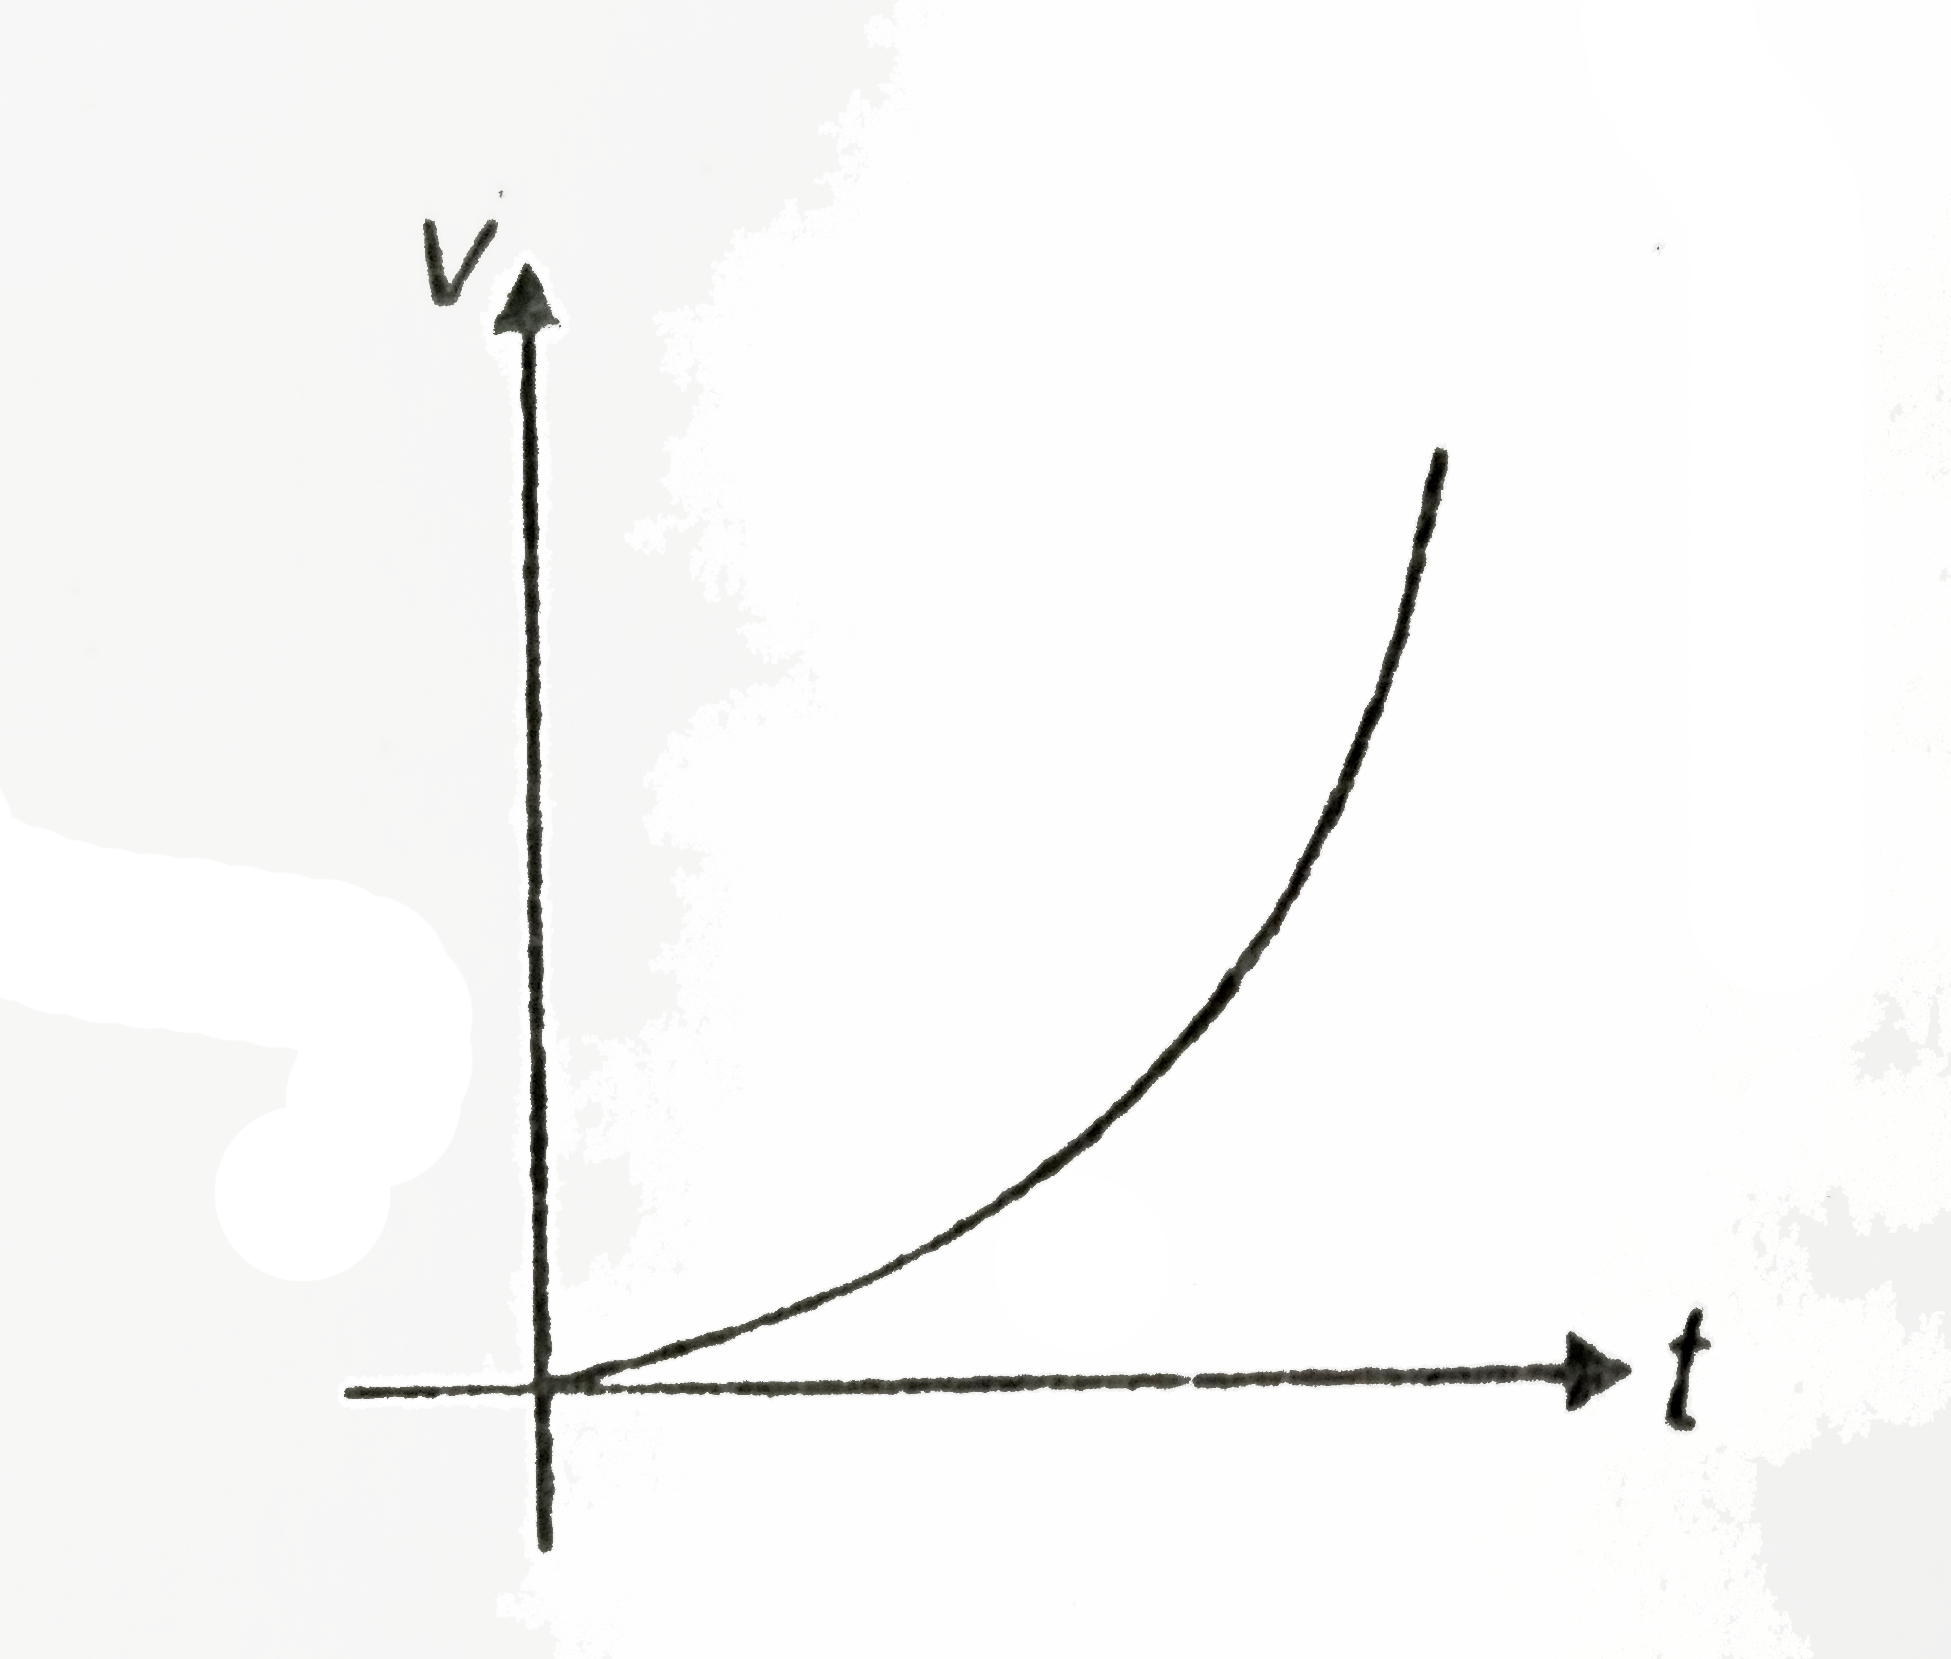
For the given velocity-time graph the possibly correct acceleration-time relationship is

View Solution
Knowledge Check
Graphs are very useful to represent a physical situation. Various quantities can be easily represented on graphs and other quantites can be determined from the graph. For example the slope of velocity-time graph represents instantaneous acceleration. For a motion with constant acceleration slope of velocity-time graph is constant. If acceleration is changing with time, slope with change and thus velocity-time graph will be a non-linear curve. Further the area of velocity-time graph gives displacement.
The average velocity of the car for the entire trip isAv0Bv02Cv03Dv04Graphs are very useful to represent a physical situation. Various quantities can be easily represented on graphs and other quantites can be determined from the graph. For example the slope of velocity-time graph represents instantaneous acceleration. For a motion with constant acceleration slope of velocity-time graph is constant. If acceleration is changing with time, slope with change and thus velocity-time graph will be a non-linear curve. Further the area of velocity-time graph gives displacement.
The correct relation between v0,a1,a2andt0 isAv0=(a1a2a1+a2)t20Bv0=(a1a2a1+a2)t0Cv0=(a1+a22)t0Dv0=√a1a2t0Graphs are very useful to represent a physical situation. Various quantities can be easily represented on graphs and other quantites can be determined from the graph. For example the slope of velocity-time graph represents instantaneous acceleration. For a motion with constant acceleration slope of velocity-time graph is constant. If acceleration is changing with time, slope with change and thus velocity-time graph will be a non-linear curve. Further the area of velocity-time graph gives displacement.
For the above situation let t1 be the time of accelerated motion and t2 be the time or retarded motion, then the correct relation isAa1t2=a2t1Ba1t1=a2t2Ca1t21=a2t22Da1t22=a2t21
Graphs are very useful to represent a physical situation. Various quantities can be easily represented on graphs and other quantites can be determined from the graph. For example the slope of velocity-time graph represents instantaneous acceleration. For a motion with constant acceleration slope of velocity-time graph is constant. If acceleration is changing with time, slope with change and thus velocity-time graph will be a non-linear curve. Further the area of velocity-time graph gives displacement.
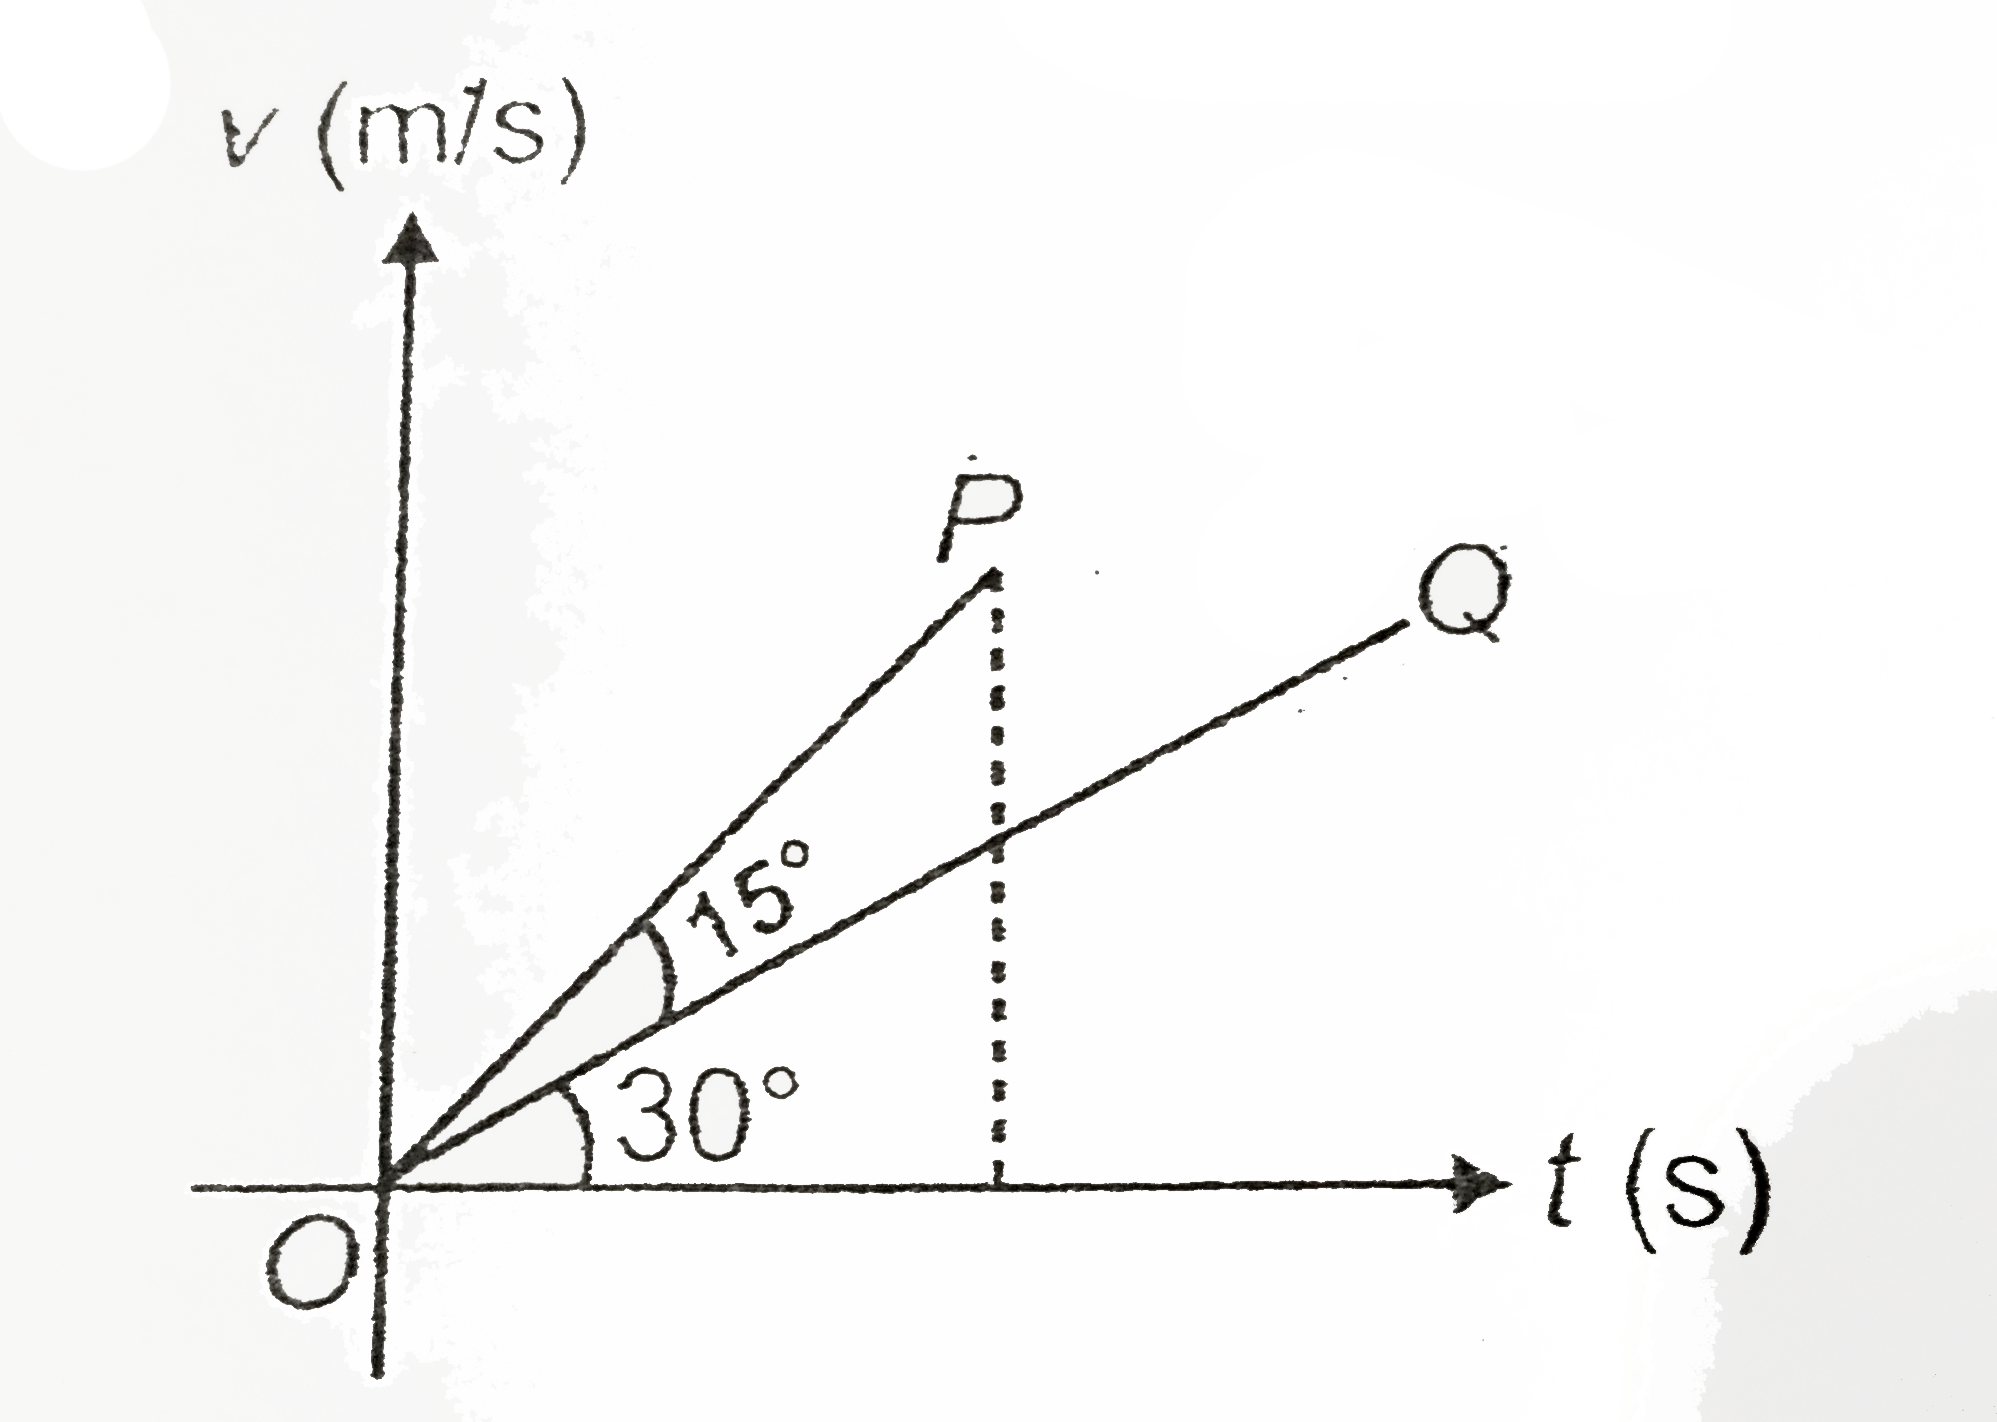
The velocity-time graph for two objects P and Q are shown. The ratio of their respective acceleration is

View SolutionGraphs are very useful to represent a physical situation. Various quantities can be easily represented on graphs and other quantites can be determined from the graph. For example the slope of velocity-time graph represents instantaneous acceleration. For a motion with constant acceleration slope of velocity-time graph is constant. If acceleration is changing with time, slope with change and thus velocity-time graph will be a non-linear curve. Further the area of velocity-time graph gives displacement.
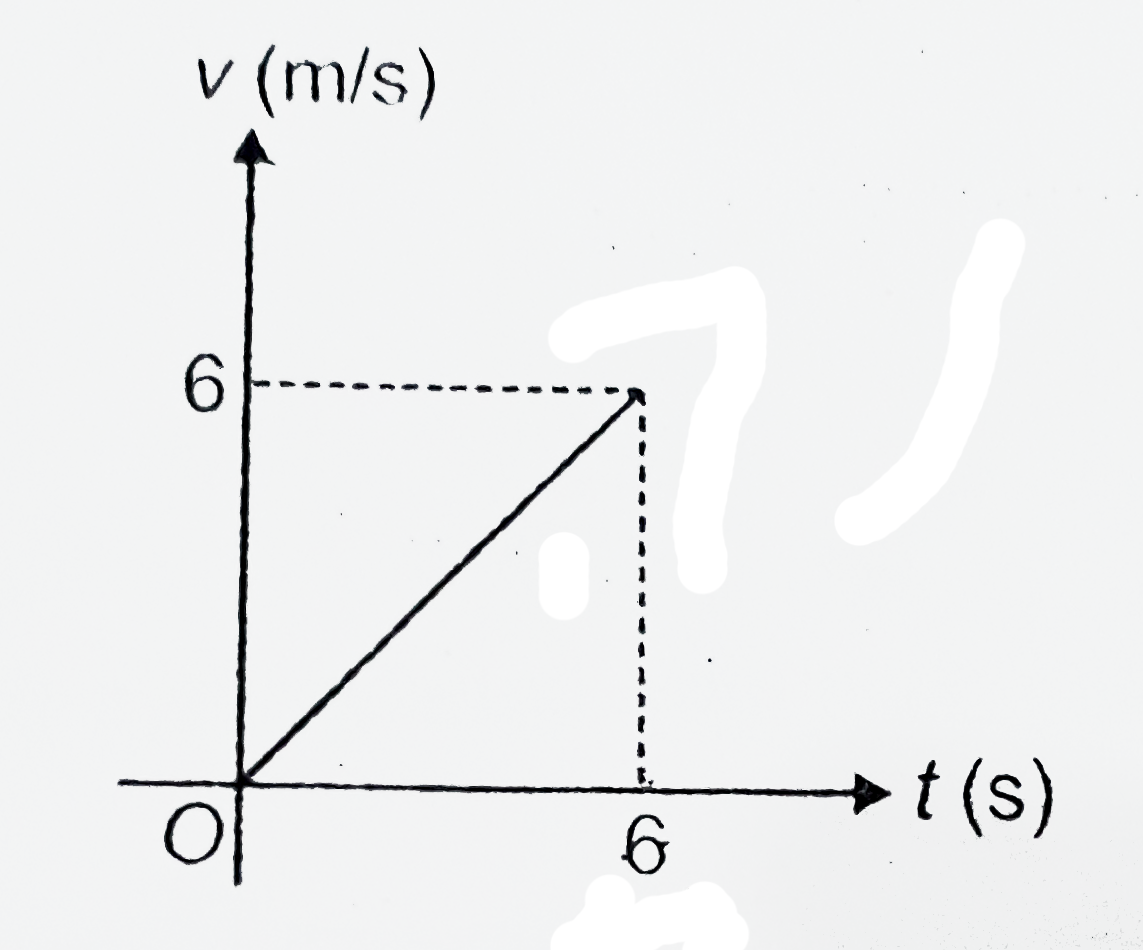
For the given velocity-time graph the fisplacement of the object vetween t = 2 s to t = 4 s is

View Solutionwhat does slope of prosition-time graph represeent for a unitorm motion?
View SolutionWhat does the slope of a displacement-tine graph represent? Can displacement-time graph be parallel to the displacement axis? Give reason for your answer.
View SolutionGraphs are very useful to represent a physical situation. Various quantities can be easily represented on graphs and other quantites can be determined from the graph. For example the slope of velocity-time graph represents instantaneous acceleration. For a motion with constant acceleration slope of velocity-time graph is constant. If acceleration is changing with time, slope with change and thus velocity-time graph will be a non-linear curve. Further the area of velocity-time graph gives displacement.
A car starts from rest with a constant acceleration a1 for some time and attains a velocity v0. Then it immediately retards at a constant rate a2 to rest. The total time to journey is t0 Identify the correct velocity-time graph
View Solution

