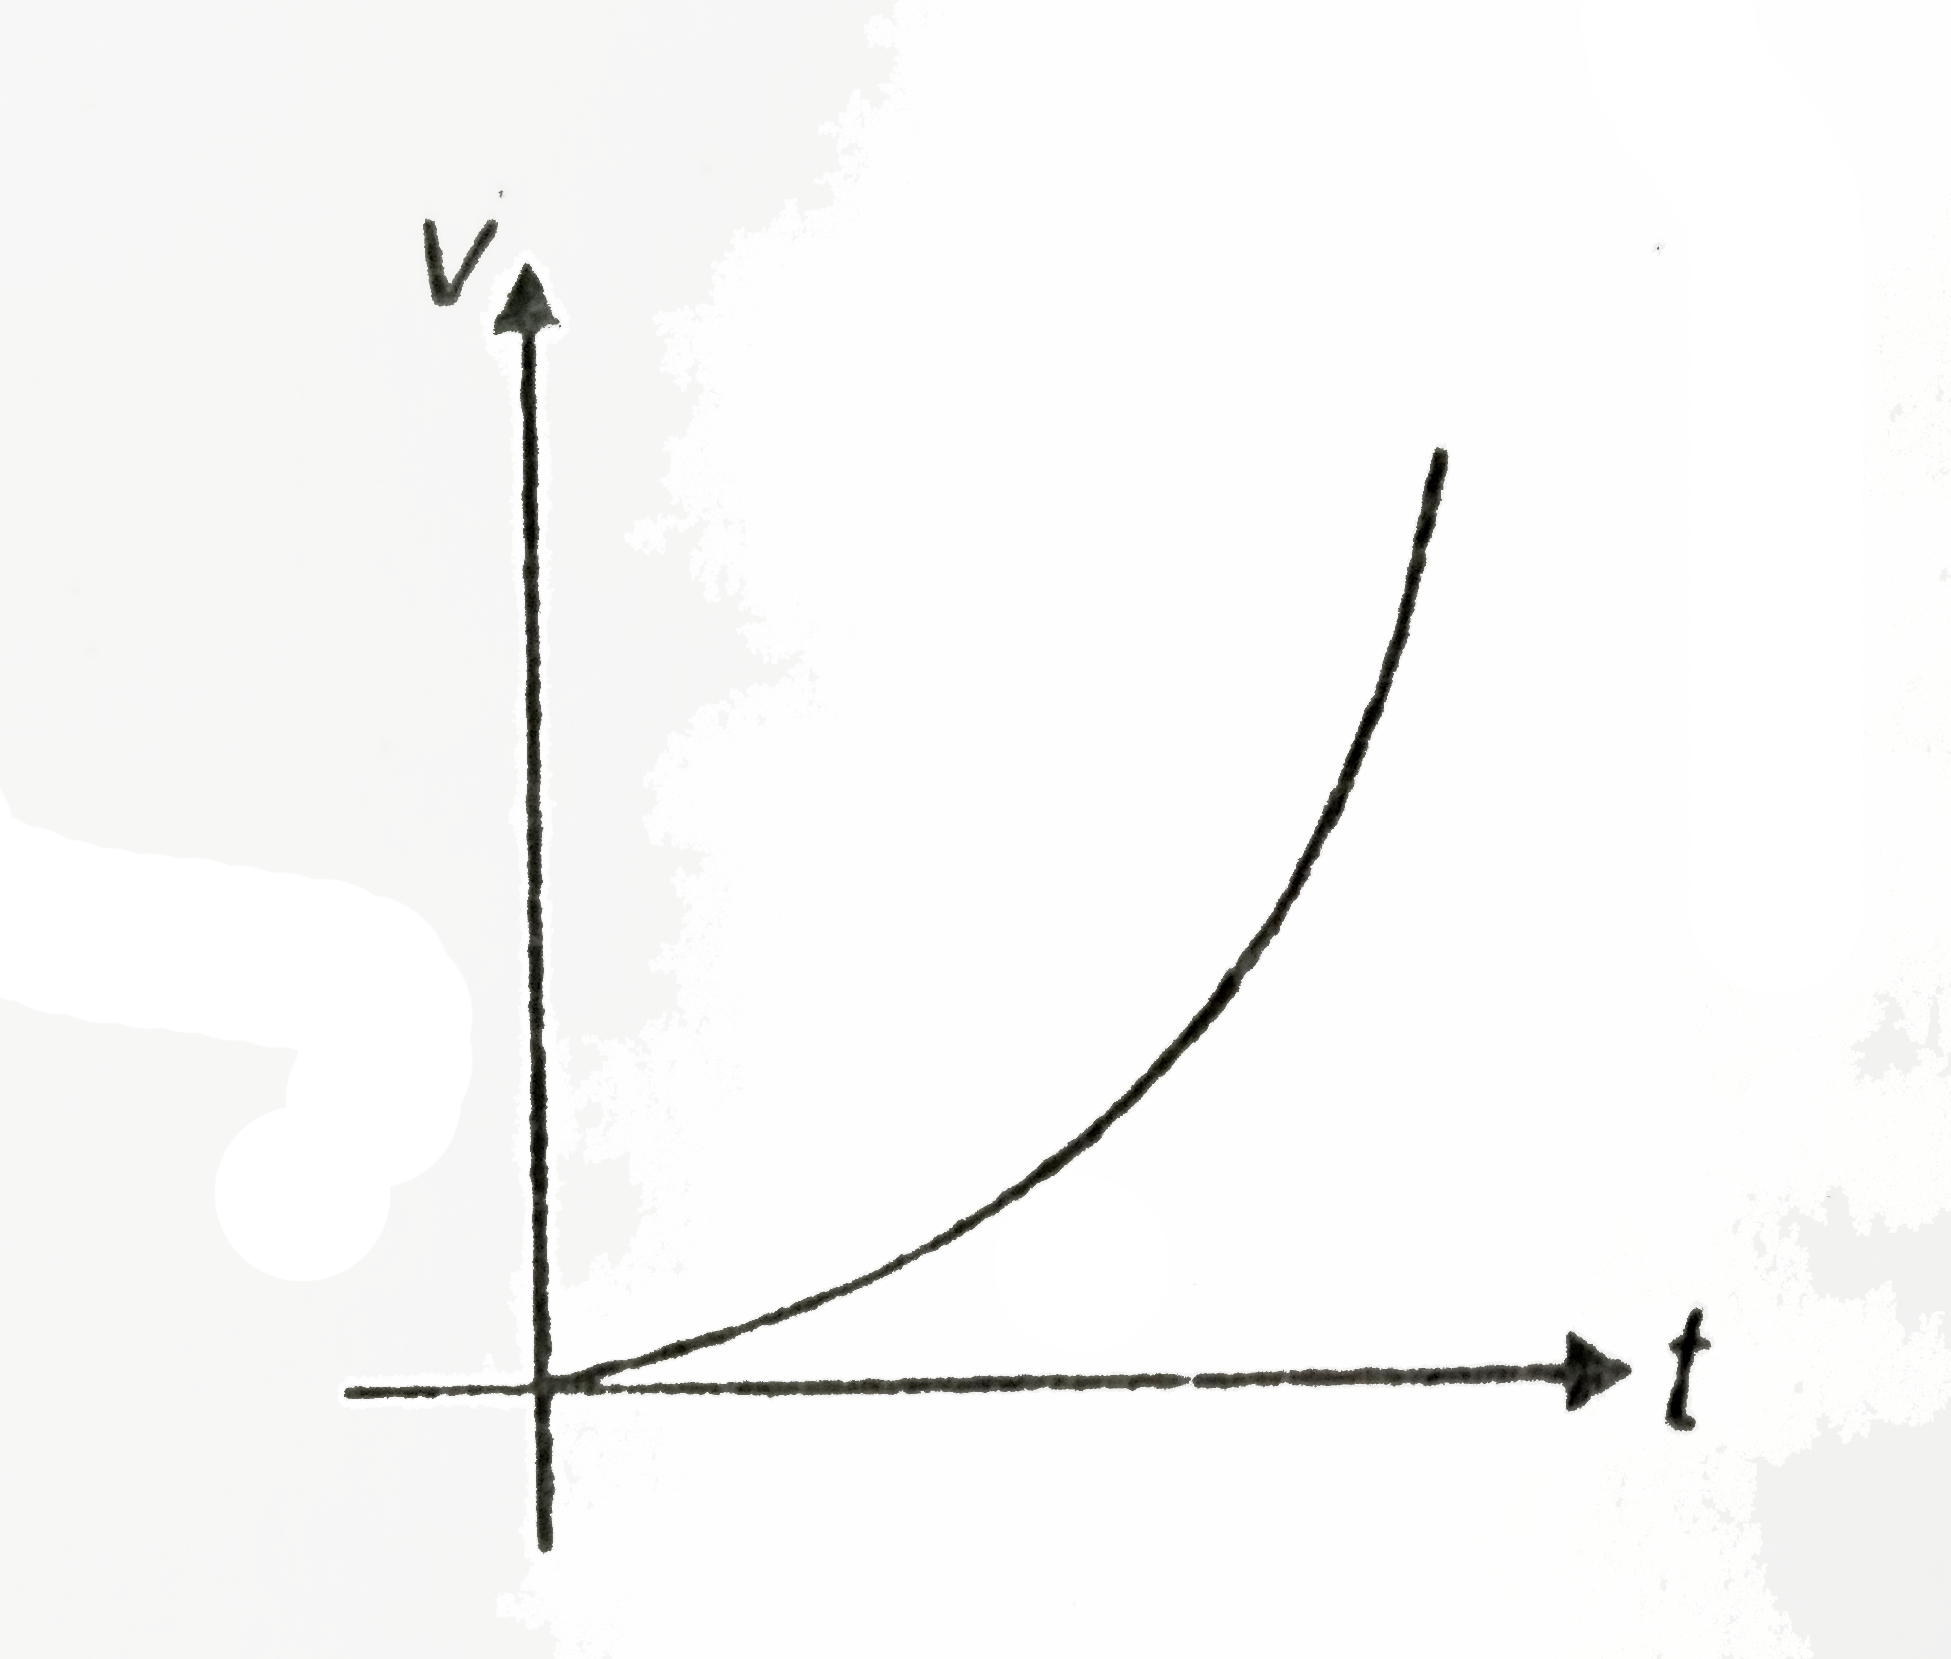
What does the slope of a work-time graph represent?
To determine what the slope of a work-time graph represents, we can follow these steps:
1. Understanding the Graph: A work-time graph plots work done (W) on the y-axis against time (t) on the x-axis.
2. Identifying the Slope: The slope of a graph is defined as the change in the y-axis variable divided by the change in the x-axis variable. In this case, the slope (m) can be expressed mathematically as:
slope=ΔWΔt
where ΔW is the change in work done and Δt is the change in time.
3. Relating Slope to Power: The slope dWdt represents the rate at which work is done over time. This is directly related to the concept of power in physics.
4. Defining Power: Power (P) is defined as the rate of doing work. Mathematically, instantaneous power can be expressed as:
P=dWdt
where P is the instantaneous power, dW is the infinitesimal work done, and dt is the infinitesimal time interval.
5. Conclusion: Therefore, the slope of a work-time graph represents instantaneous power.
Final Answer:
The slope of a work-time graph represents instantaneous power.
---
slope=ΔWΔt
where ΔW is the change in work done and Δt is the change in time.
P=dWdt
where P is the instantaneous power, dW is the infinitesimal work done, and dt is the infinitesimal time interval.
The slope of a work-time graph represents instantaneous power.
Similar Questions
Knowledge Check
What does the slope of a speed-time graph indicate ?
ASpeedBAccelerationCvelocityDnone of the aboveWhat does the slope of a distance-time graph indicate ?
ASpeedBAccelerationCvelocityDnone of the above
What does the slope of a speed-time graph indicate ?
View SolutionWhat does the slope of a speed-time graph indicate ?
View SolutionWhat does the slope of a displacement-tine graph represent? Can displacement-time graph be parallel to the displacement axis? Give reason for your answer.
View SolutionWhat does the slope of displacement-time graph give?
View SolutionWhat does negative slope of a position-time graph signify?
View SolutionGraphs are very useful to represent a physical situation. Various quantities can be easily represented on graphs and other quantites can be determined from the graph. For example the slope of velocity-time graph represents instantaneous acceleration. For a motion with constant acceleration slope of velocity-time graph is constant. If acceleration is changing with time, slope with change and thus velocity-time graph will be a non-linear curve. Further the area of velocity-time graph gives displacement.
For the given velocity-time graph the possibly correct acceleration-time relationship is

View Solution

