Of the following the graph that better represents the variation of frequency 'v' of a vibrating string with the square root of tension is
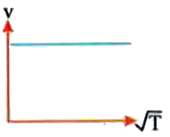
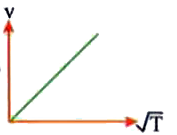
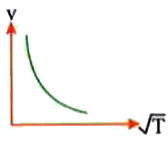
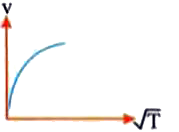
The correct Answer is:B
To solve the problem of how the frequency ν of a vibrating string varies with the square root of tension √T, we can follow these steps:
Step 1: Understand the formula for frequency
The frequency ν of a vibrating string is given by the formula:
ν=12L√Tμ
where:
- L is the length of the string,
- T is the tension in the string,
- μ is the mass per unit length of the string.
Step 2: Isolate the variables
If we keep L and μ constant, we can rewrite the equation as:
ν=C√T
where C=12L√1μ is a constant.
Step 3: Relate frequency to square root of tension
From the equation ν=C√T, we see that frequency ν is directly proportional to the square root of tension √T. This means that if we plot ν on the y-axis and √T on the x-axis, we should get a straight line passing through the origin.
Step 4: Identify the graph
The graph that represents this relationship will be a straight line with a positive slope, indicating that as the square root of tension increases, the frequency also increases linearly.
Conclusion
The correct graph that represents the variation of frequency ν with the square root of tension √T is a straight line starting from the origin.
---
The frequency ν of a vibrating string is given by the formula:
ν=12L√Tμ
where:
- L is the length of the string,
- T is the tension in the string,
- μ is the mass per unit length of the string.
If we keep L and μ constant, we can rewrite the equation as:
ν=C√T
where C=12L√1μ is a constant.
From the equation ν=C√T, we see that frequency ν is directly proportional to the square root of tension √T. This means that if we plot ν on the y-axis and √T on the x-axis, we should get a straight line passing through the origin.
The graph that represents this relationship will be a straight line with a positive slope, indicating that as the square root of tension increases, the frequency also increases linearly.
The correct graph that represents the variation of frequency ν with the square root of tension √T is a straight line starting from the origin.
Topper's Solved these Questions
- WAVESBook:NARAYNAChapter:WAVESExercise:Exercise-III
Explore 56 Videos
- WAVESBook:NARAYNAChapter:WAVESExercise:Exercise-IV
Explore 56 Videos
- WAVESBook:NARAYNAChapter:WAVESExercise:Exercise-II (C.W)
Explore 15 Videos
- VECTORSBook:NARAYNAChapter:VECTORSExercise:LEVEL-II (H.W)
Explore 14 Videos
- WORK , ENERGY & POWER Book:NARAYNAChapter:WORK , ENERGY & POWER Exercise:EXERCISE IV
Explore 43 Videos
Similar Questions
Knowledge Check
Which of the following graphs represents the variation of activity (A) of a radioactive substance with time (t).
A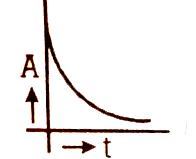 B
B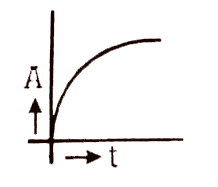 C
C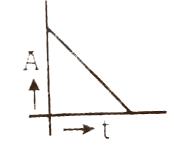 D
D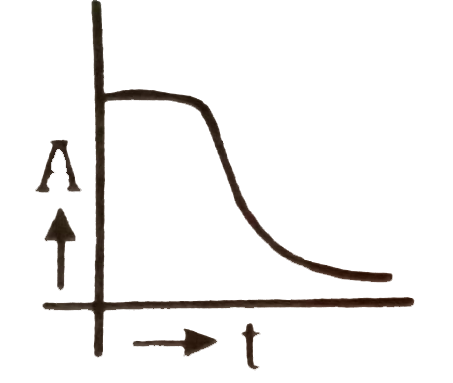
At a constant pressure, of the following graphs that one which represents the variation of the density of an ideal gas with the absolute temperature T, is
A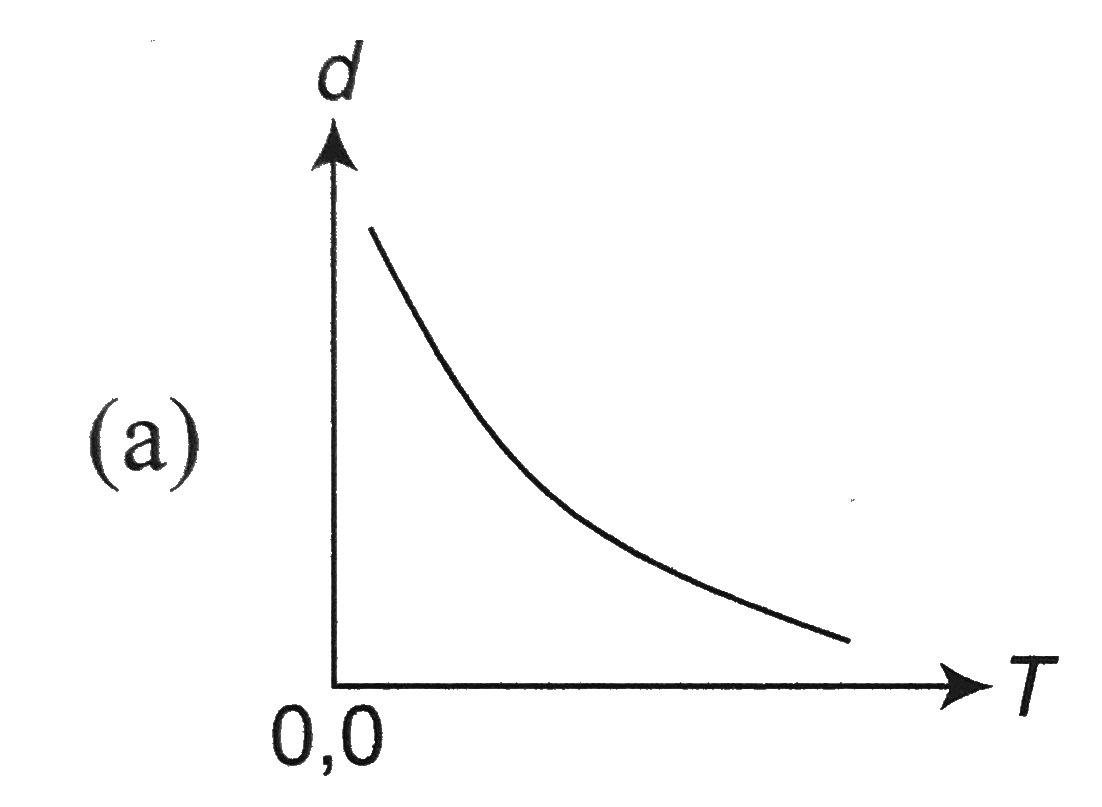 B
B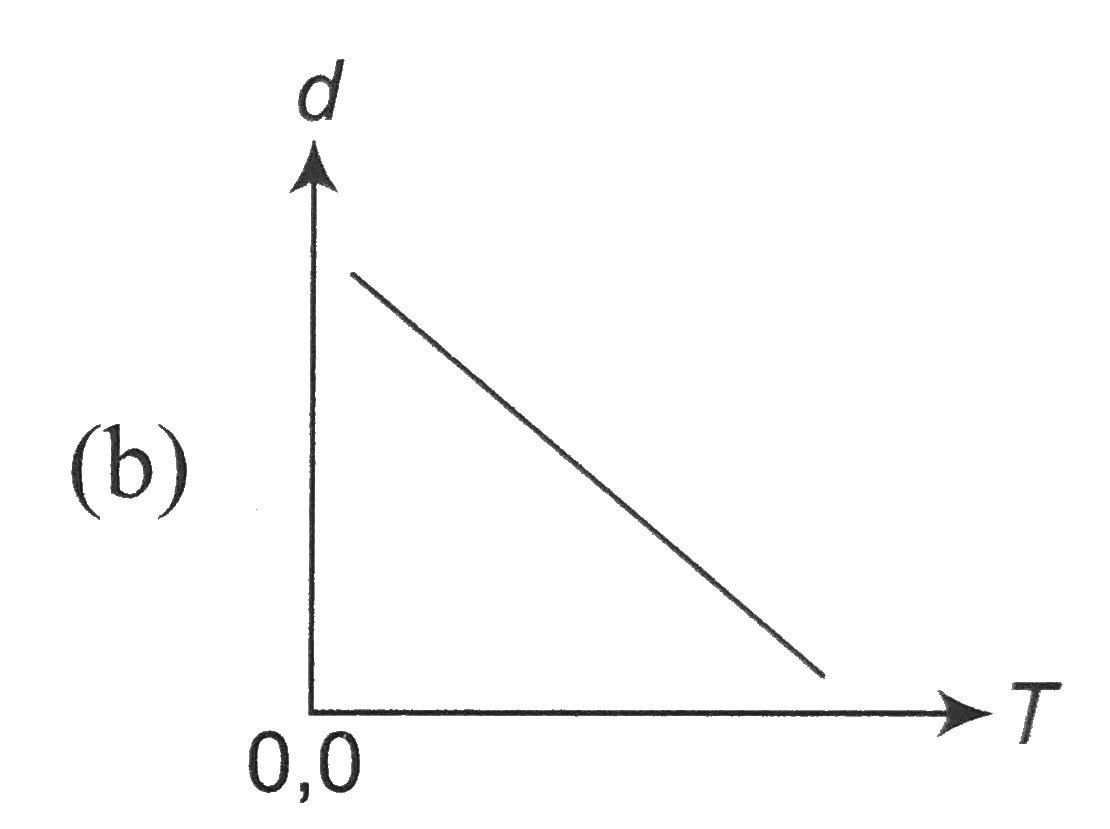 C
C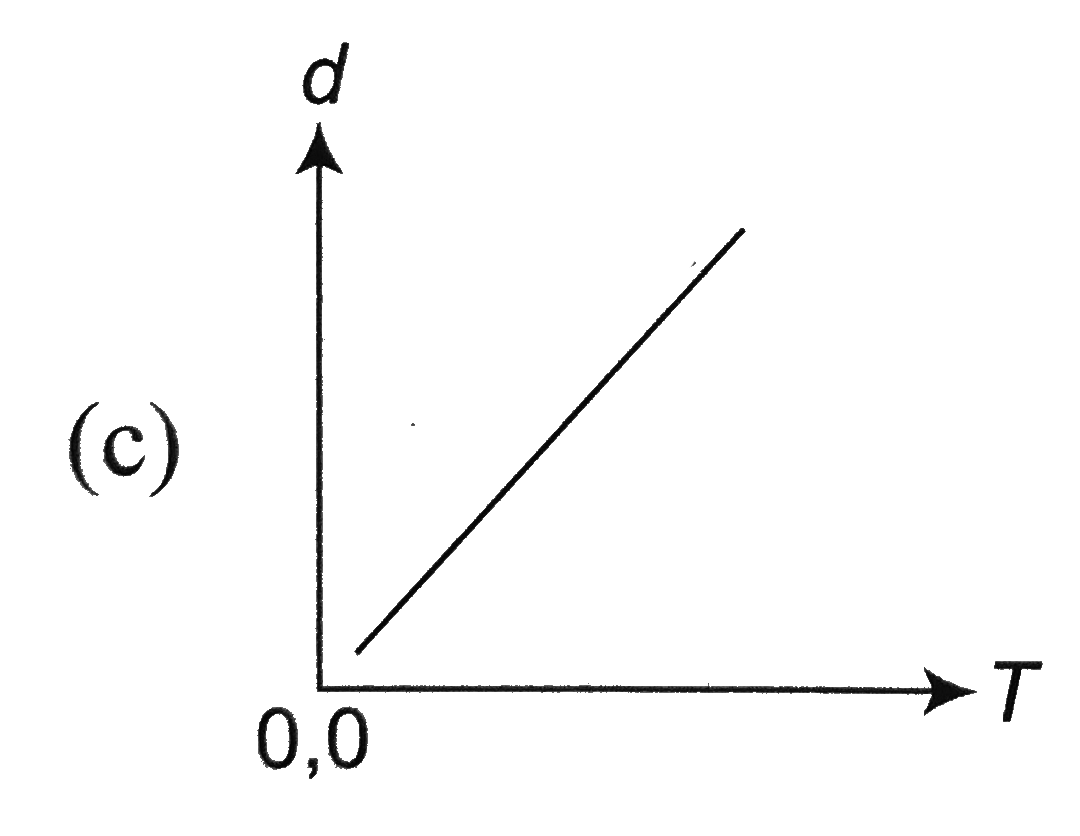 D
D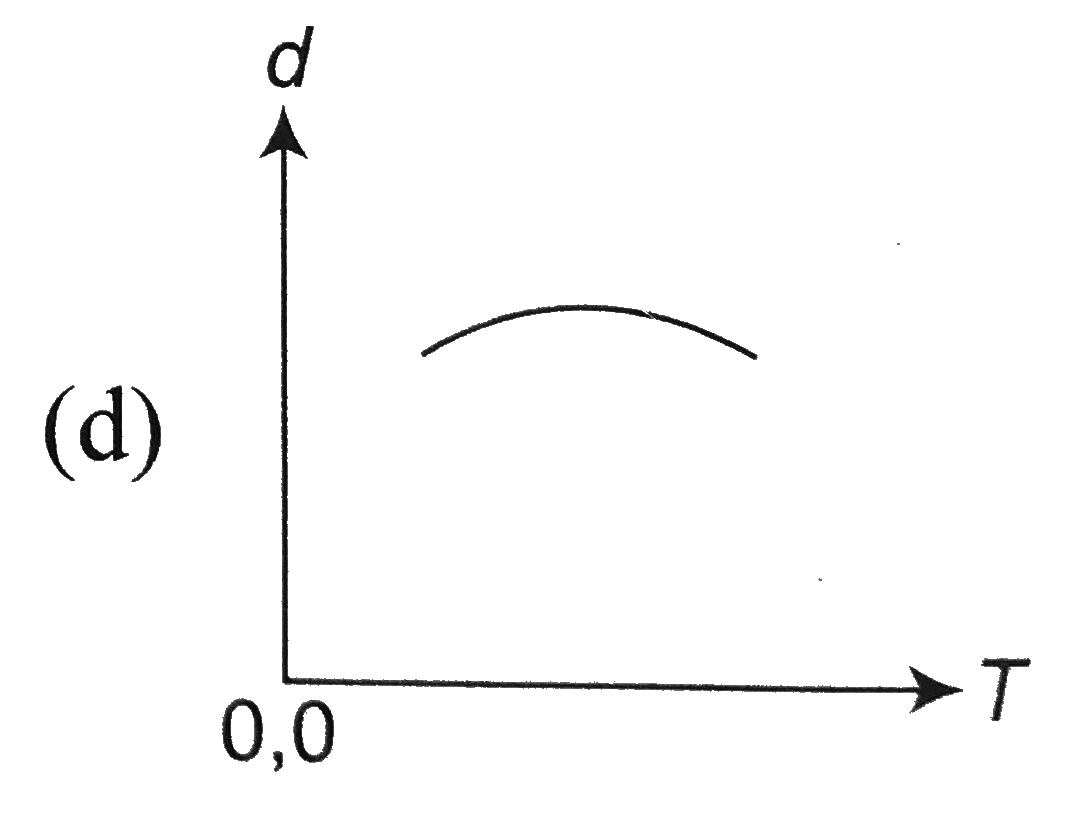
Which of the following graphs best represents the variation of acceleration 'a' with displacement x?
A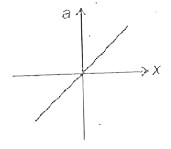 B
B C
C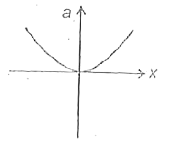 D
D
In law of tension, the fundamental frequency of vibrating string is
View SolutionWhich of the followings represent the variation of frequency (f) with radius of cross section of a stretched string?
View Solutionwhich of the following graph represents the variation of resistivity (ρ) with temperature (T) for copper?
View SolutionThe graph that represents variation of g at the equator with square of angular velocity of rotation of earth is
View SolutionWhich of the following graphs represent the variation of current(I) with frequency (f) in an AC circuit containing a pure capacitor?
View Solution