Following information relates to the exports form India to USSR and UK in the year 2015, 2016, 2017 and 2018 (hypothetical figures). Present it in the form of a table.

The correct Answer is:N/a
N/a
Topper's Solved these Questions
- PRESENTATION OF DATA - TEXTUAL AND TABULAR PRESENTATIONBOOK - TARUN JAIN & VK OHRICHAPTER - PRESENTATION OF DATA - TEXTUAL AND TABULAR PRESENTATIONEXERCISE - CONCEPT-BASED OBJECTIVE QUESTION
8 Videos
- ORGANISATION OF DATABOOK - TARUN JAIN & VK OHRICHAPTER - ORGANISATION OF DATAEXERCISE - EXERCISE NCERT
13 Videos
Similar Questions
The following table shows birth and death rate in India according to the Census Reports between 1931 - 40 to 2016-17 (hypothetical figures). Present the data in te form of a multiple bar diagram.

View SolutionFollowing table gives hypothetical figures of exports from India during the years 2013-14 to 2017-18. Present the information in the form of a suitable graph.
Year2013−142014−152015−162016−172017−18Exports (Rs. core)600640670780900
View SolutionFollowing information relates to the marks secured by 50 boys and girls in their paper in economics. Present the information in the form of a two-way table.

View SolutionFollowing information relates to the production of wheat and Rice in India in different years. Present it in the form of a table.

View SolutionFollowing information relates to the marks secured by 50 students in economics. Present the information in the form of a table.

View SolutionIn the following table, the investment made by 210 families is shown. Present it in the form of a histogram.

View SolutionIn the following table, the investment made by 210 families is shown. Present it in the form of a histogram.

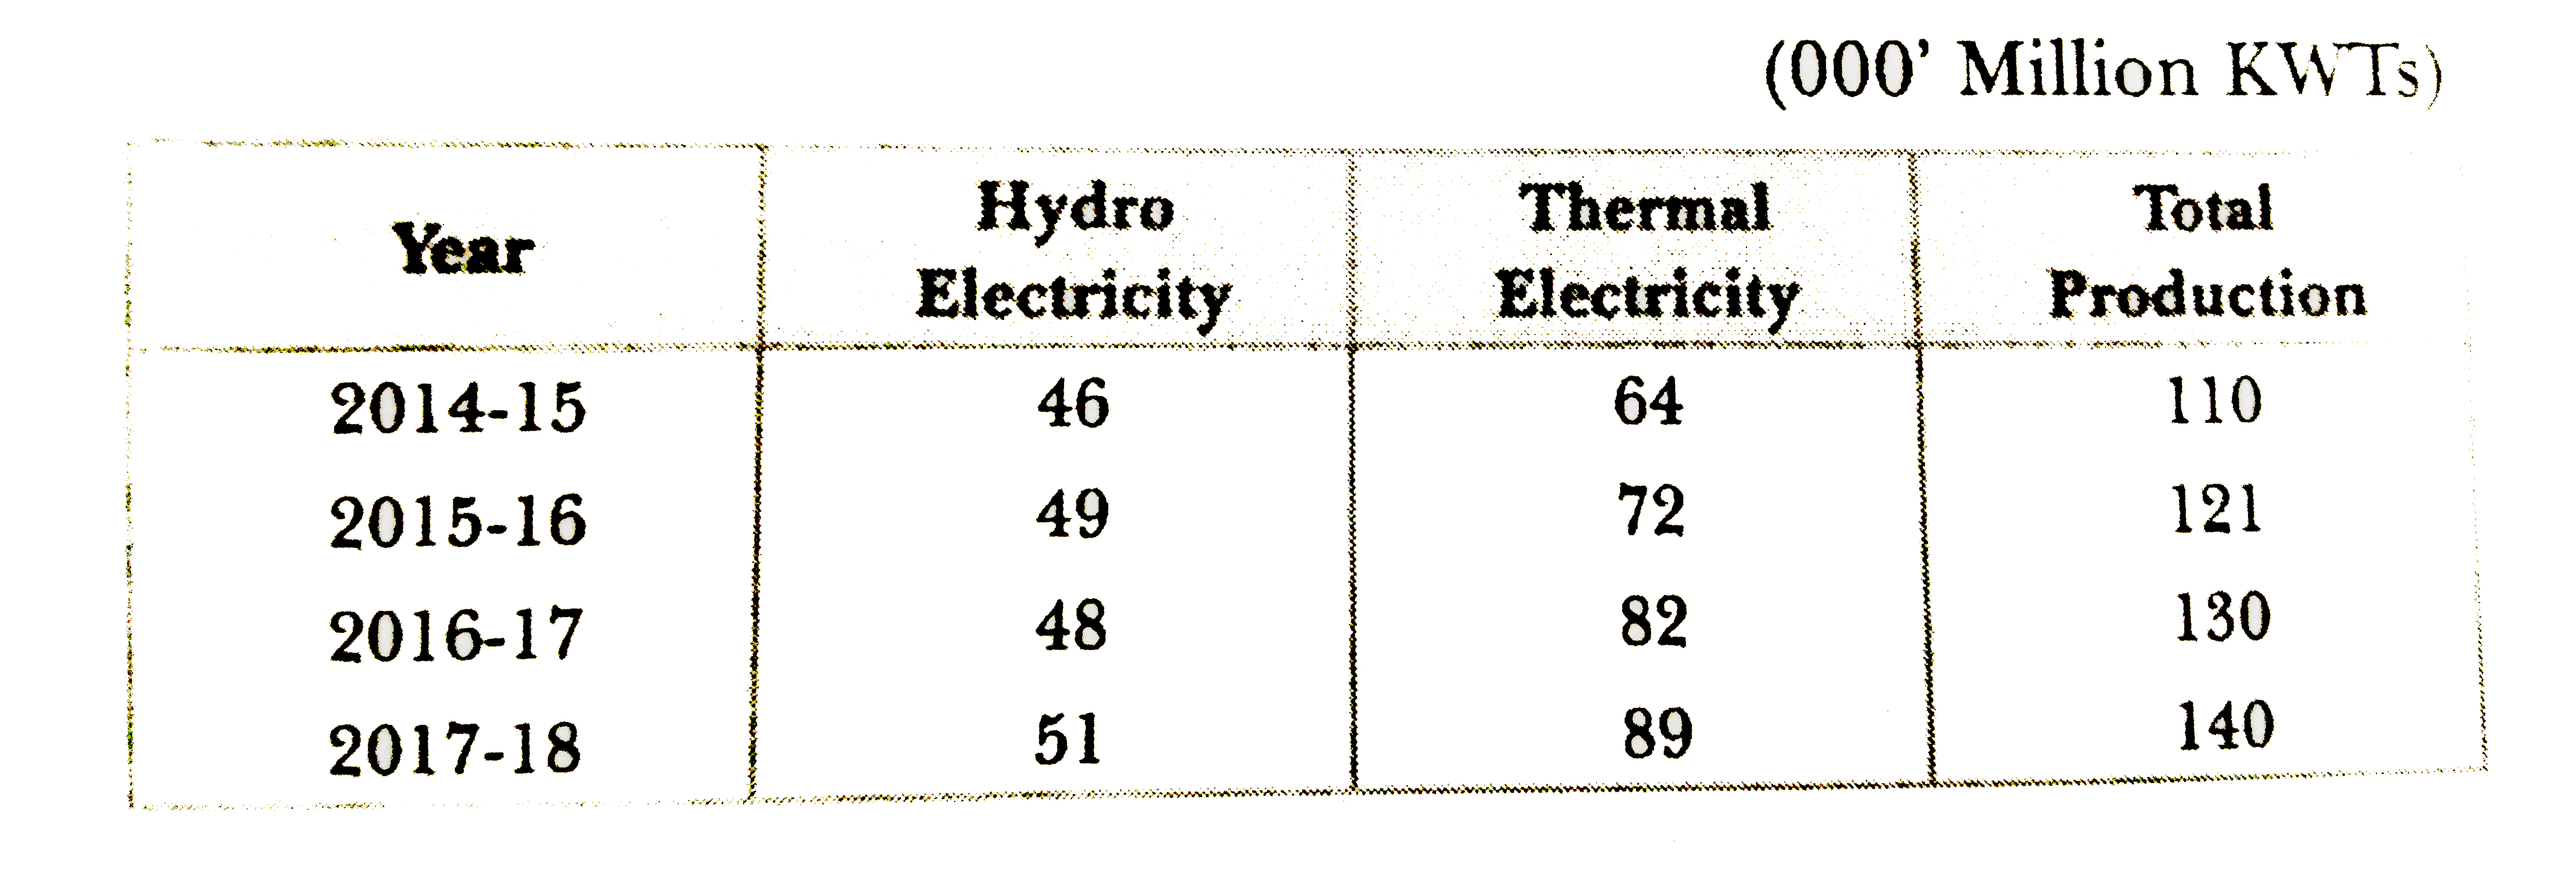
View SolutionThe following table shows Production of Electricity from different Sources in India during 2014-15 to 2017-18 (hypothetical data).
Present the data in a sub-divided bar diagram.

View SolutionFrom the following information, prepare Common size statement of profit and loss for the year ended March 31, 2016 and March 31,2017:


View SolutionFollowing are the data about the number of men and women in different age groups in a society. Present the information in the form of a two-way table.

View Solution
