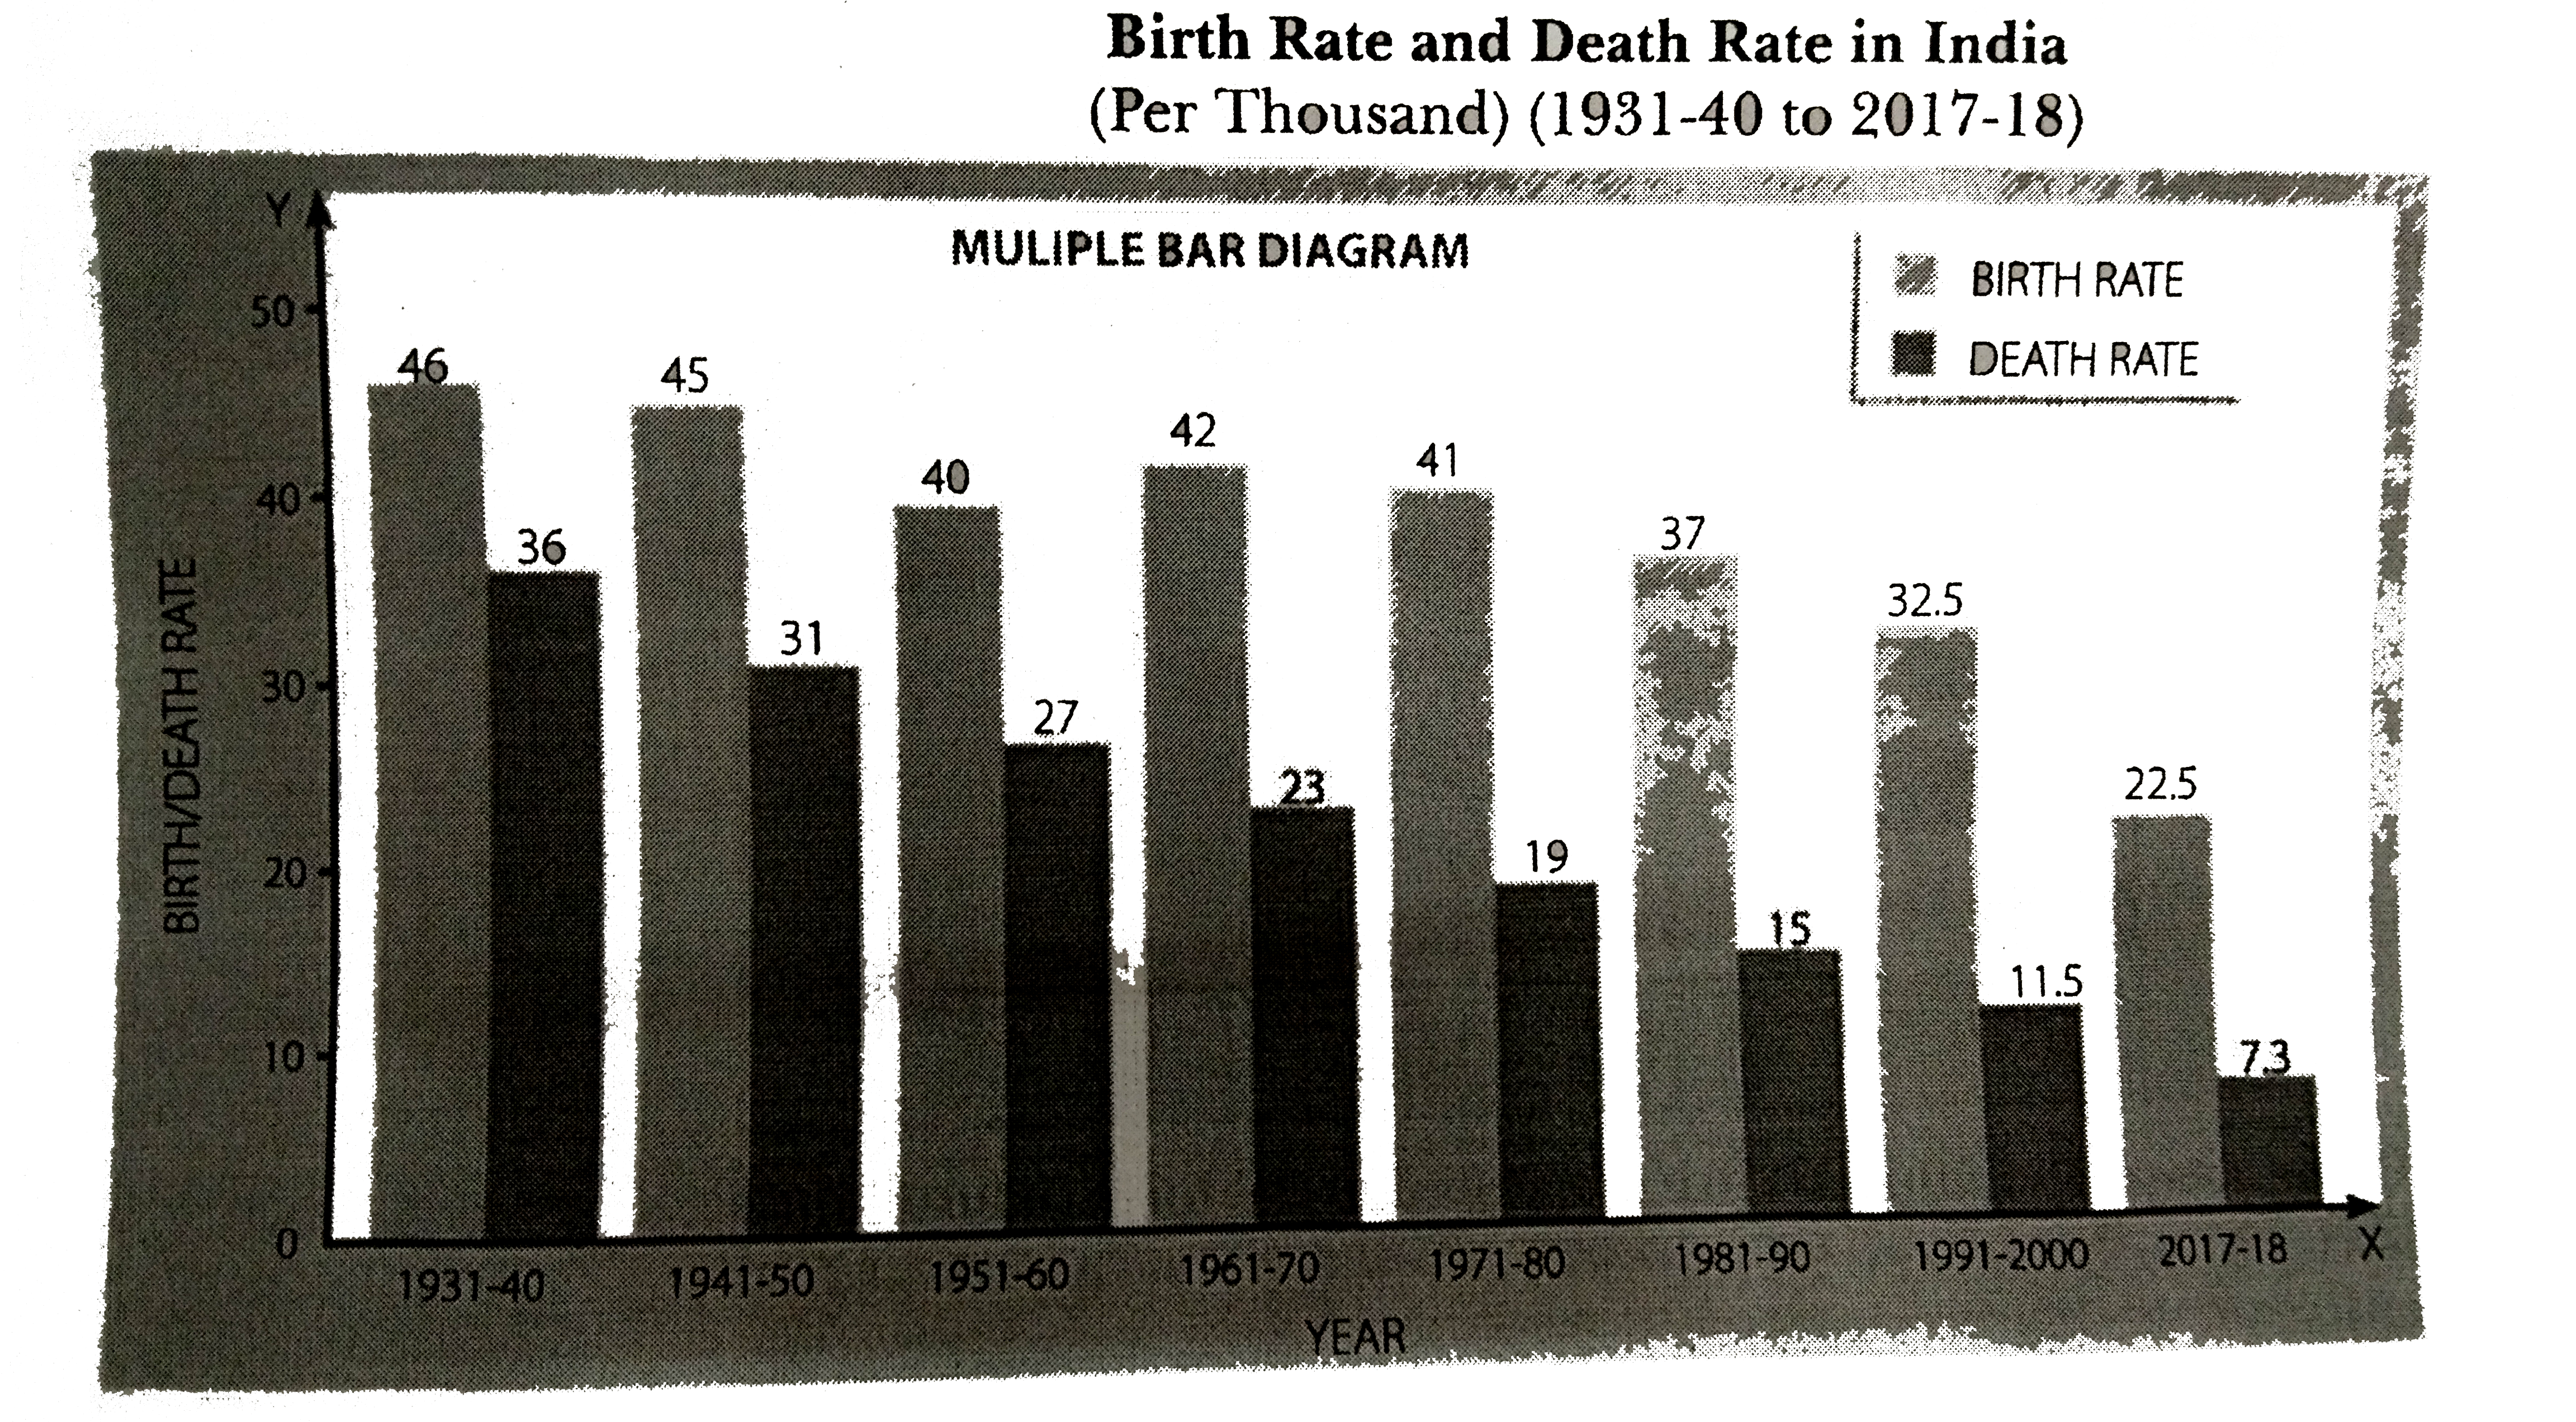
The following table shows birth and death rate in India according to the Census Reports between 1931 - 40 to 2016-17 (hypothetical figures). Present the data in te form of a multiple bar diagram.

Similar Questions
The following table gives data on birth rate in India according to census survey of different years. Present the information the form of a vertical/simple bar diagram.

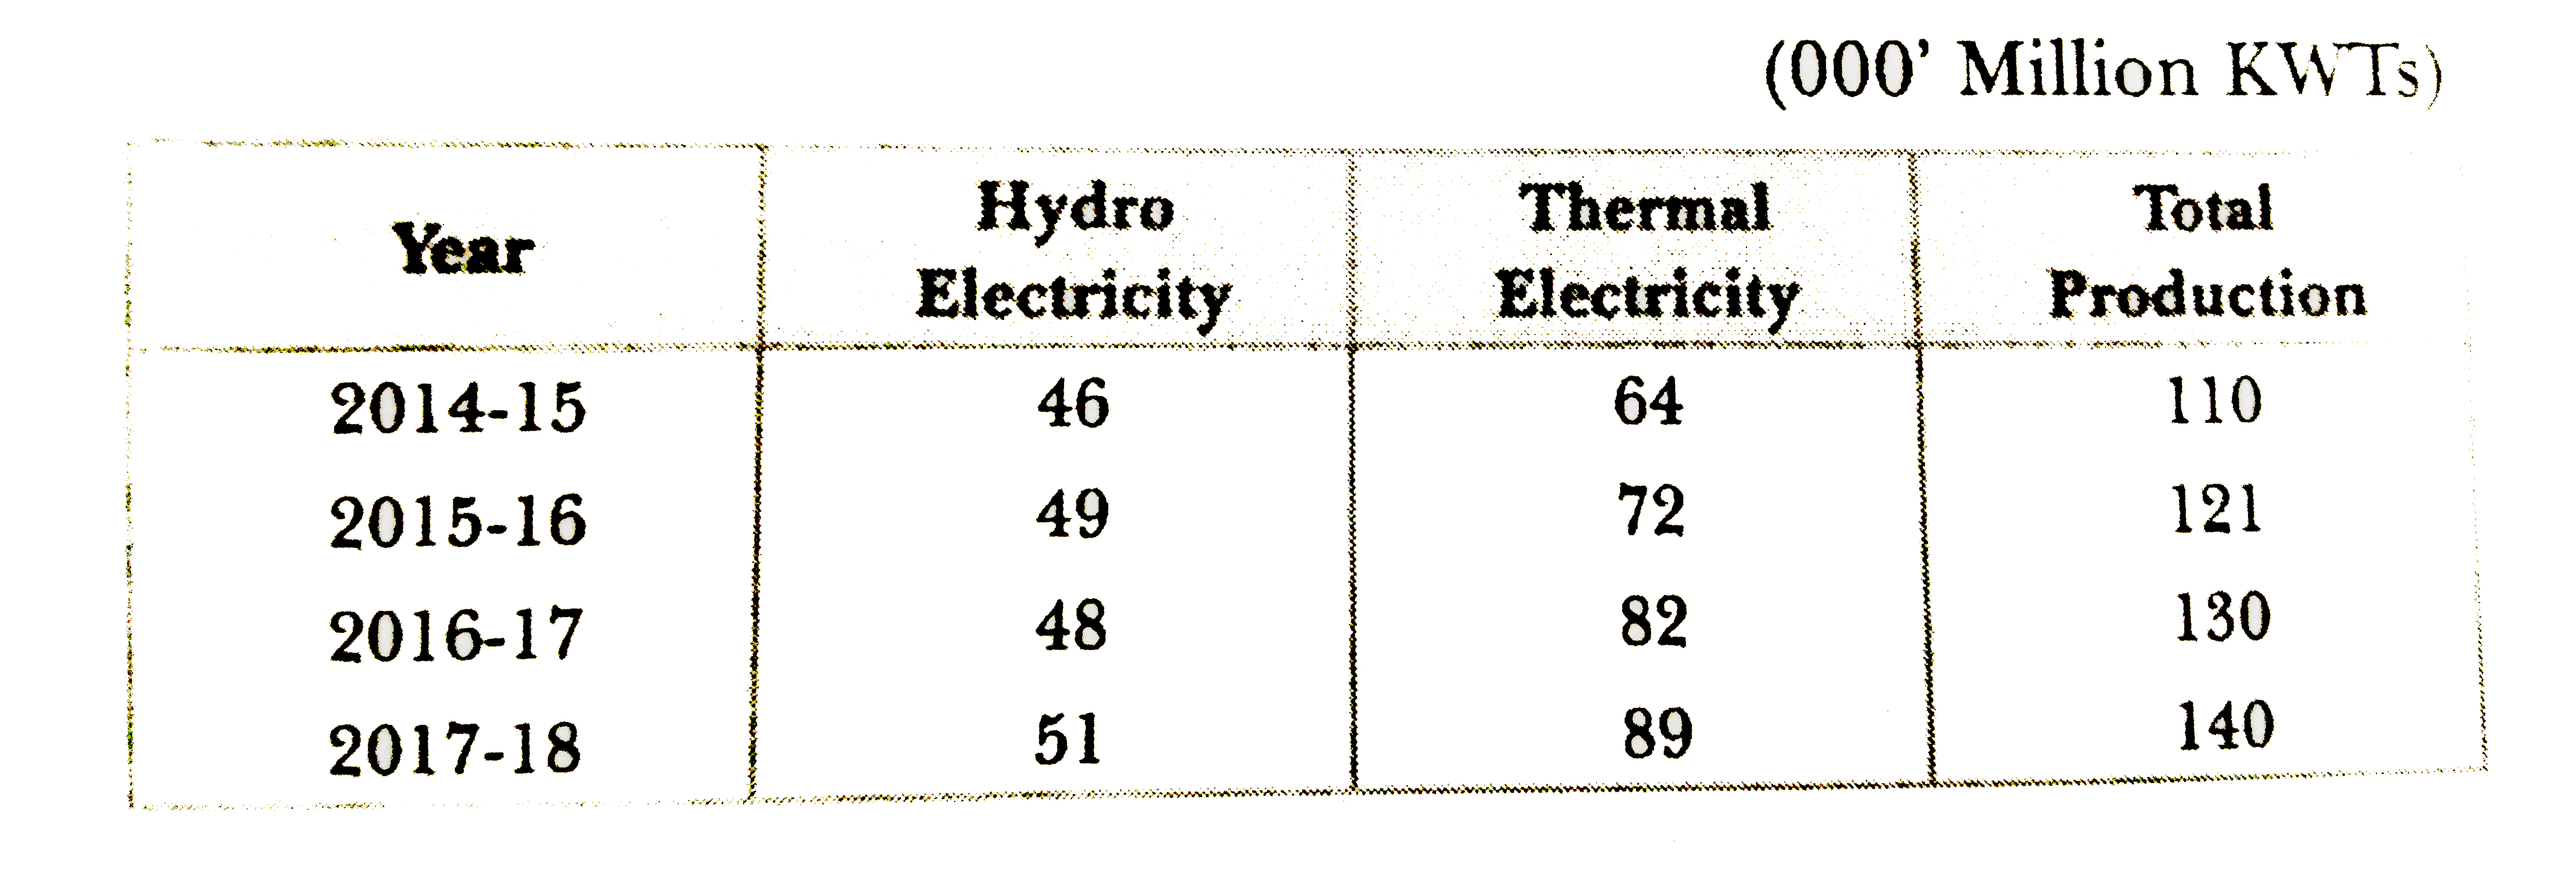
View SolutionThe following table shows Production of Electricity from different Sources in India during 2014-15 to 2017-18 (hypothetical data).
Present the data in a sub-divided bar diagram.

View Solution
Knowledge Check
Read the following passage and answer the questions that follow.
The four-year tiger census report, Status of Tigers in India, 2018, released by Prime Minister Narendra Modi shows numbers of the cat have increased across all landscapes. The Global Tiger Forum, an international collaboration of tiger-bearing countries, has set a goal of doubling the count of wild tigers by 2022. More than 80% of the world’s wild tigers are in India, and it’s crucial to keep track of their numbers. The total count in 2018 has risen to 2,967 from 2,226 in 2014 — an increase of 741 individuals an increase of 33%, in four years. This is by far the biggest increase in terms of both numbers and percentage since the four- yearly census using camera traps and the capture-mark-recapture method began in 2006. The 2018 figure has a great degree of credibility because, according to the report, as many as 2,461 individual tigers (83% of the total) have actually been photographed by trap cameras. In 2014, only 1,540 individuals (69%) were photographed. The tiger census is needed because the tiger sits at the peak of the food chain, and its conservation is important to ensure the well-being of the forest ecosystem. The tiger estimation exercise includes habitat assessment and prey estimation. The numbers reflect the success or failure of conservation efforts. This is an especially important indicator in a fast- growing economy like India where the pressures of development often run counter to the demands of conservation. Where has the tiger population increased the most? The biggest increase has been in Madhya Pradesh — a massive 218 individuals (71%) from 308 in 2014 to 526. However, since tigers keep moving between states, conservationists prefer to talk about tiger numbers in terms of landscapes. So, why have the numbers gone up? The success owes a lot to increased vigilance and conservation efforts by the Forest Department. From 28 in 2006, the number of tiger reserves went up to 50 in 2018, extending protection to larger numbers of tigers over the years. Healthy increases in core area populations eventually lead to migrations to areas outside the core, this is why the 2018 census has found tigers in newer areas. Over the years, there has been increased focus on tigers even in the areas under the territorial and commercial forestry arms of Forest Departments. The other important reason is increased vigilance, and the fact that organized poaching rackets have been all but crushed. According to Nitin Desai of Wildlife Protection Society of India, there has been no organized poaching by traditional gangs in Central Indian landscapes since 2013. The increased protection has encouraged the tiger to breed. Tigers are fast breeders when conditions are conducive. The rehabilitation of villages outside core areas in many parts of the country has led to the availability of more inviolate space for tigers. Also, because estimation exercises have become increasingly more accurate over the years, it is possible that many tigers that eluded enumerators in earlier exercises were counted this time.
What has been the impact of providing inviolate spaces for tigers?A1.The number of villagers killed by man eater tigers has increased.B2.Tiger numbers have increased due to safe breeding places.C3.The poachers have been caught in these spaces very easily.D4.Tigers have moved from Uttar Pradesh to Madhya PradeshRead the following passage and answer the questions that follow.
The four-year tiger census report, Status of Tigers in India, 2018, released by Prime Minister Narendra Modi shows numbers of the cat have increased across all landscapes. The Global Tiger Forum, an international collaboration of tiger-bearing countries, has set a goal of doubling the count of wild tigers by 2022. More than 80% of the world’s wild tigers are in India, and it’s crucial to keep track of their numbers. The total count in 2018 has risen to 2,967 from 2,226 in 2014 — an increase of 741 individuals an increase of 33%, in four years. This is by far the biggest increase in terms of both numbers and percentage since the four- yearly census using camera traps and the capture-mark-recapture method began in 2006. The 2018 figure has a great degree of credibility because, according to the report, as many as 2,461 individual tigers (83% of the total) have actually been photographed by trap cameras. In 2014, only 1,540 individuals (69%) were photographed. The tiger census is needed because the tiger sits at the peak of the food chain, and its conservation is important to ensure the well-being of the forest ecosystem. The tiger estimation exercise includes habitat assessment and prey estimation. The numbers reflect the success or failure of conservation efforts. This is an especially important indicator in a fast- growing economy like India where the pressures of development often run counter to the demands of conservation. Where has the tiger population increased the most? The biggest increase has been in Madhya Pradesh — a massive 218 individuals (71%) from 308 in 2014 to 526. However, since tigers keep moving between states, conservationists prefer to talk about tiger numbers in terms of landscapes. So, why have the numbers gone up? The success owes a lot to increased vigilance and conservation efforts by the Forest Department. From 28 in 2006, the number of tiger reserves went up to 50 in 2018, extending protection to larger numbers of tigers over the years. Healthy increases in core area populations eventually lead to migrations to areas outside the core, this is why the 2018 census has found tigers in newer areas. Over the years, there has been increased focus on tigers even in the areas under the territorial and commercial forestry arms of Forest Departments. The other important reason is increased vigilance, and the fact that organized poaching rackets have been all but crushed. According to Nitin Desai of Wildlife Protection Society of India, there has been no organized poaching by traditional gangs in Central Indian landscapes since 2013. The increased protection has encouraged the tiger to breed. Tigers are fast breeders when conditions are conducive. The rehabilitation of villages outside core areas in many parts of the country has led to the availability of more inviolate space for tigers. Also, because estimation exercises have become increasingly more accurate over the years, it is possible that many tigers that eluded enumerators in earlier exercises were counted this time.
The survival of the tiger is vital today because-A1.it is now on the verge of extinction.B2.it promotes tourism in India and increases revenue.C3.it is central to the food chain and the eco system.D4.it is no longer a threat to the villagers' safetyRead the following passage and answer the questions that follow.
The four-year tiger census report, Status of Tigers in India, 2018, released by Prime Minister Narendra Modi shows numbers of the cat have increased across all landscapes. The Global Tiger Forum, an international collaboration of tiger-bearing countries, has set a goal of doubling the count of wild tigers by 2022. More than 80% of the world’s wild tigers are in India, and it’s crucial to keep track of their numbers. The total count in 2018 has risen to 2,967 from 2,226 in 2014 — an increase of 741 individuals an increase of 33%, in four years. This is by far the biggest increase in terms of both numbers and percentage since the four- yearly census using camera traps and the capture-mark-recapture method began in 2006. The 2018 figure has a great degree of credibility because, according to the report, as many as 2,461 individual tigers (83% of the total) have actually been photographed by trap cameras. In 2014, only 1,540 individuals (69%) were photographed. The tiger census is needed because the tiger sits at the peak of the food chain, and its conservation is important to ensure the well-being of the forest ecosystem. The tiger estimation exercise includes habitat assessment and prey estimation. The numbers reflect the success or failure of conservation efforts. This is an especially important indicator in a fast- growing economy like India where the pressures of development often run counter to the demands of conservation. Where has the tiger population increased the most? The biggest increase has been in Madhya Pradesh — a massive 218 individuals (71%) from 308 in 2014 to 526. However, since tigers keep moving between states, conservationists prefer to talk about tiger numbers in terms of landscapes. So, why have the numbers gone up? The success owes a lot to increased vigilance and conservation efforts by the Forest Department. From 28 in 2006, the number of tiger reserves went up to 50 in 2018, extending protection to larger numbers of tigers over the years. Healthy increases in core area populations eventually lead to migrations to areas outside the core, this is why the 2018 census has found tigers in newer areas. Over the years, there has been increased focus on tigers even in the areas under the territorial and commercial forestry arms of Forest Departments. The other important reason is increased vigilance, and the fact that organized poaching rackets have been all but crushed. According to Nitin Desai of Wildlife Protection Society of India, there has been no organized poaching by traditional gangs in Central Indian landscapes since 2013. The increased protection has encouraged the tiger to breed. Tigers are fast breeders when conditions are conducive. The rehabilitation of villages outside core areas in many parts of the country has led to the availability of more inviolate space for tigers. Also, because estimation exercises have become increasingly more accurate over the years, it is possible that many tigers that eluded enumerators in earlier exercises were counted this time.
The biggest increase in tiger population has been between the yearsA2014-2018B2002-2006C2010-2014D2006-2010
Following information relates to the exports form India to USSR and UK in the year 2015, 2016, 2017 and 2018 (hypothetical figures). Present it in the form of a table.

View SolutionFollowing tables shows estimates of cost of production of certain commodities. Present the data in the form of sub divided bar diagram:

View SolutionThe following table gives data on the production and sales of a factory (in thousand rupees) between January and June. Present the information in the form of a two variable arithmetic-line graph.
MonthJanuaryFebruaryMarchAprilMayJuneProduction57.551012.515Sales7.5107.512.51517.5
View SolutionThe following table shows the monthly expenditure of different families on different items :

Represent the data in the form of a sub-divided bar diagram.
View SolutionFollowing table gives hypothetical figures of exports from India during the years 2013-14 to 2017-18. Present the information in the form of a suitable graph.
Year2013−142014−152015−162016−172017−18Exports (Rs. core)600640670780900
View Solution

