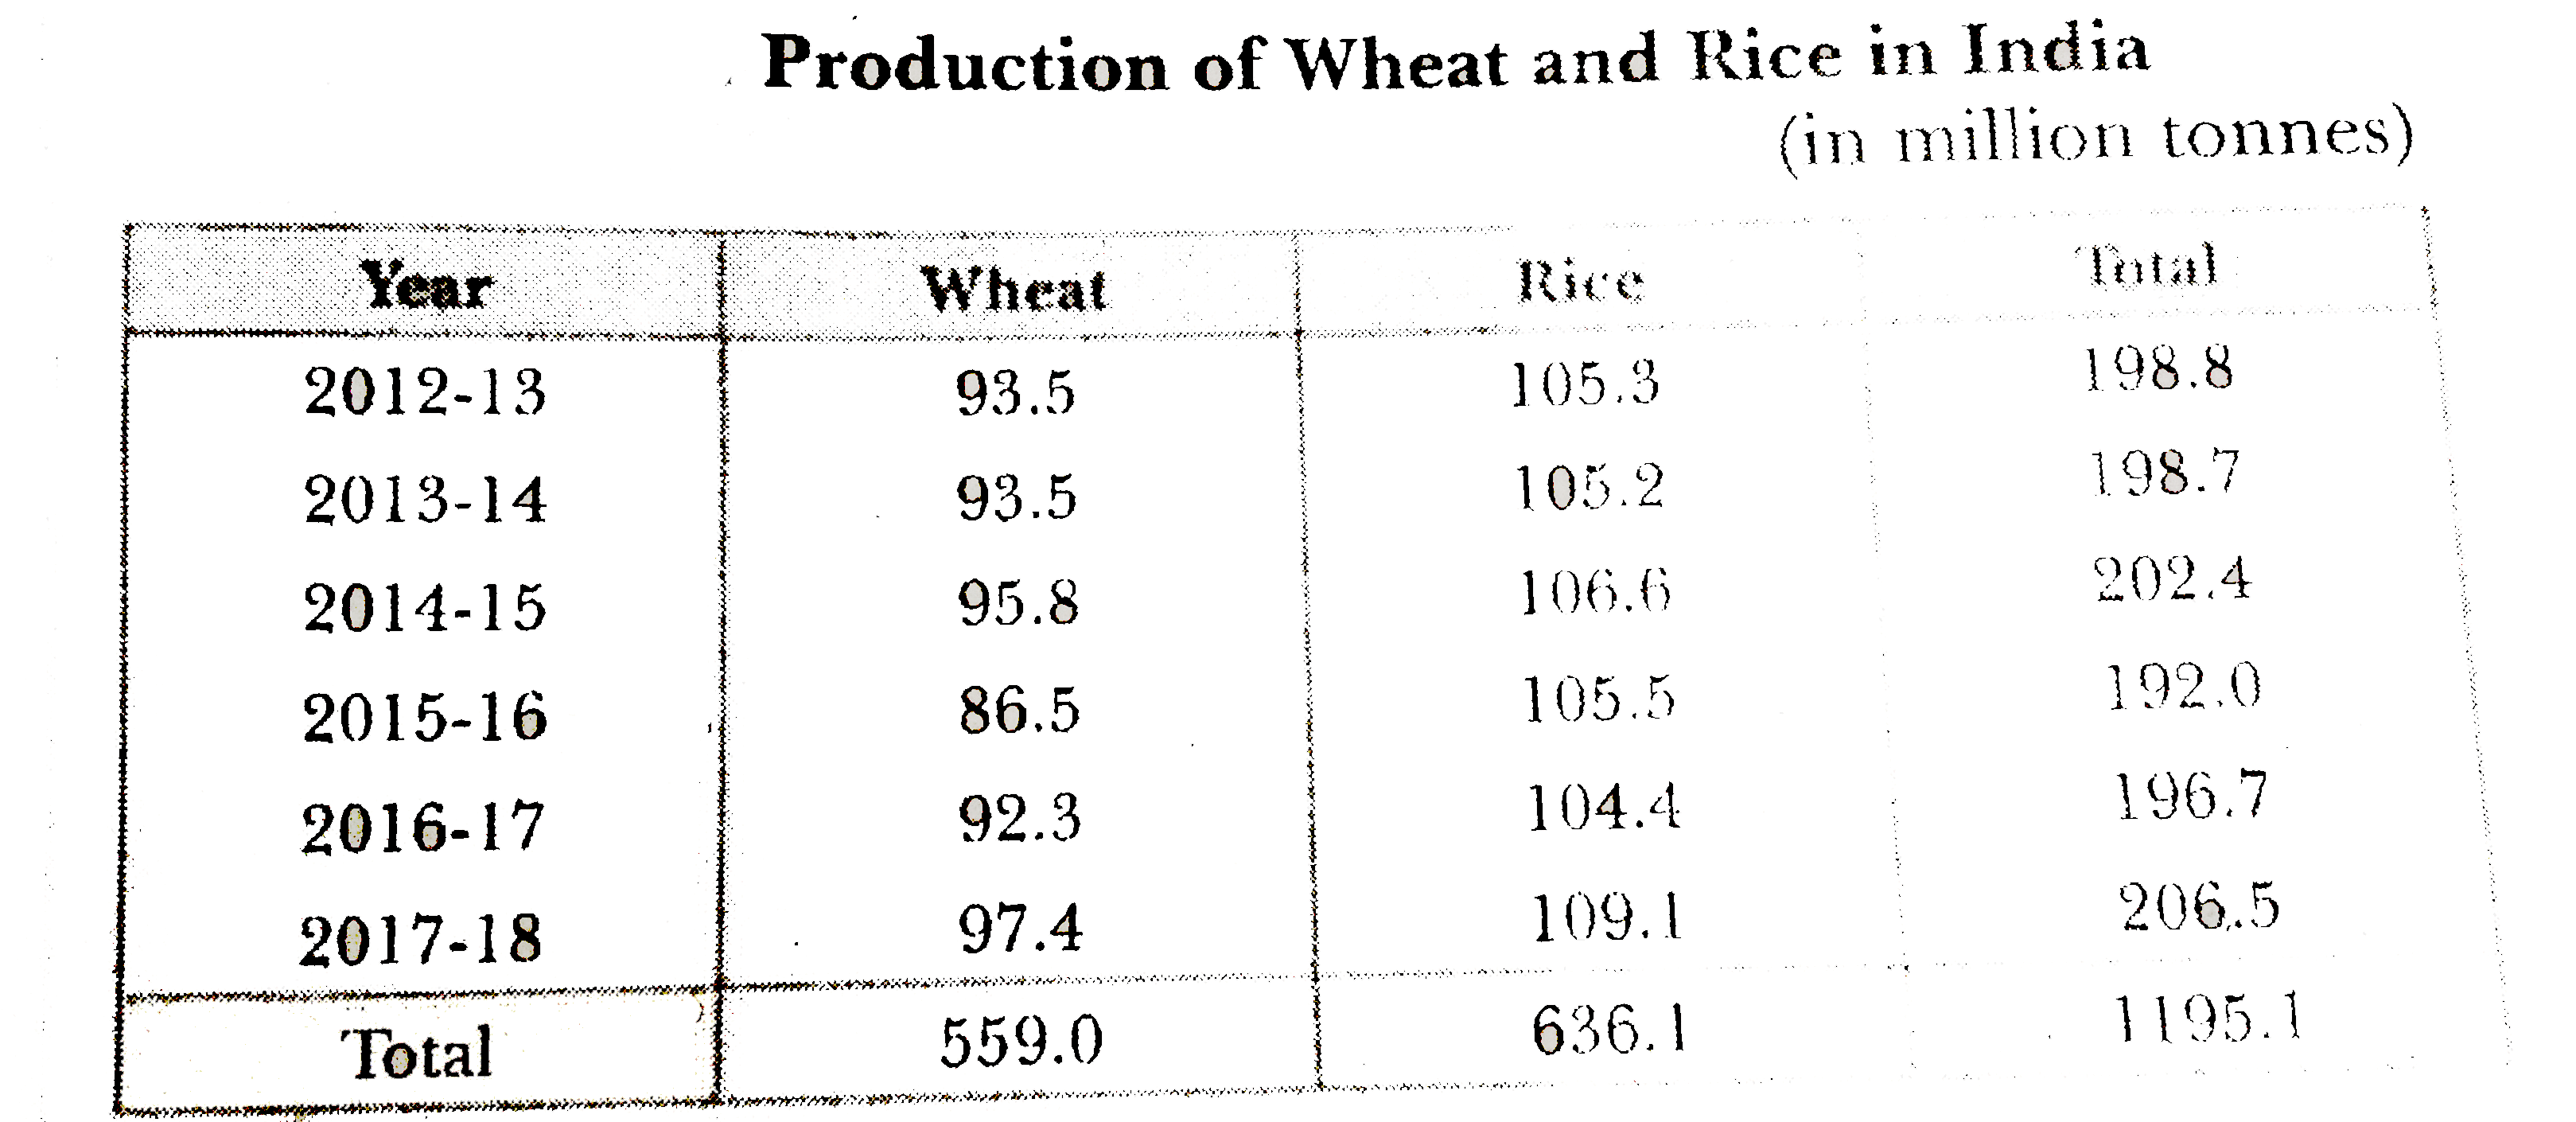
Following information relates to the production of wheat and Rice in India in different years. Present it in the form of a table.

The correct Answer is:N/a
Topper's Solved these Questions
- PRESENTATION OF DATA - TEXTUAL AND TABULAR PRESENTATIONBOOK - TARUN JAIN & VK OHRICHAPTER - PRESENTATION OF DATA - TEXTUAL AND TABULAR PRESENTATIONEXERCISE - MULTIPLE CHOICE QUESTIONS
7 Videos
- PRESENTATION OF DATA - TEXTUAL AND TABULAR PRESENTATIONBOOK - TARUN JAIN & VK OHRICHAPTER - PRESENTATION OF DATA - TEXTUAL AND TABULAR PRESENTATIONEXERCISE - FILL IN THE BLANK
6 Videos
- ORGANISATION OF DATABOOK - TARUN JAIN & VK OHRICHAPTER - ORGANISATION OF DATAEXERCISE - EXERCISE NCERT
13 Videos
Similar Questions
Knowledge Check
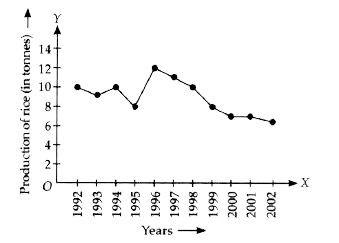
What is the average production of rice in state A over the years.
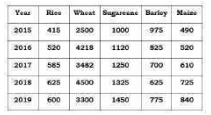
A6B6.1C5.8D5.9In the following table, the production of various crops (in tonnes) is given from 2015 to 2019. Study the table and answer the question that follows:
दी गयी तालिका में, 2015 से 2019 तक विभिन्न फसलों का उत्पादन (टन में ) दिया गया है | इस तालिका का अध्ययन करें तथा फिर पूछे गए प्रश्न का उत्तर दीजिए | The average production of wheat (in tonnes) in the period given in the table is:
तालिका में दी गयी अवधि में गेहूँ का औसत उत्पादन ( टन में ) कितना रहा है ?A3600B3482C3300D4218
Following information relates to the marks secured by 50 boys and girls in their paper in economics. Present the information in the form of a two-way table.

View SolutionThe following table gives data on birth rate in India according to census survey of different years. Present the information the form of a vertical/simple bar diagram.

View SolutionFollowing are the data about the number of men and women in different age groups in a society. Present the information in the form of a two-way table.

View SolutionFollowing data relate to the construction of a house in delhi .present the information in the form of a pie diagram:

View SolutionFollowing tables shows estimates of cost of production of certain commodities. Present the data in the form of sub divided bar diagram:

View SolutionThe graph shown in figure exhibits the production of rice for different years. Read the graph and find, in which period was the production remains constant?

View Solution


