Draw a blank table to show the distribution of population according to sex, literacy, and income.
The correct Answer is:N/a
N/a
Topper's Solved these Questions
- PRESENTATION OF DATA - TEXTUAL AND TABULAR PRESENTATIONBOOK - TARUN JAIN & VK OHRICHAPTER - PRESENTATION OF DATA - TEXTUAL AND TABULAR PRESENTATIONEXERCISE - CONCEPT-BASED OBJECTIVE QUESTION
8 Videos
- ORGANISATION OF DATABOOK - TARUN JAIN & VK OHRICHAPTER - ORGANISATION OF DATAEXERCISE - EXERCISE NCERT
13 Videos
Similar Questions
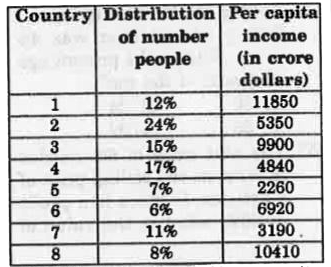
The table below shows the distribution of number of people living in 8 different countries and the per capita income of each of the countries. The total population of these countries taken together is 200 crores. Per capita income= total GDP of country/population of the country.

What is the difference (in crores) between population of the most and the least populated country?
View SolutionThe following table shows the distribution of weights of seeds. Draw a frequency polygon.

View Solution
Knowledge Check
The following table shows the percentage distribution of the population of five states, A,B,C,D and E on the basis of the poverty line and also on the basis of sex.
निम्नलिखित तालिका गरीबी रेखा तथा लिंग के आधार पर पाँच राज्यों A,B,C, D तथा E की आबादी के प्रतिशत वितरण को दर्शाती है | If the population of males below the poverty line for State C is 3 million, then what is the total
population of State C?
यदि राज्य C में गरीबी रेखा से नीचे पुरुषों की आबादी 30 लाख है, तो राज्य C की कुल आबादी कितनी है ?A24.486 millionB23.361 millionC25.617 millionD26.316 millionThe distribution of the working population according to the occupations they are engaged in is referred to as the
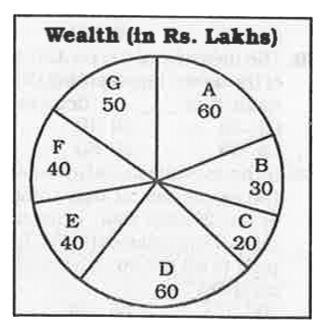
Afunctional structureBoccupational structureCpopulation structureDNone of theseThe pie chart shows the distribution of wealth among 7 children according to their father's will. Study the diagram and answer the following questions.

What is the total wealth (in Rs. lakhs) of the father which was distributed according to the will?A300B400C360D240
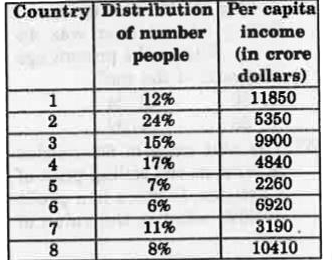
The table below shows the distribution of number of people living in 8 different countries and the per capita income of each of the countries. The total population of these countries taken together is 200 crores. Per capita income= total GDP of country/population of the country.

What is the total GDP (in crore dollars) for the country with the third lowest per capita income?
View SolutionThe table below shows the distribution of number of people living in 8 different countries and the per capita income of each of the countries. The total population of these countries taken together is 200 crores. Per capita income= total GDP of country/population of the country.

What is the difference (in crores) between population of the most and the least populated country?
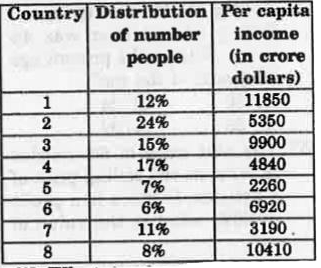
View SolutionThe table below shows the distribution of number of people living in 8 different countries and the per capita income of each of the countries. The total population of these countries taken together is 200 crores. Per capita income= total GDP of country/population of the country.

What is the total GDP (in crore dollars) for the country with the third lowest per capita income?
View SolutionThe table below shows the distribution of number of people living in 8 different countries and the per capita income of each of the countries. The total population of these countries taken together is 200 crores. Per capita income= total GDP of country/population of the country.

Which country has the highest total GDP?
View Solution
