Which of the following diagrams (figure) depicts ideal gas behaviour?
A
B
C
D
Video Solution
Text Solution
We know that ideal gas equation is
pV=nRT
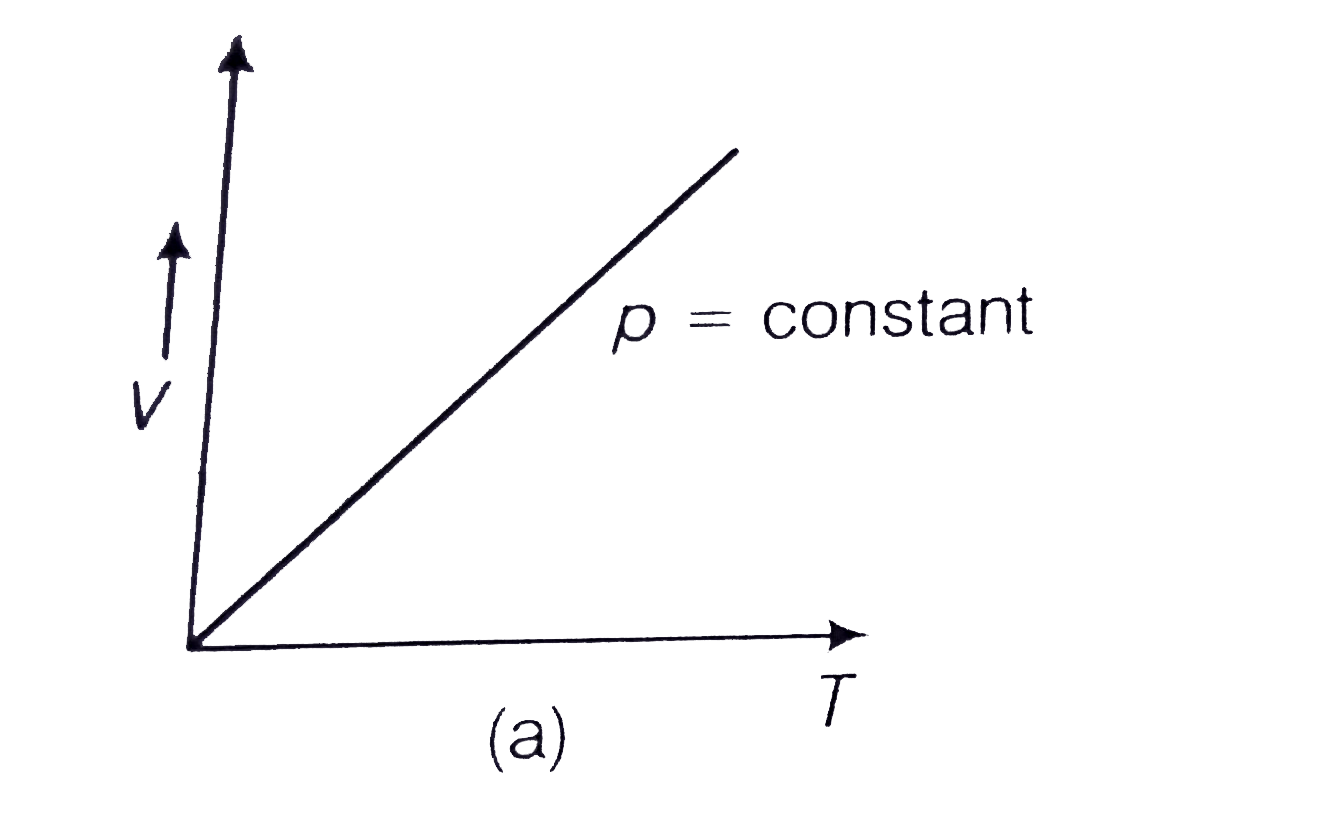
(a) When pressure p = constant
From (i) volume V∝ Temperature T
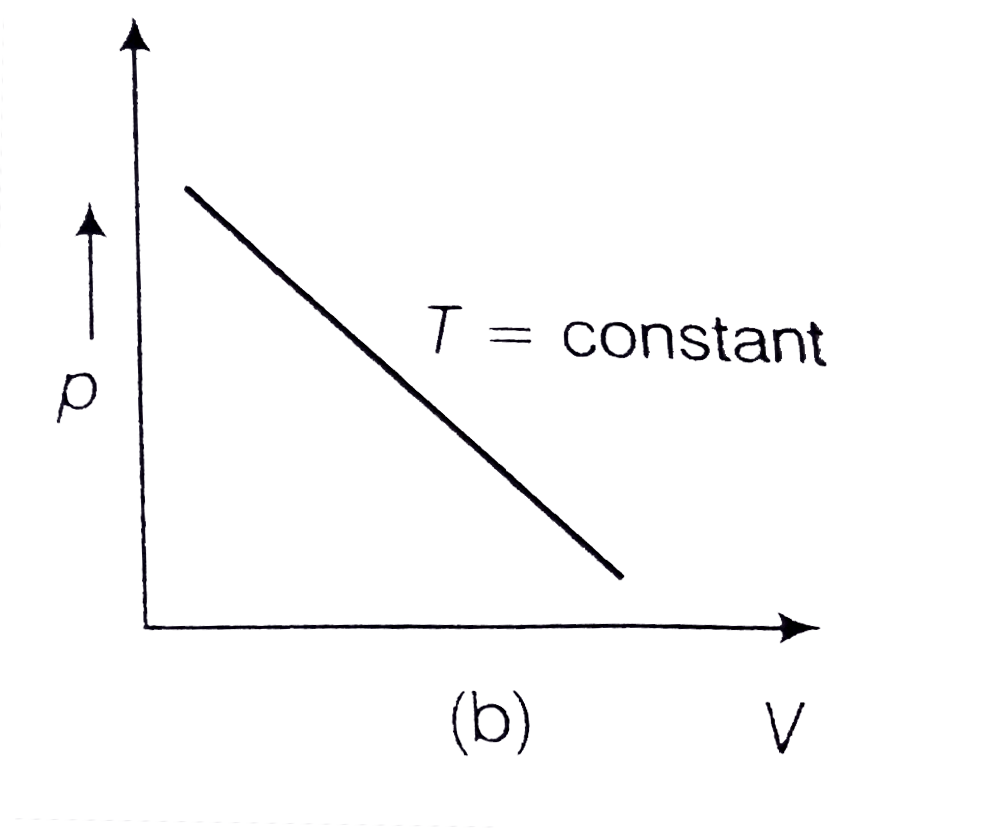
(b) When T = constant
From (i) pV = constant
So, the graph is rectangular hyperbola.
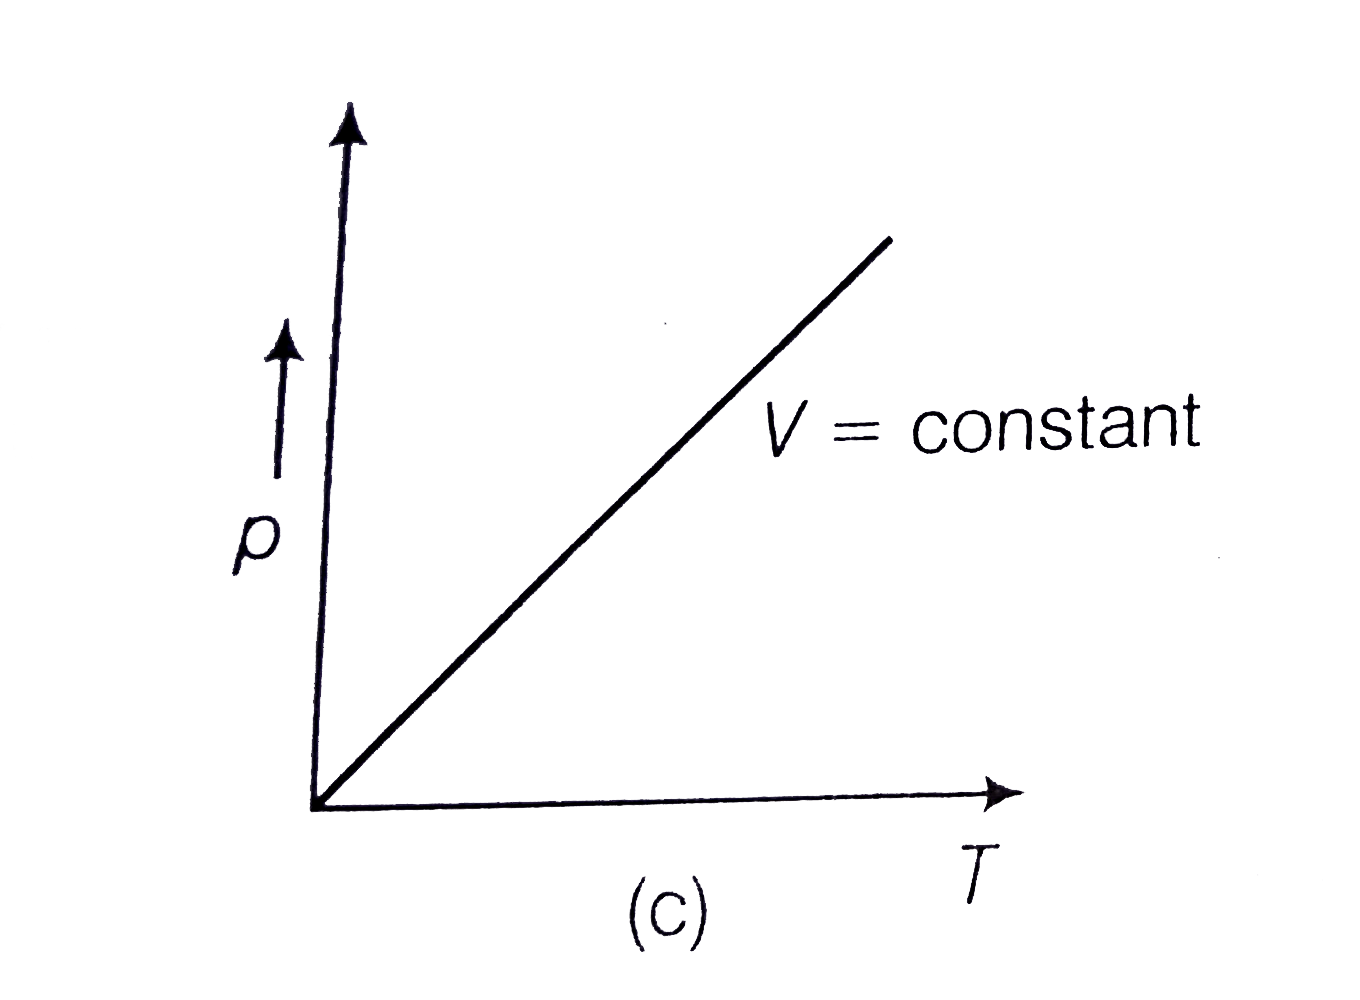
(C ) When V= Constant.
From(i) p∝T
So, the graph is straight line passes through the origin.
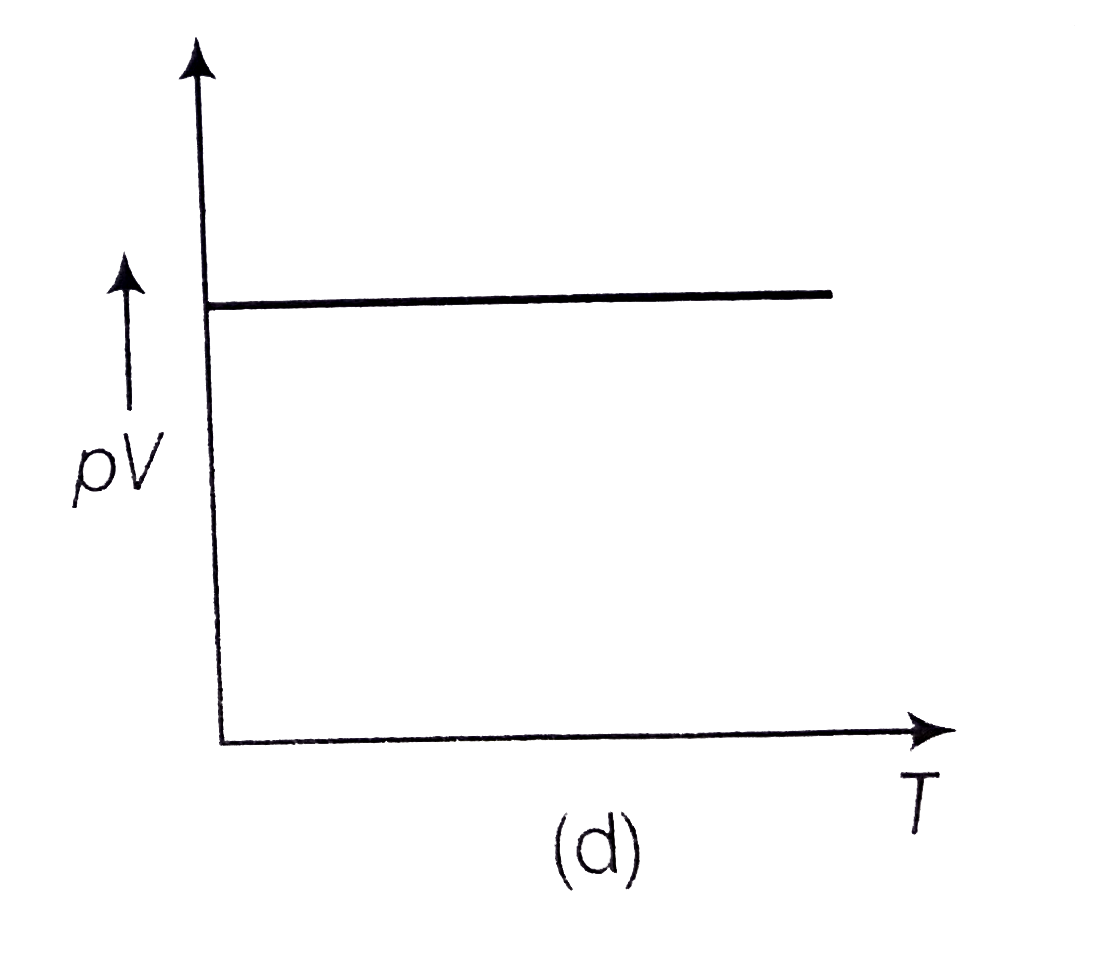
(d) From (i) pV∝T
⇒ pVT= constant
⇒ So, the graph hence through origin.
So (d) is not correct.
|
Topper's Solved these Questions
Similar Questions
Knowledge Check
Which of the following diagrams, Fig. depicts ideal gas behaviour ?
A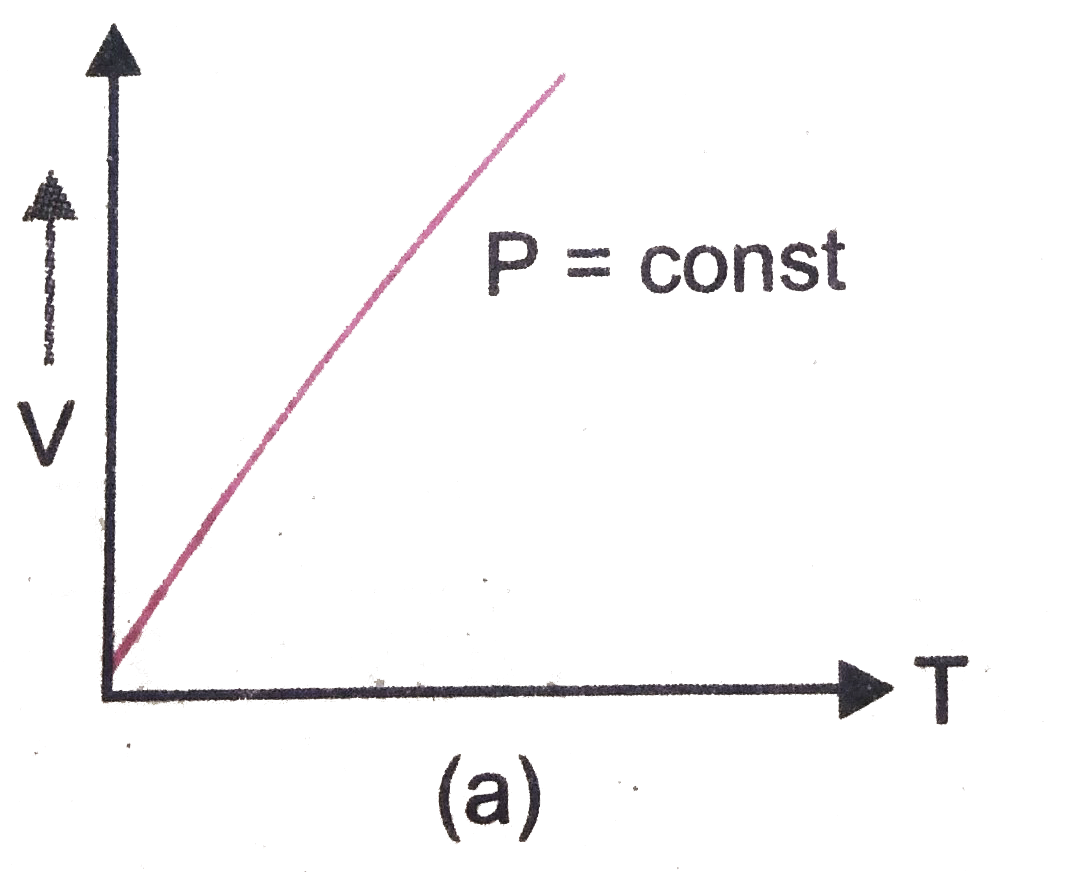 B
B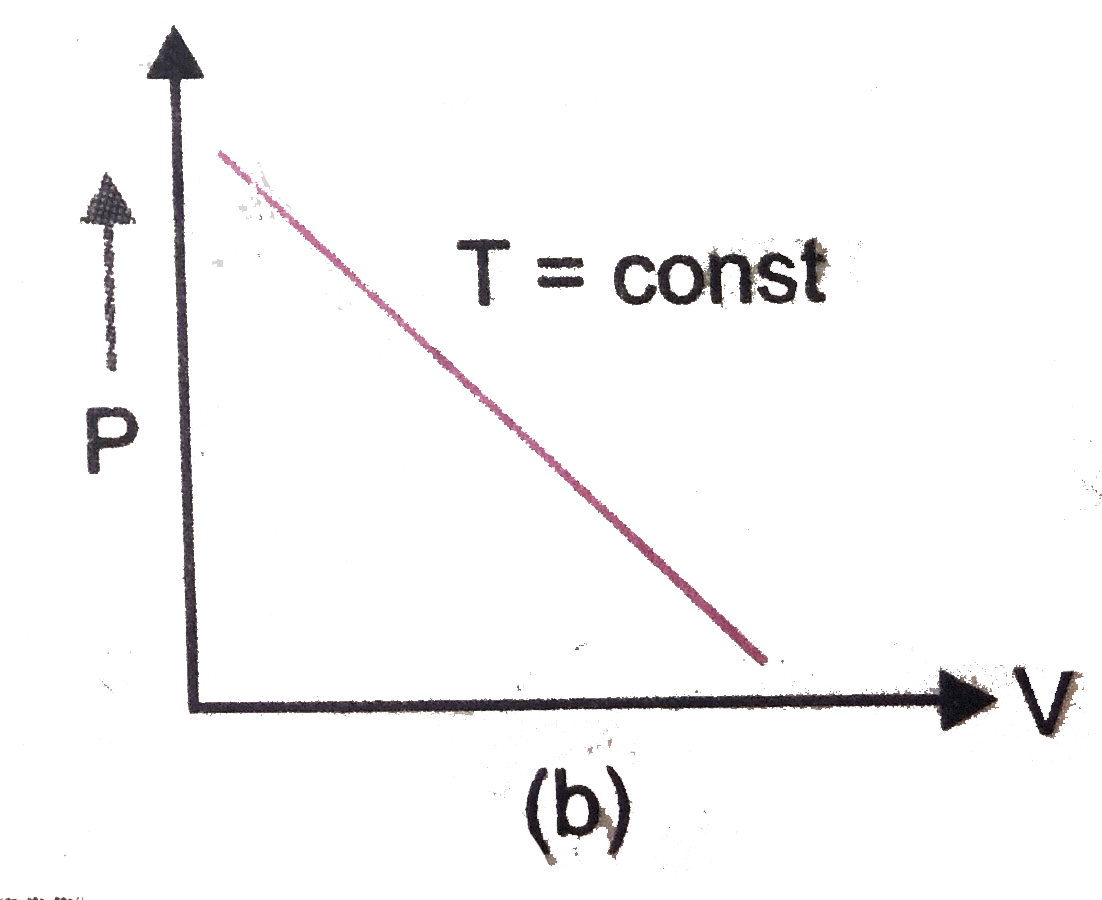 C
C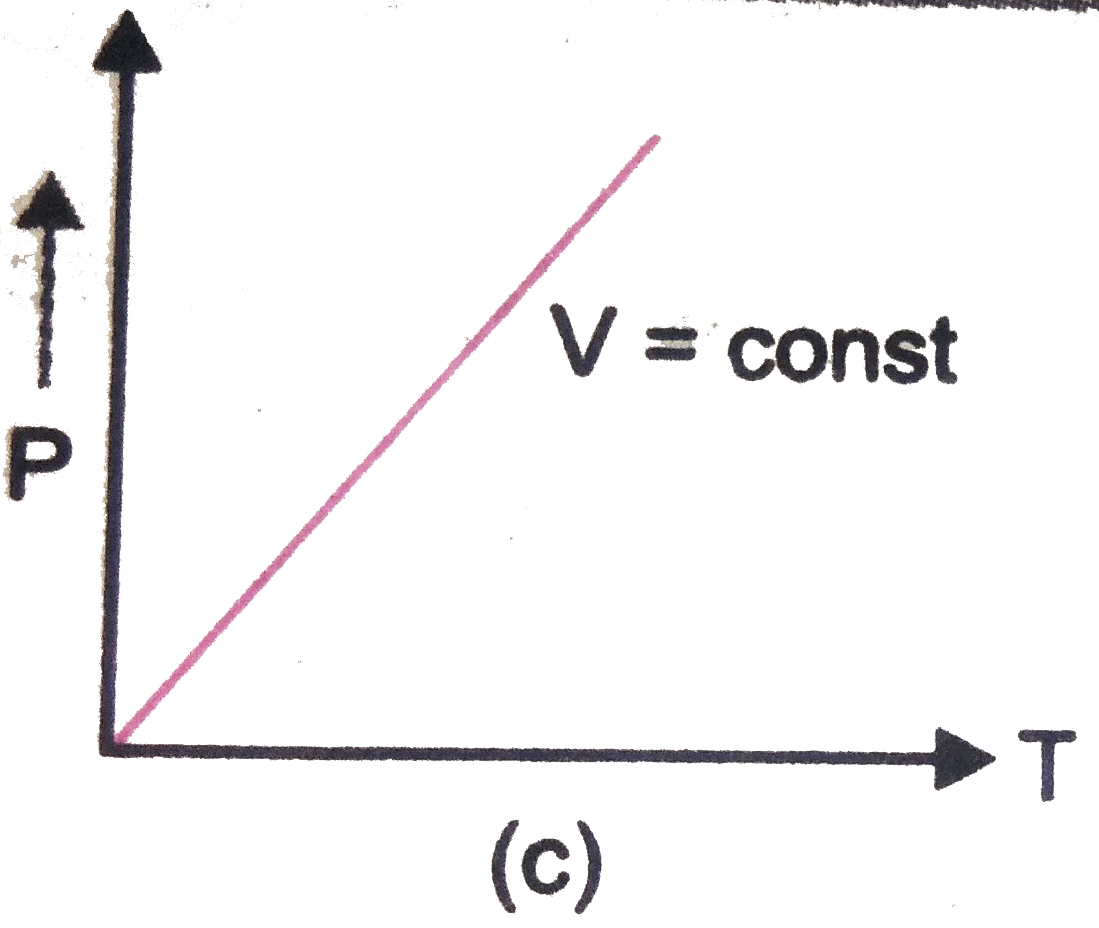 D
D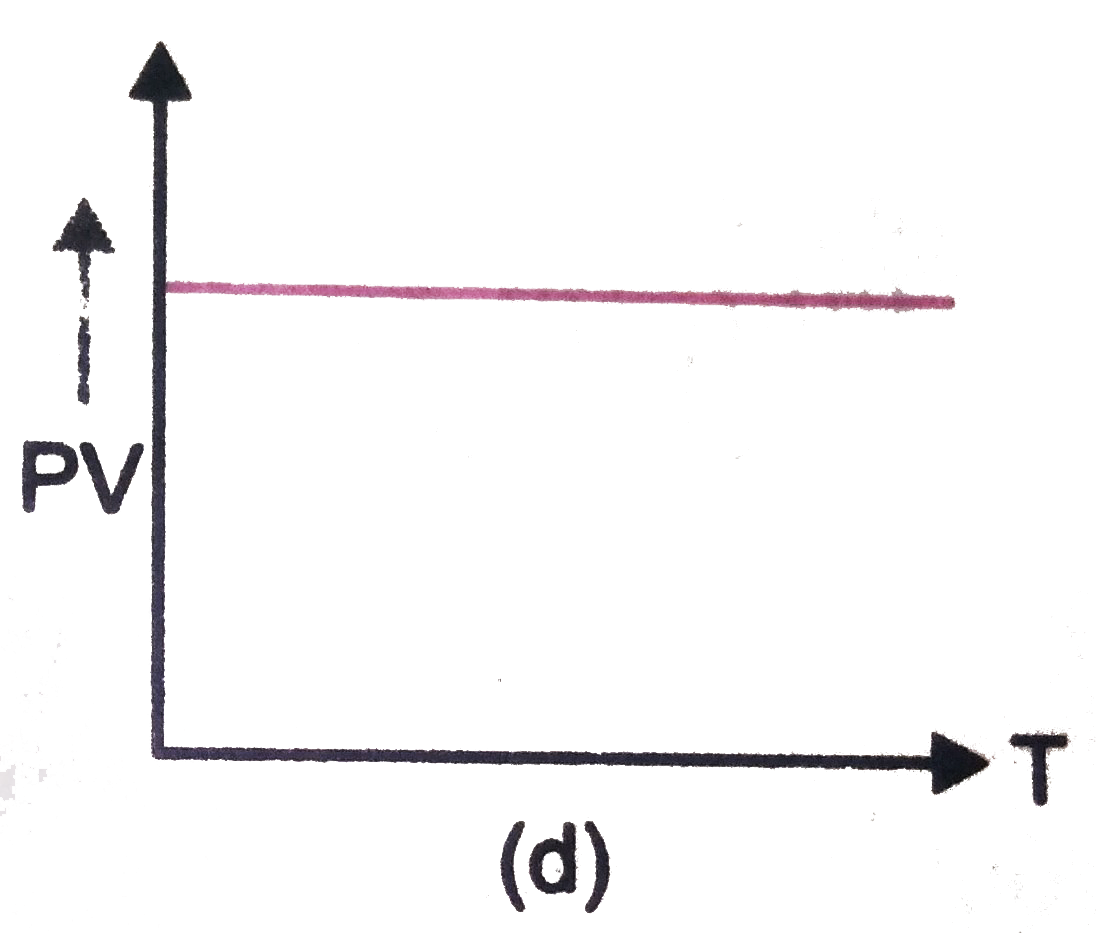
Which of the following graphs is consistent with ideal gas behaviour?
A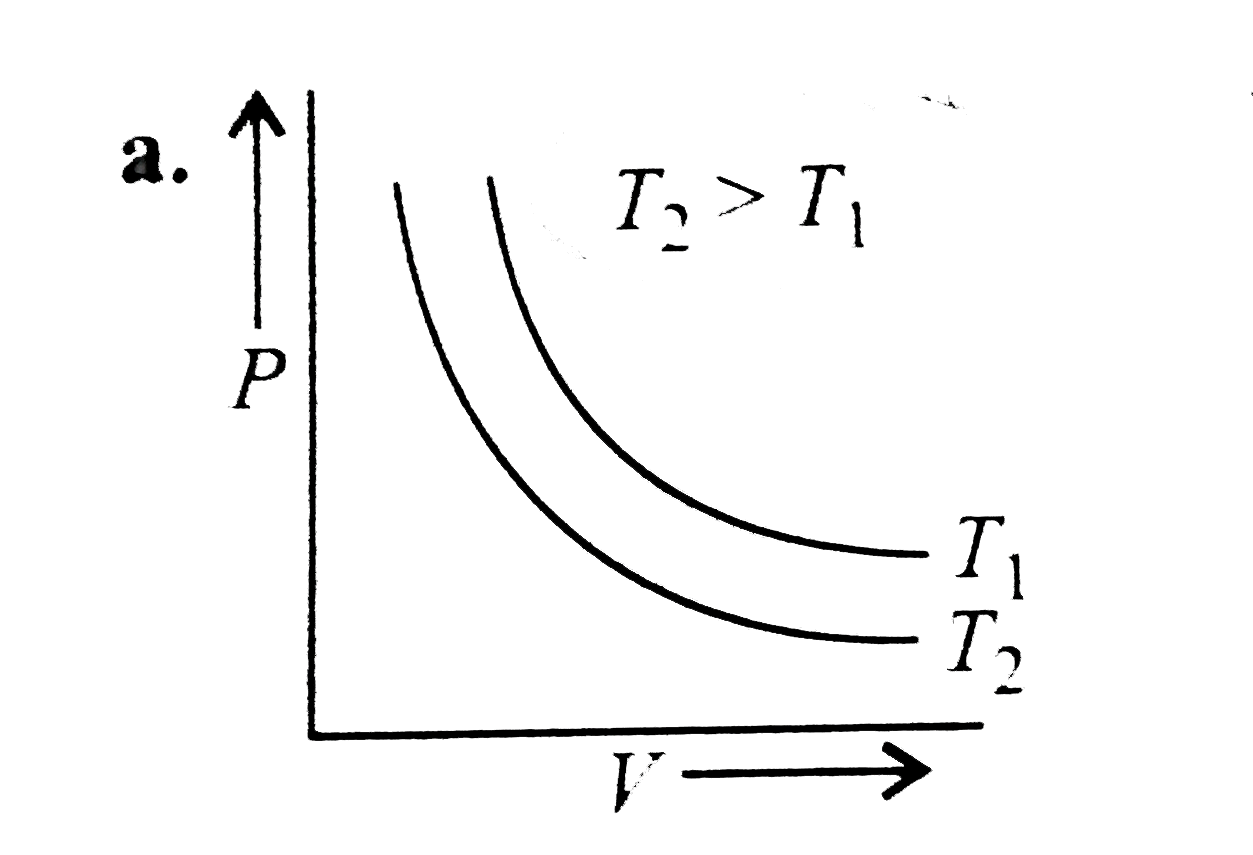 B
B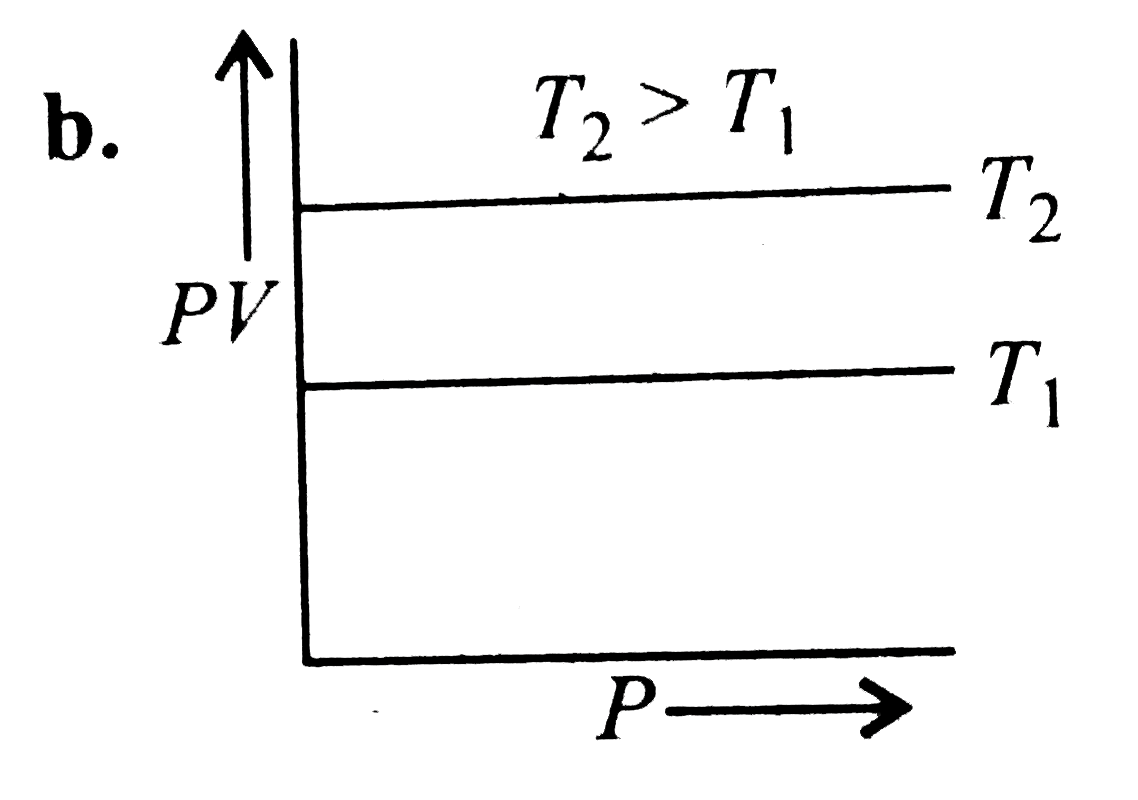 C
C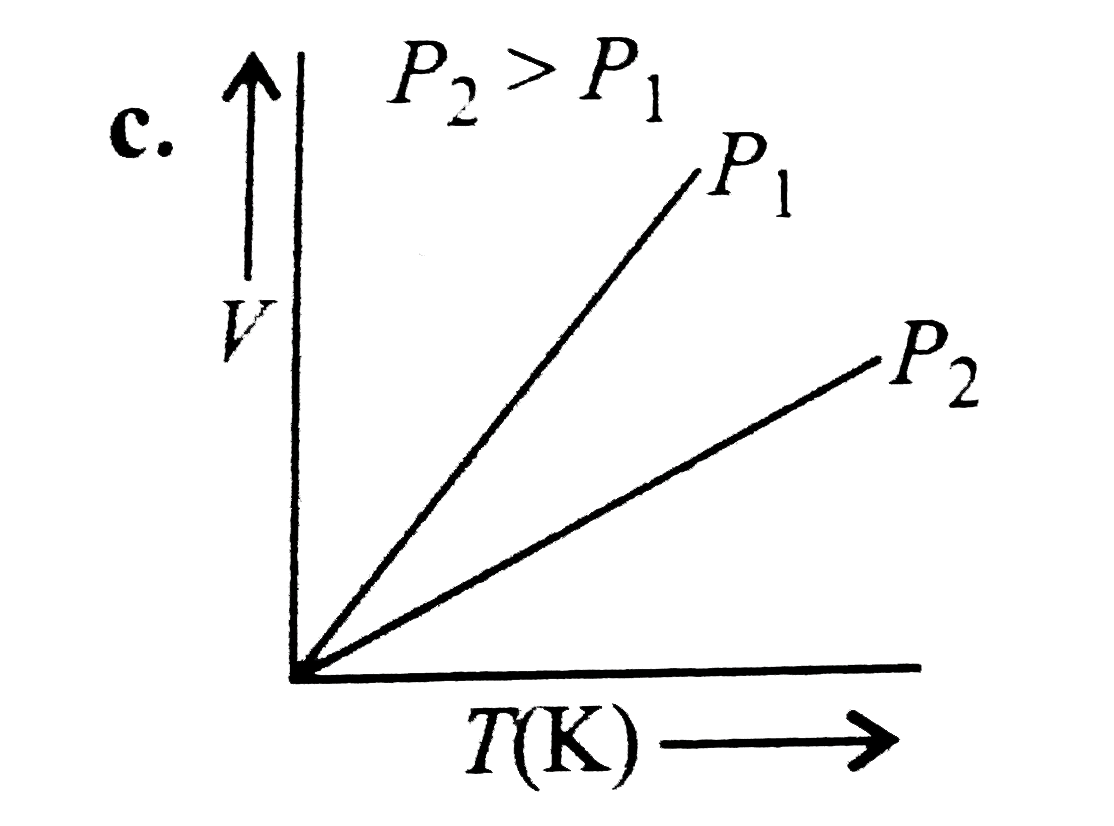 D
D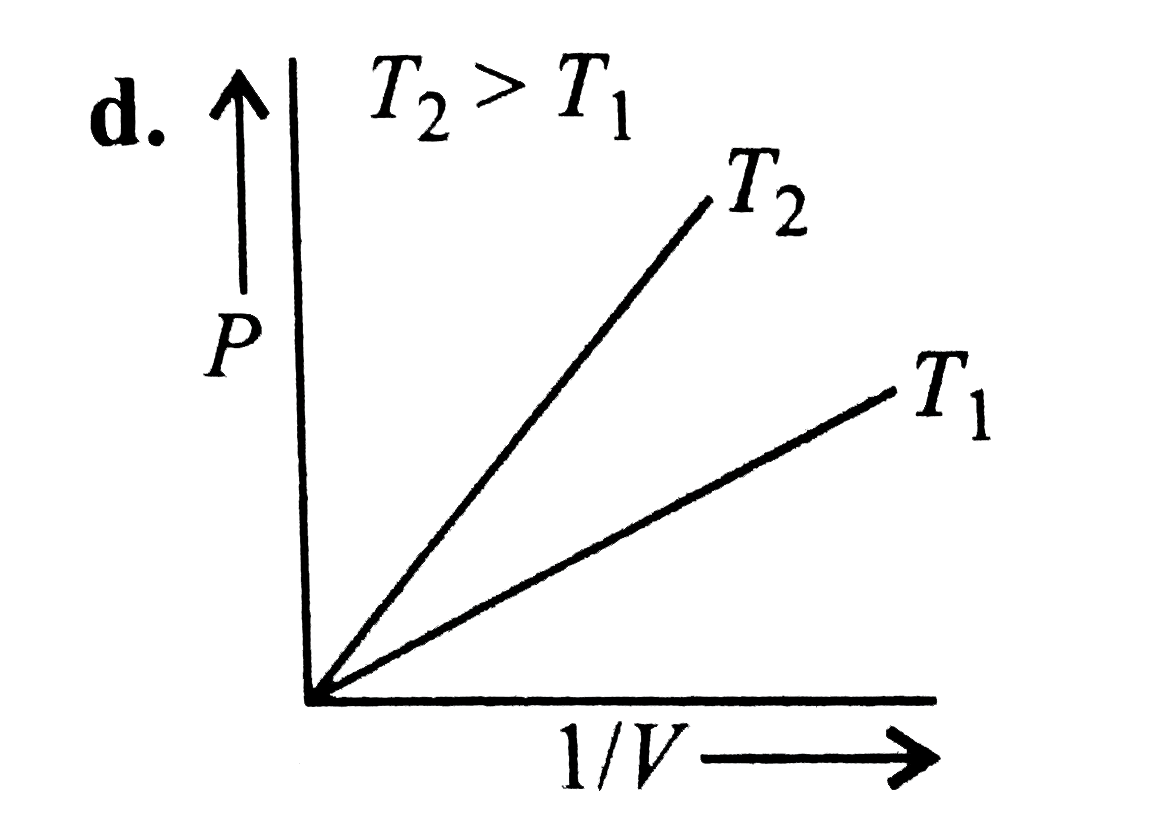
Which of the following graphs is inconsistent with ideal gas behaviour ? (Assume n = constant)
A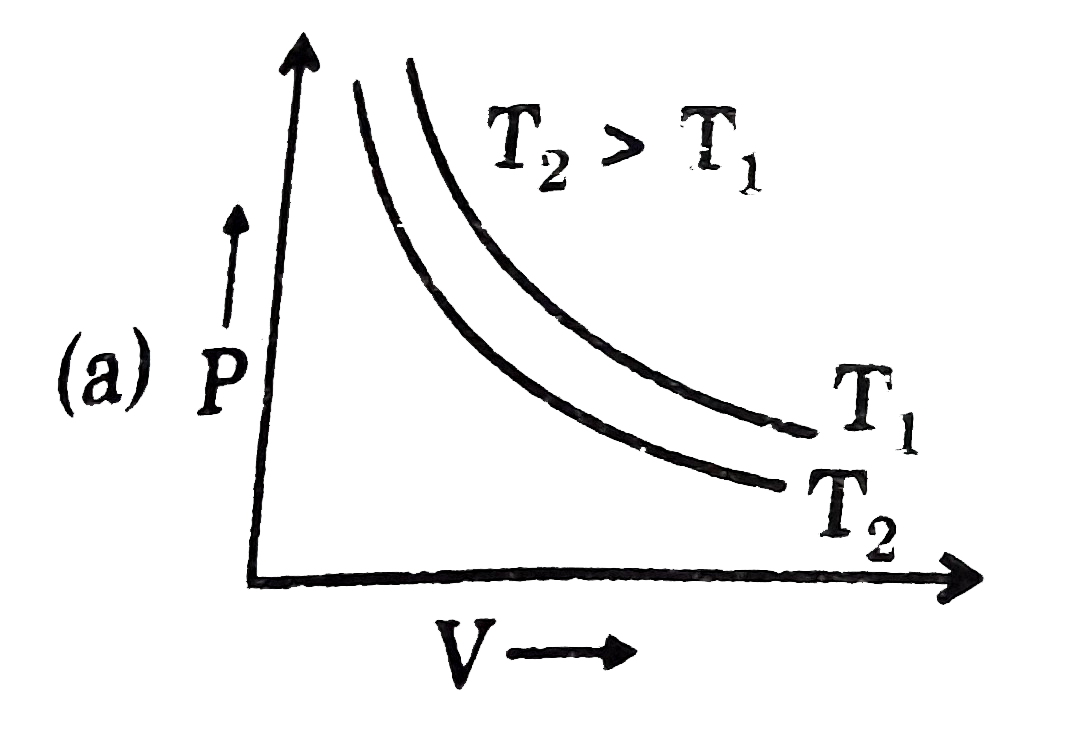 B
B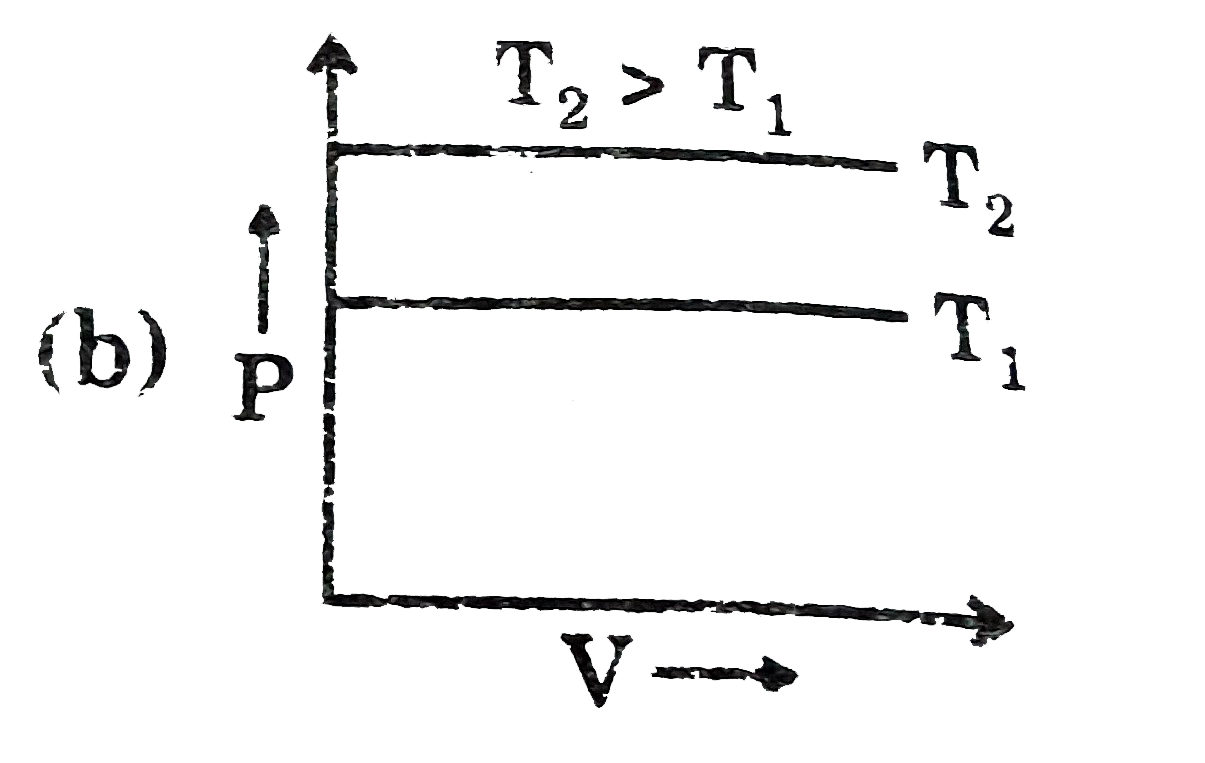 C
C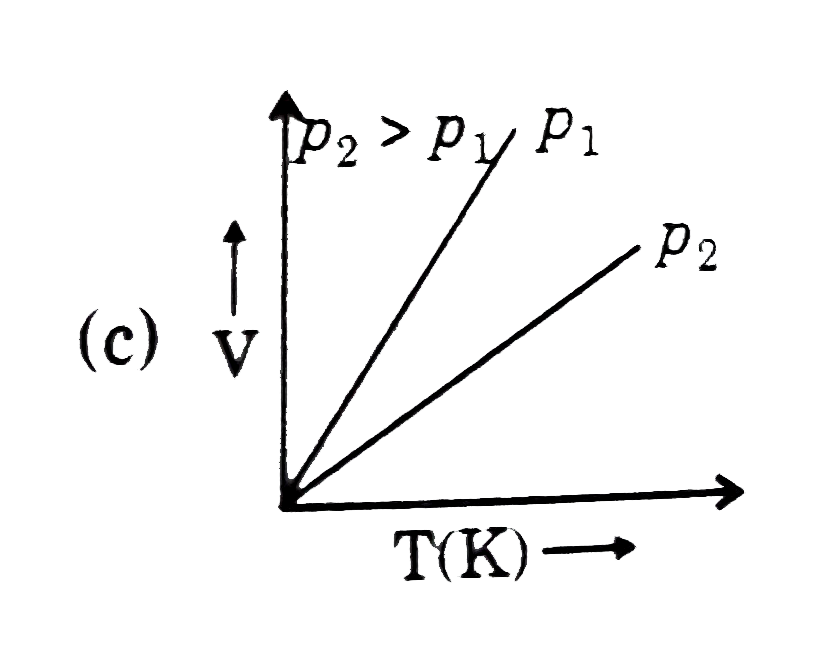 D
D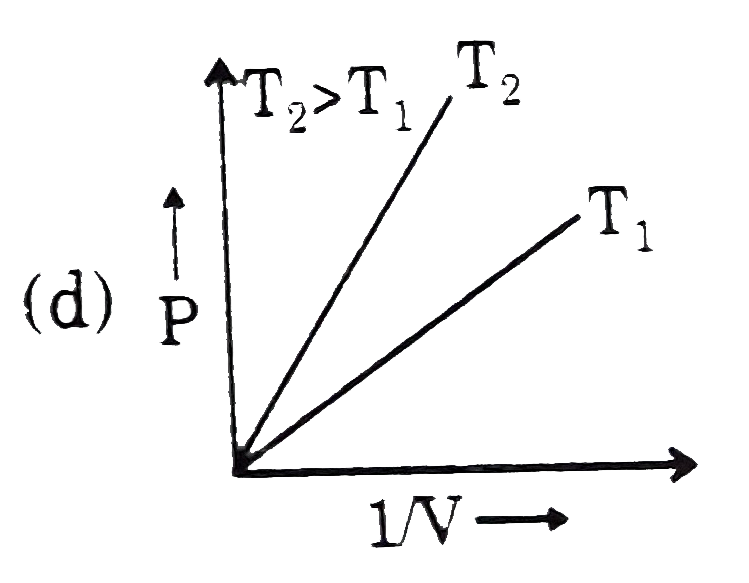
Which one of the following graphs correctly gives the ideal gas behaviour ?
View SolutionWhich of the following measure the deviation from ideal behaviour of gas?
View SolutionWhich of the following diagram correctly depicts the ralation between AC and MC ?
View SolutionWhich of the following reaction depicts the oxidsing behaviour of H2SO4?
View SolutionWhich of the following diagram correctly depicts the relationship between TC,TFC and TVC ?
View Solution
