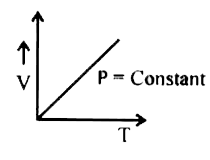
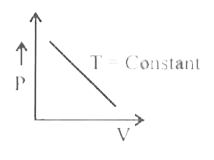
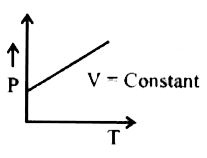
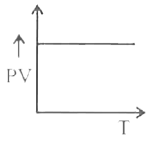
Which one of the following graphs correctly gives the ideal gas behaviour ?
A
B
C
D
Video Solution
Text Solution
The correct Answer is:A
For an ideal gas, PV = nRT. …(1)
(a) When P is kept constant, V∝T.
∴ The (V, T) graph is a straight line passing through the origin. (a) is correct.
(b) When T is kept constant, PV = constant … from (1)
∴ The P - V graph is a rectangular hyperbola. (b) is wrong.
(c) When V is constant, P∝T. The (P - T) graph is a straight line passing through the origin. (c) is wrong.
(d) From (1), PV∝T.
∴ The graph of PV against T is a straight line passing through O. (d) is wrong.
Thus , only (a) is correct.
|
Topper's Solved these Questions
- KINETIC THEORY OF GASES ,THERMODYNAMICS AND RADIATIONBook:MARVEL PUBLICATIONChapter:KINETIC THEORY OF GASES ,THERMODYNAMICS AND RADIATIONExercise:TEST YOUR GRASP - 9
Explore 30 Videos
- INTERFERENCE AND DIFFRACTIONBook:MARVEL PUBLICATIONChapter:INTERFERENCE AND DIFFRACTIONExercise:TEST YOUR GRASP
Explore 20 Videos
- MAGNETIC EFFECTS OF ELECTRIC CURRENTBook:MARVEL PUBLICATIONChapter:MAGNETIC EFFECTS OF ELECTRIC CURRENTExercise:MCQ
Explore 195 Videos
Similar Questions
Knowledge Check
Which of the following graph is correctly represented?
A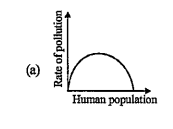 B
B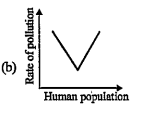 C
C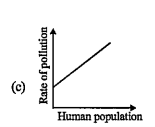 D
D
Which of the following graphs is inconsistent with ideal gas behaviour ? (Assume n = constant)
A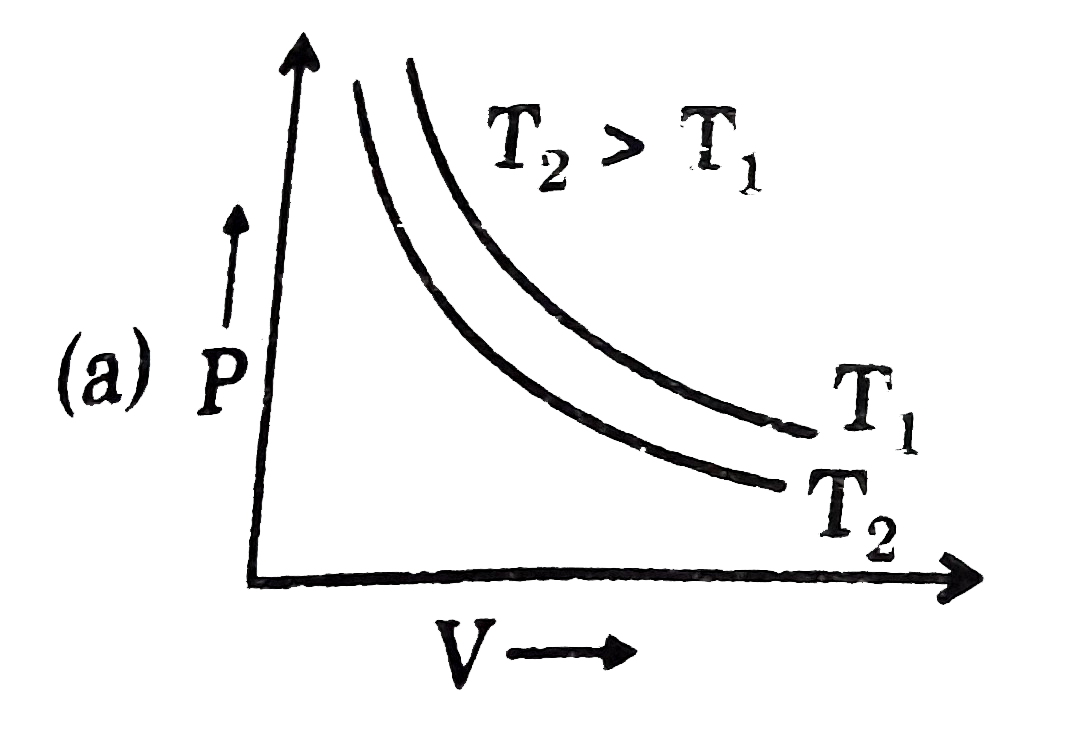 B
B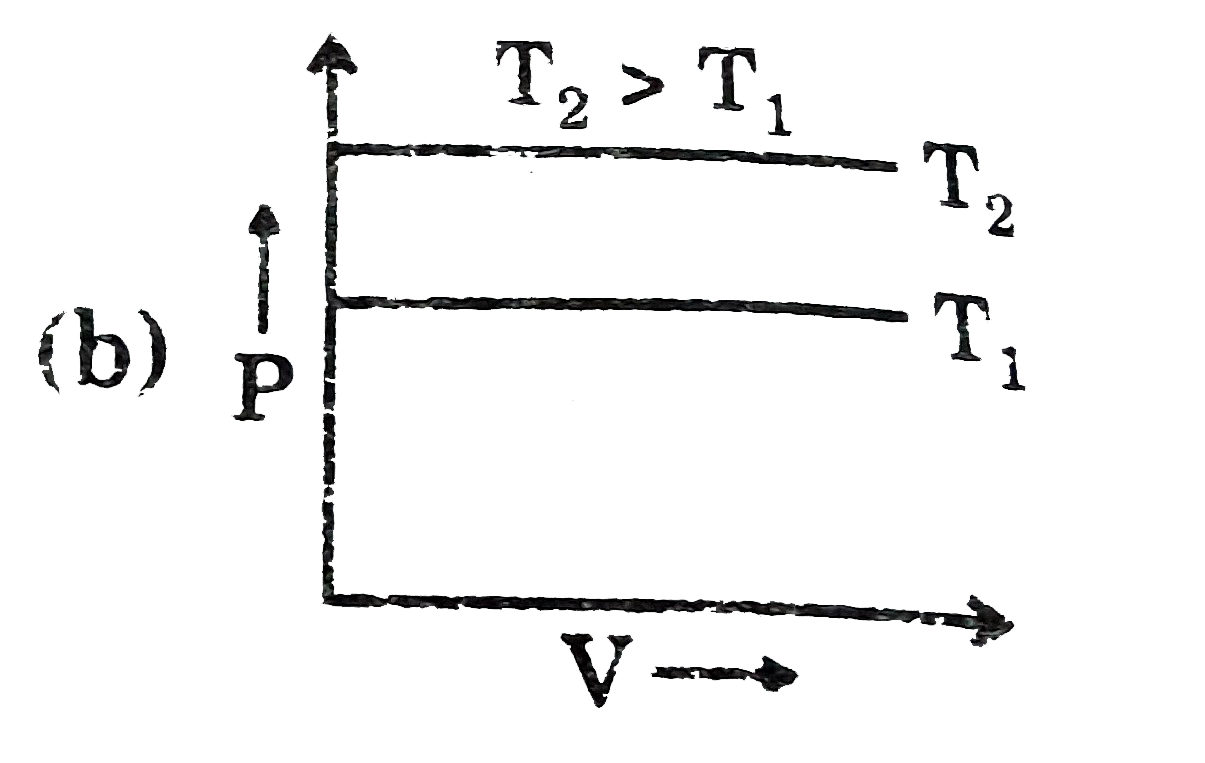 C
C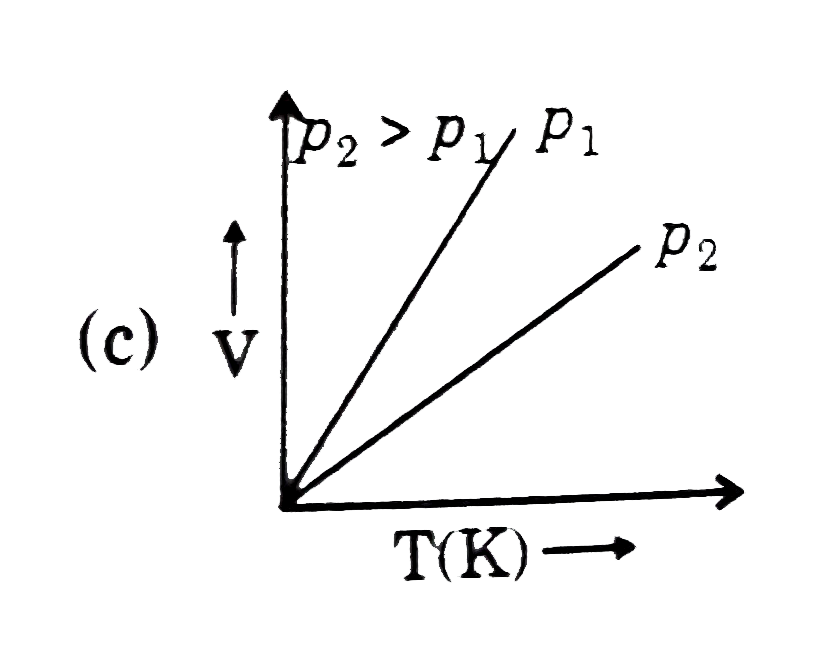 D
D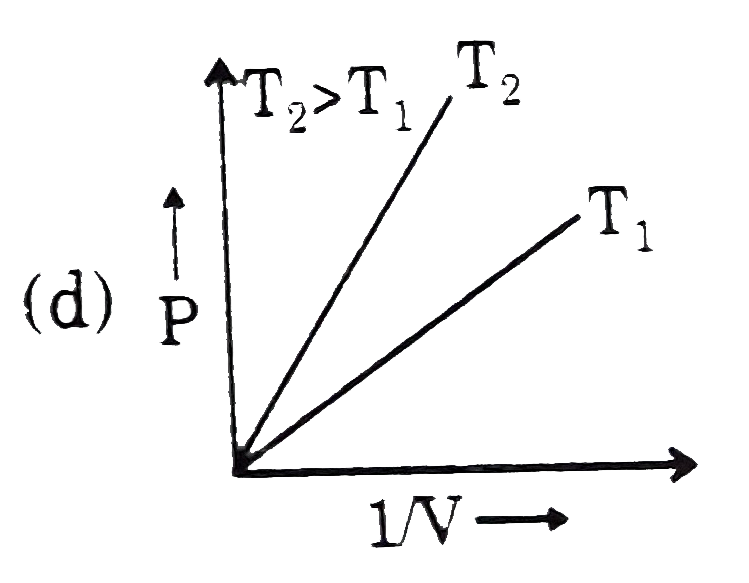
Which of the following graphs is consistent with ideal gas behaviour?
A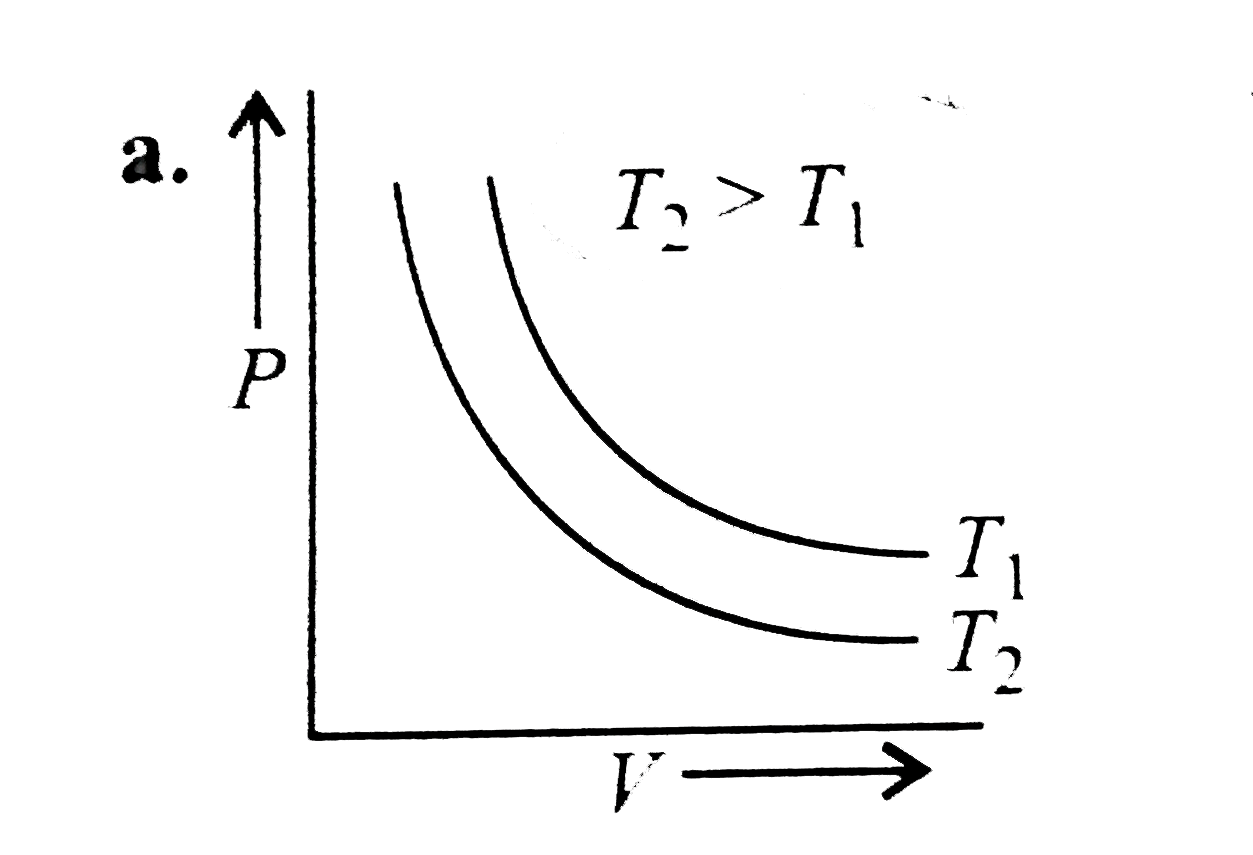 B
B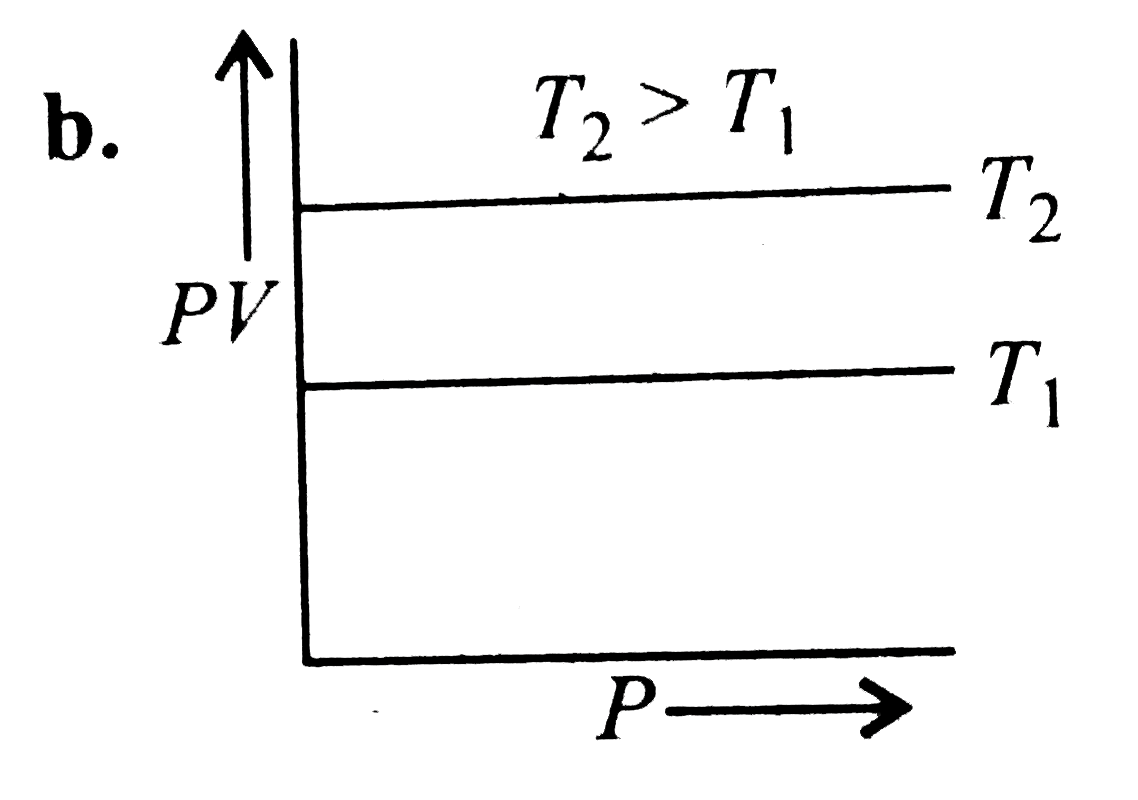 C
C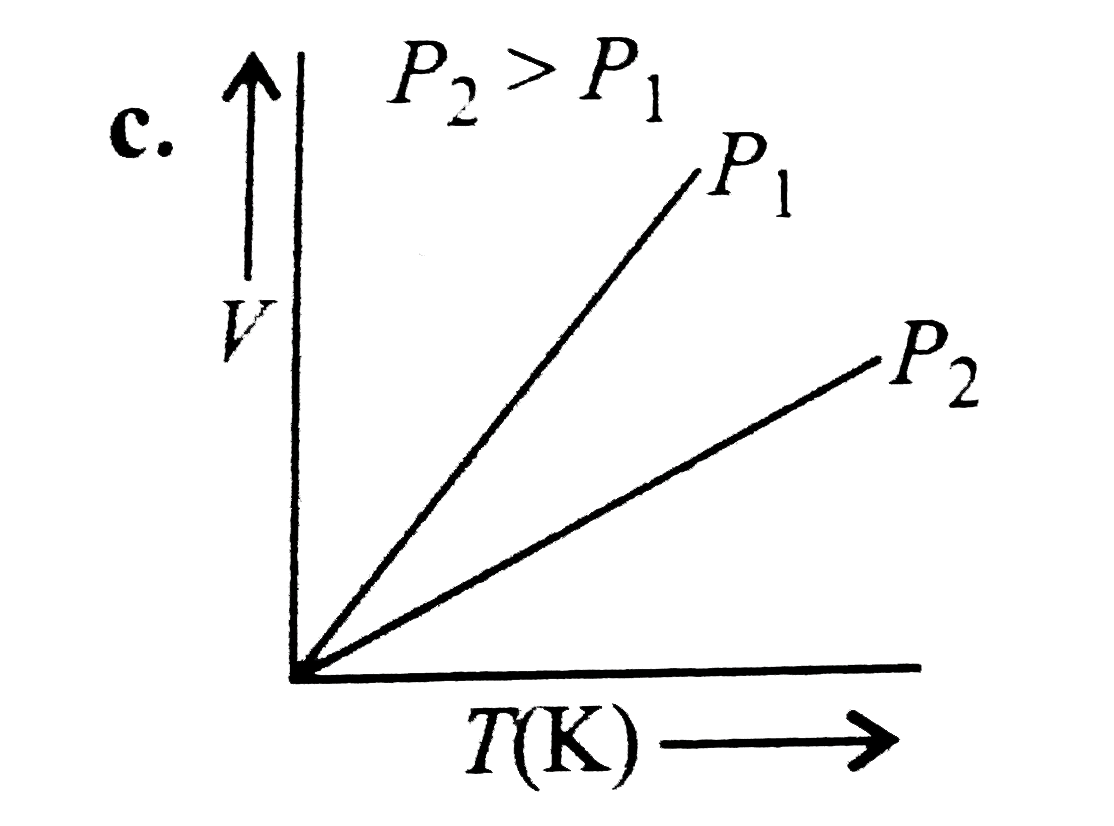 D
D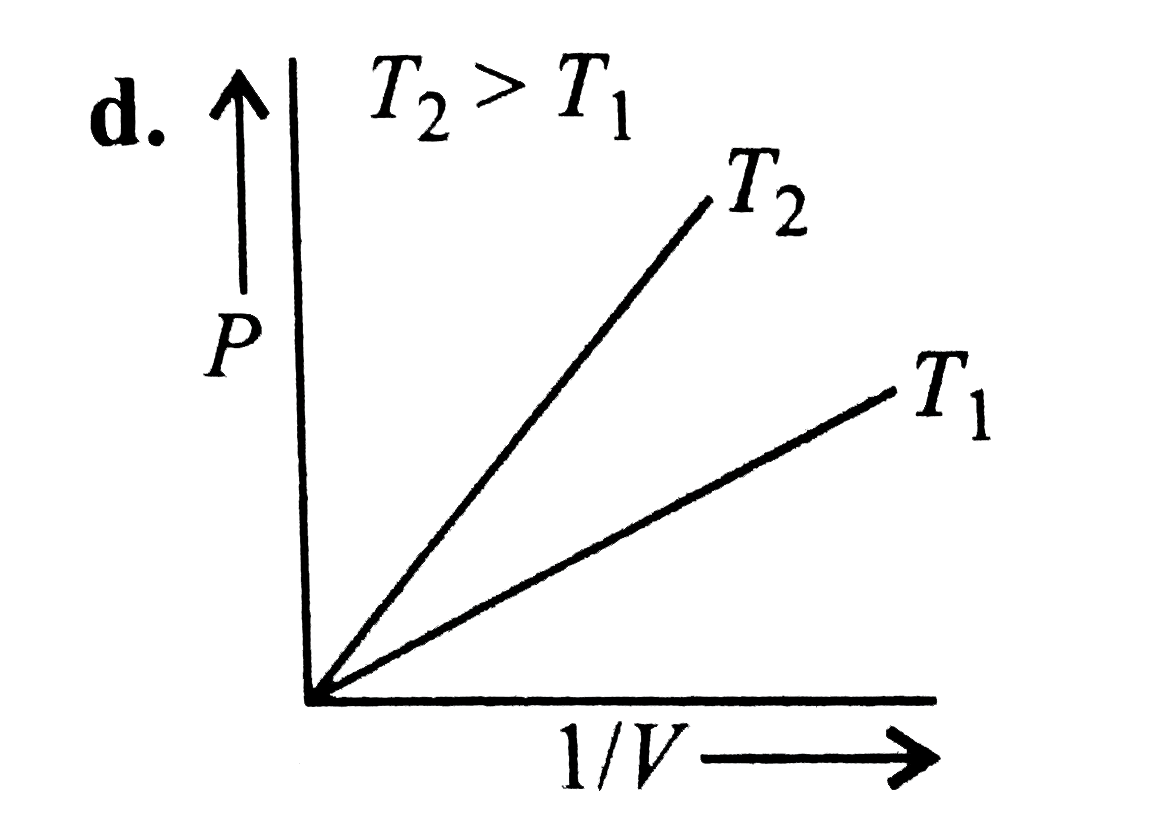
Which of the following diagrams, Fig. depicts ideal gas behaviour ?
View SolutionWhich of the following diagram correctly describes the behaviour of a fixed mass of an ideal gas ? (T is measured in K)
View SolutionWhich of the following graphs correctly represents the variation of β=−(dVdP)/V with P for an ideal gas at constant temperature
View SolutionWhich of the following graphs correctly represents the variation of β=−dV/dPV
with P for an ideal gas at constant temperature?
View SolutionWhich of the following graphs correctly represents the variation of β=−(dVdP)1V with P for an ideal gas at constant temperature ?
View Solution


