Which of the following diagrams, Fig. depicts ideal gas behaviour ?
The correct Answer is:A, C
To determine which diagrams depict ideal gas behavior, we will analyze each option based on the relationships defined by the ideal gas law, PV=nRT.
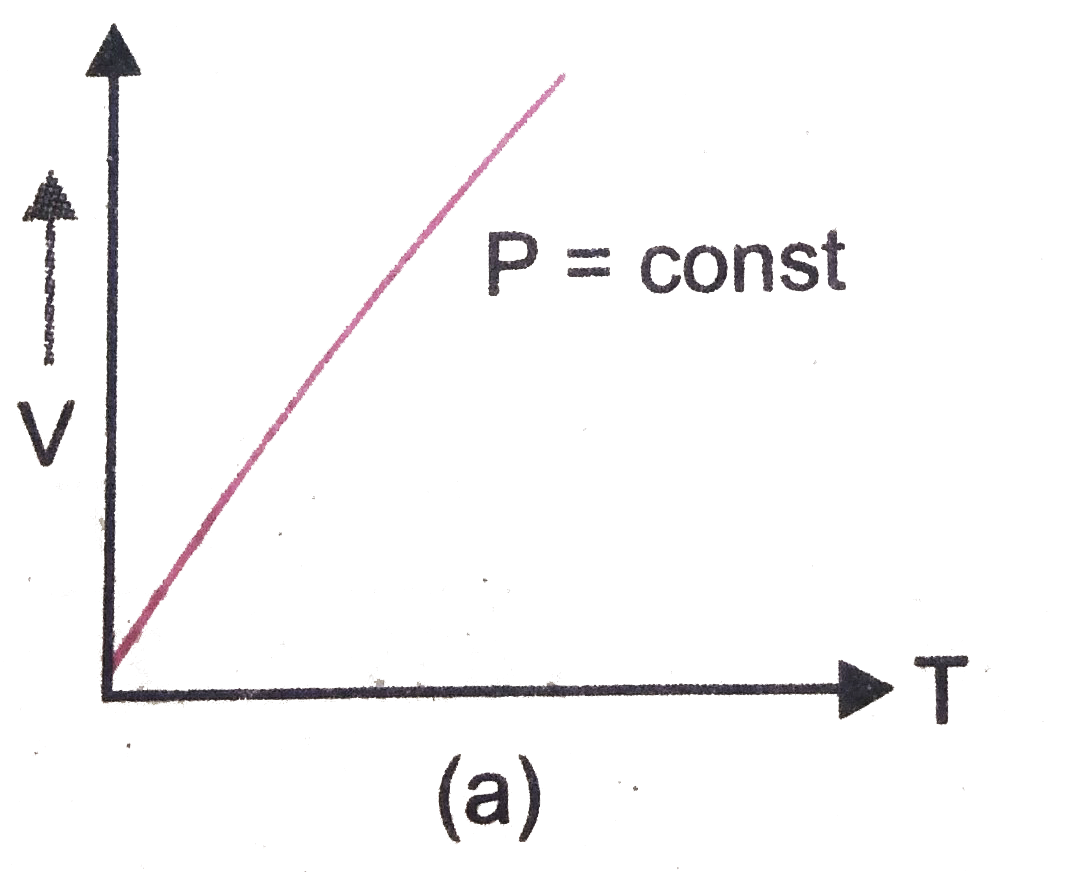
1. Analyze Diagram A:
- Diagram A shows the relationship between volume (V) and temperature (T) at constant pressure (P).
- According to the ideal gas law, V∝T when pressure is constant.
- Therefore, as temperature increases, volume also increases, which is consistent with ideal gas behavior.
- Conclusion: Diagram A depicts ideal gas behavior.
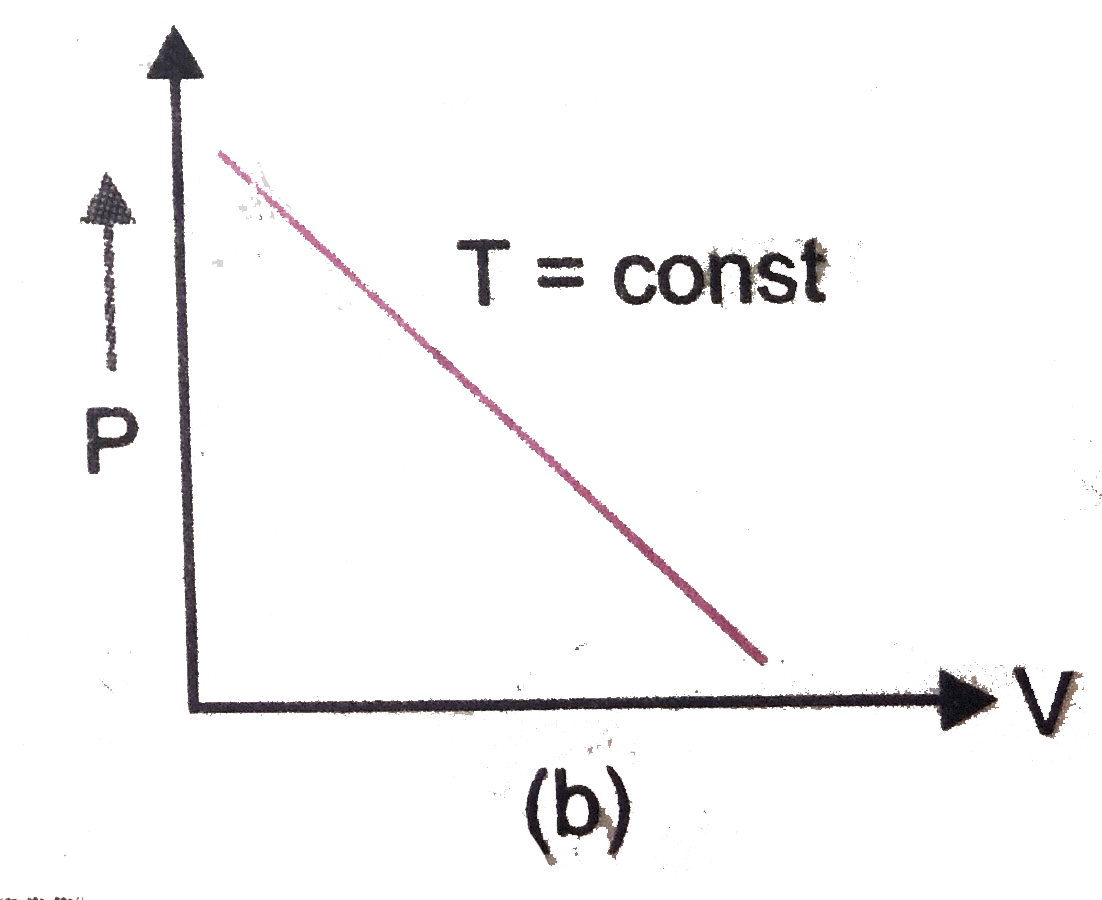
2. Analyze Diagram B:
- Diagram B shows the relationship between pressure (P) and volume (V) at constant temperature (T).
- According to the ideal gas law, PV=constant when temperature is constant, which implies P∝1V.
- The graph should be a hyperbola, indicating that as volume increases, pressure decreases.
- Conclusion: Diagram B does not depict ideal gas behavior as it does not show the expected hyperbolic relationship.
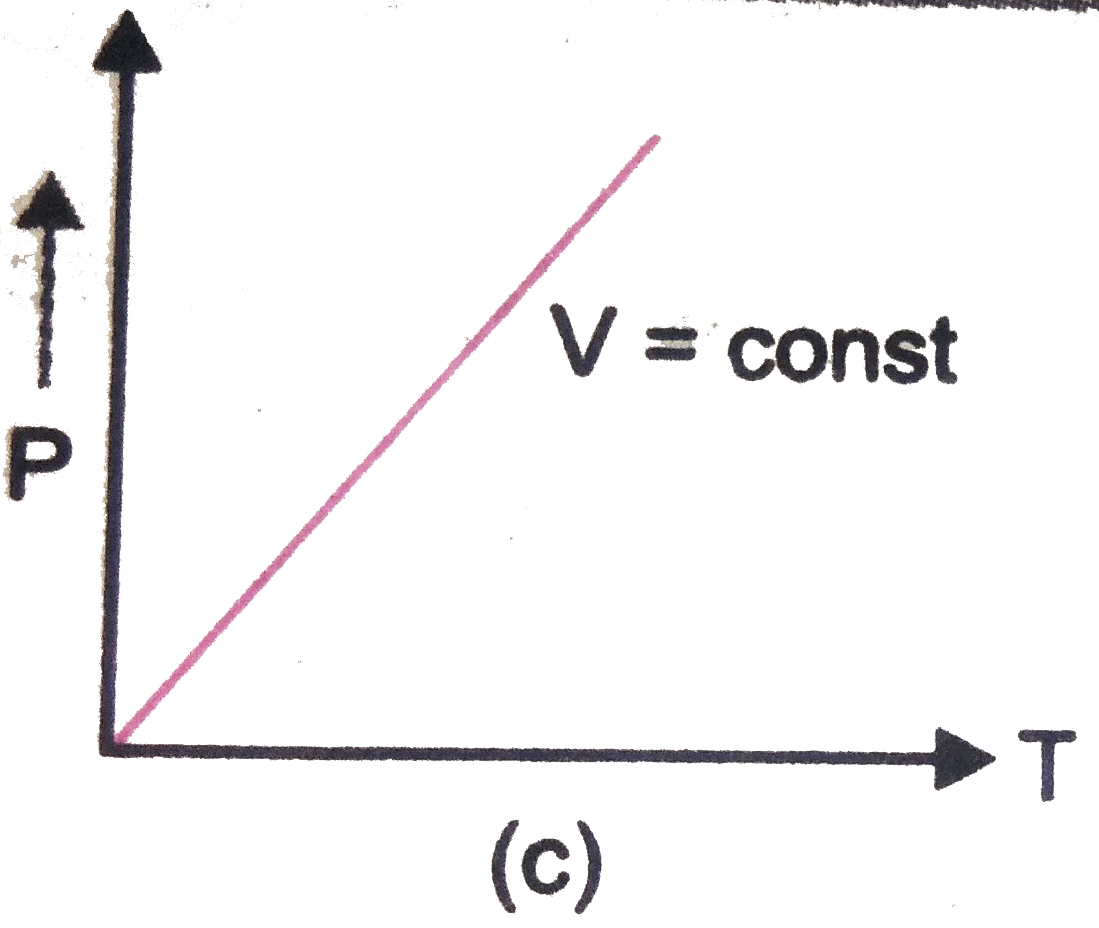
3. Analyze Diagram C:
- Diagram C shows the relationship between pressure (P) and temperature (T) at constant volume (V).
- According to the ideal gas law, P∝T when volume is constant.
- Therefore, as temperature increases, pressure also increases, which is consistent with ideal gas behavior.
- Conclusion: Diagram C depicts ideal gas behavior.
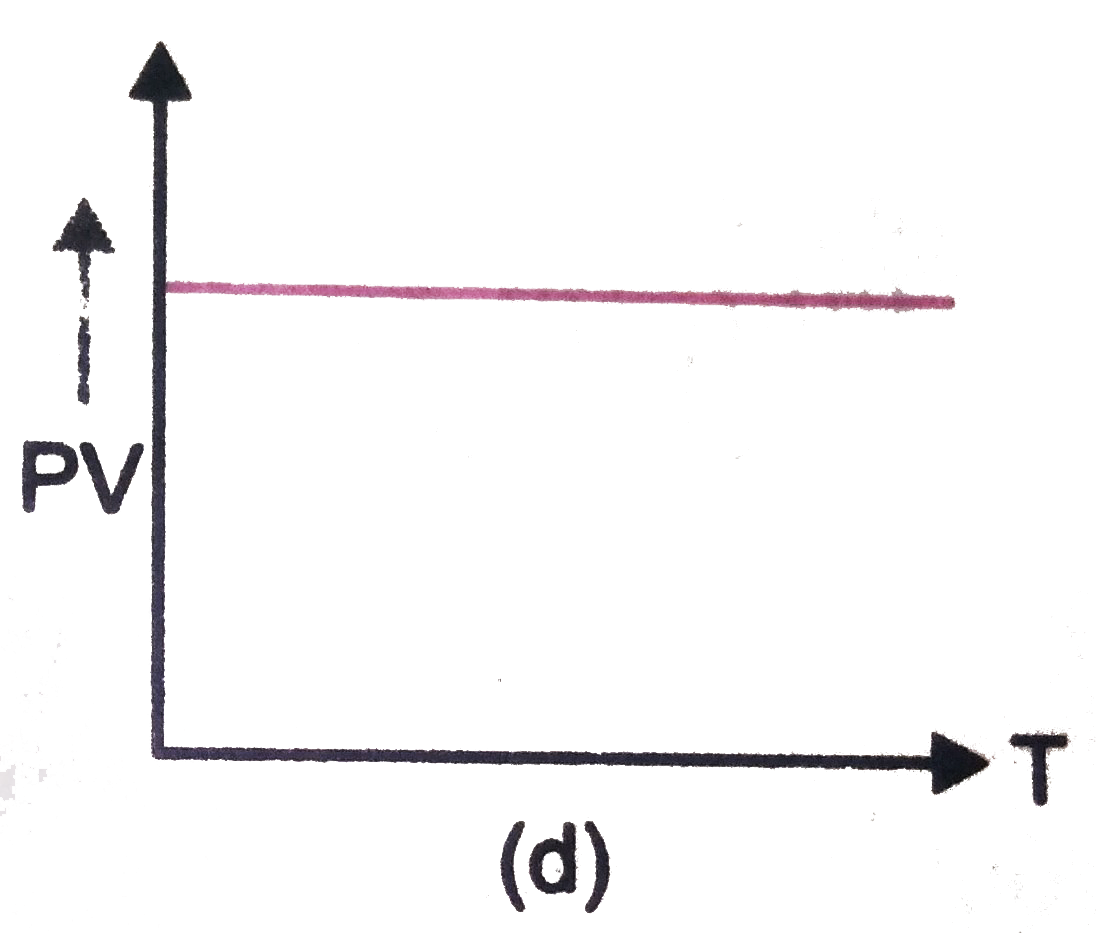
4. Analyze Diagram D:
- Diagram D shows the relationship between the product of pressure and volume (PV) and temperature (T).
- According to the ideal gas law, PV=nRT, which implies that PV∝T.
- The graph should be a straight line passing through the origin, indicating a direct proportionality.
- However, if the graph does not appear linear, it suggests a deviation from ideal gas behavior.
- Conclusion: Diagram D does not depict ideal gas behavior.
Final Answer:
- The diagrams that depict ideal gas behavior are Diagram A and Diagram C.
---
- Diagram A shows the relationship between volume (V) and temperature (T) at constant pressure (P).
- According to the ideal gas law, V∝T when pressure is constant.
- Therefore, as temperature increases, volume also increases, which is consistent with ideal gas behavior.
- Conclusion: Diagram A depicts ideal gas behavior.
- Diagram B shows the relationship between pressure (P) and volume (V) at constant temperature (T).
- According to the ideal gas law, PV=constant when temperature is constant, which implies P∝1V.
- The graph should be a hyperbola, indicating that as volume increases, pressure decreases.
- Conclusion: Diagram B does not depict ideal gas behavior as it does not show the expected hyperbolic relationship.
- Diagram C shows the relationship between pressure (P) and temperature (T) at constant volume (V).
- According to the ideal gas law, P∝T when volume is constant.
- Therefore, as temperature increases, pressure also increases, which is consistent with ideal gas behavior.
- Conclusion: Diagram C depicts ideal gas behavior.
- Diagram D shows the relationship between the product of pressure and volume (PV) and temperature (T).
- According to the ideal gas law, PV=nRT, which implies that PV∝T.
- The graph should be a straight line passing through the origin, indicating a direct proportionality.
- However, if the graph does not appear linear, it suggests a deviation from ideal gas behavior.
- Conclusion: Diagram D does not depict ideal gas behavior.
- The diagrams that depict ideal gas behavior are Diagram A and Diagram C.
Topper's Solved these Questions
- BEHAVIOUR OF PERFECT GAS & KINETIC THEORYBOOK - PRADEEPCHAPTER - BEHAVIOUR OF PERFECT GAS & KINETIC THEORYEXERCISE - Multiple choice questions-II
8 Videos
- BEHAVIOUR OF PERFECT GAS & KINETIC THEORYBOOK - PRADEEPCHAPTER - BEHAVIOUR OF PERFECT GAS & KINETIC THEORYEXERCISE - Multiple choice questions-III
12 Videos
- BEHAVIOUR OF PERFECT GAS & KINETIC THEORYBOOK - PRADEEPCHAPTER - BEHAVIOUR OF PERFECT GAS & KINETIC THEORYEXERCISE - Problems for practice
47 Videos
- GRAVIATIONBOOK - PRADEEPCHAPTER - GRAVIATIONEXERCISE - Assertion-Reason Type Questions
19 Videos
Similar Questions
Knowledge Check
Which of the following diagrams (figure) depicts ideal gas behaviour?
A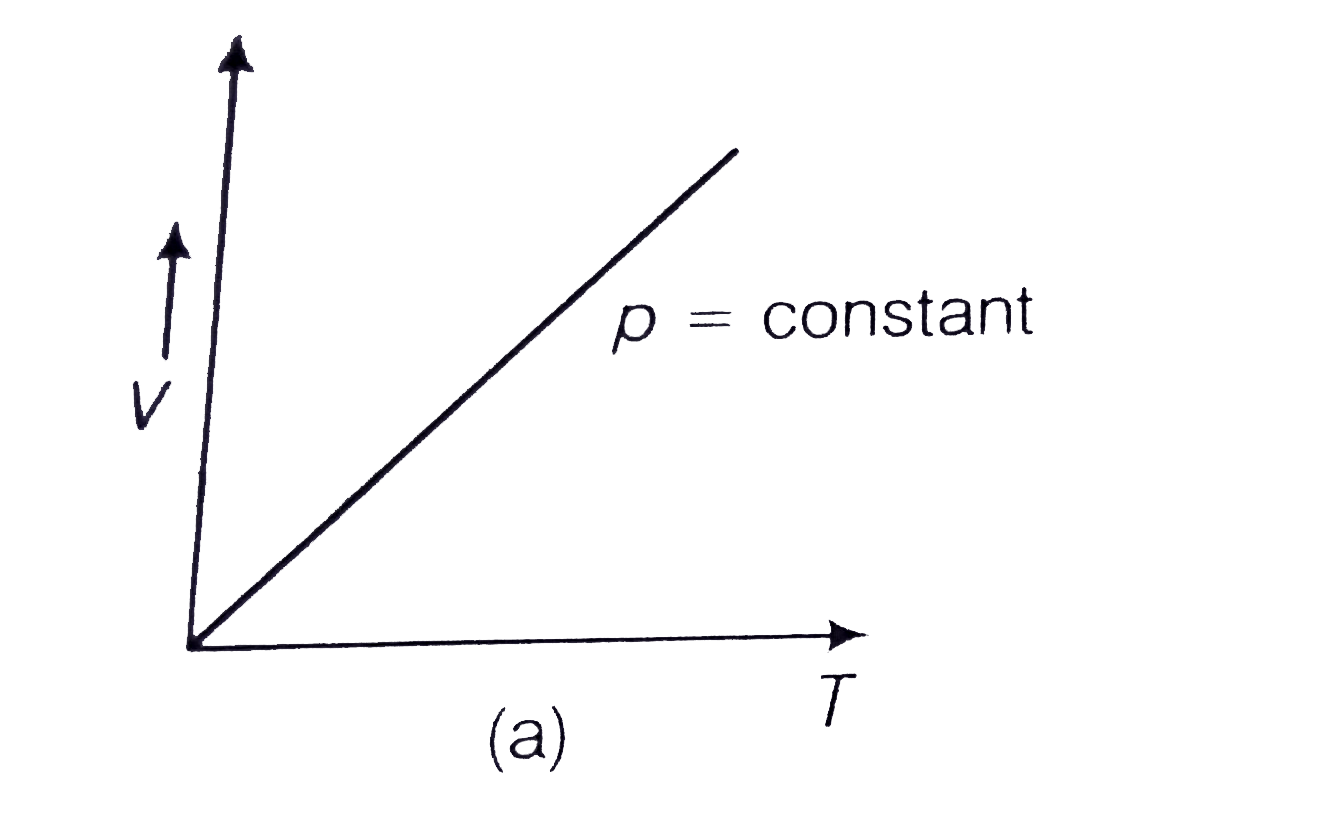 B
B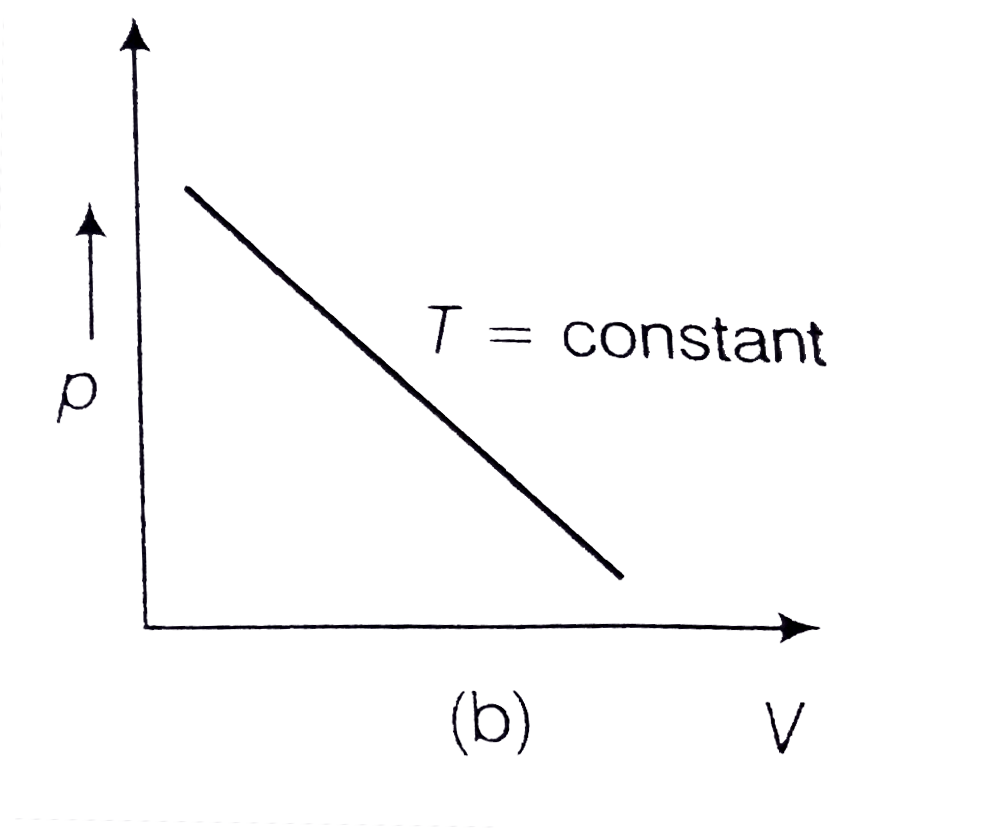 C
C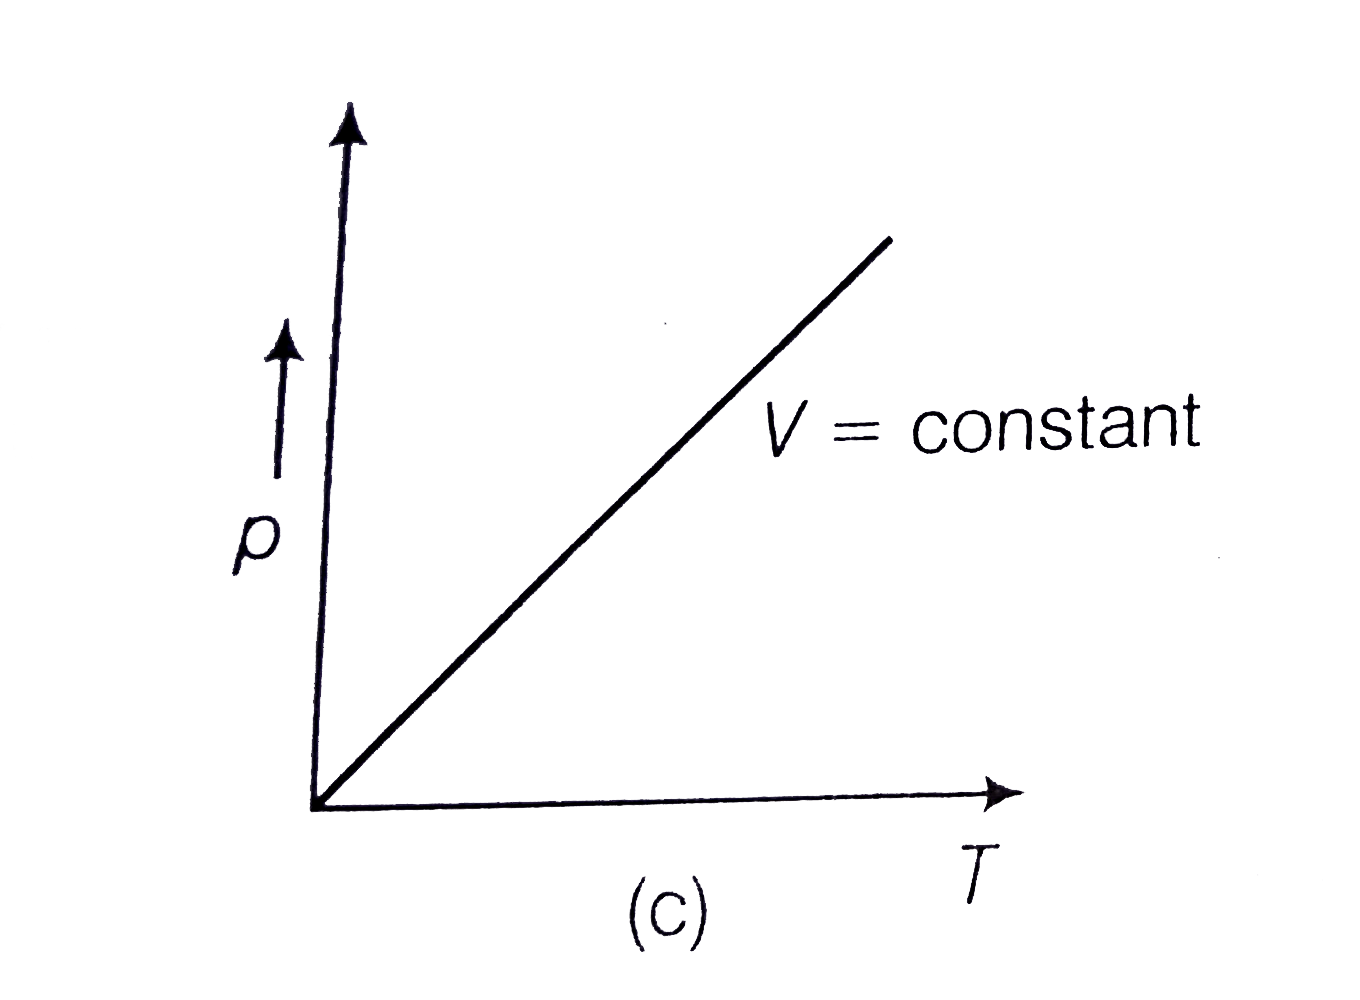 D
D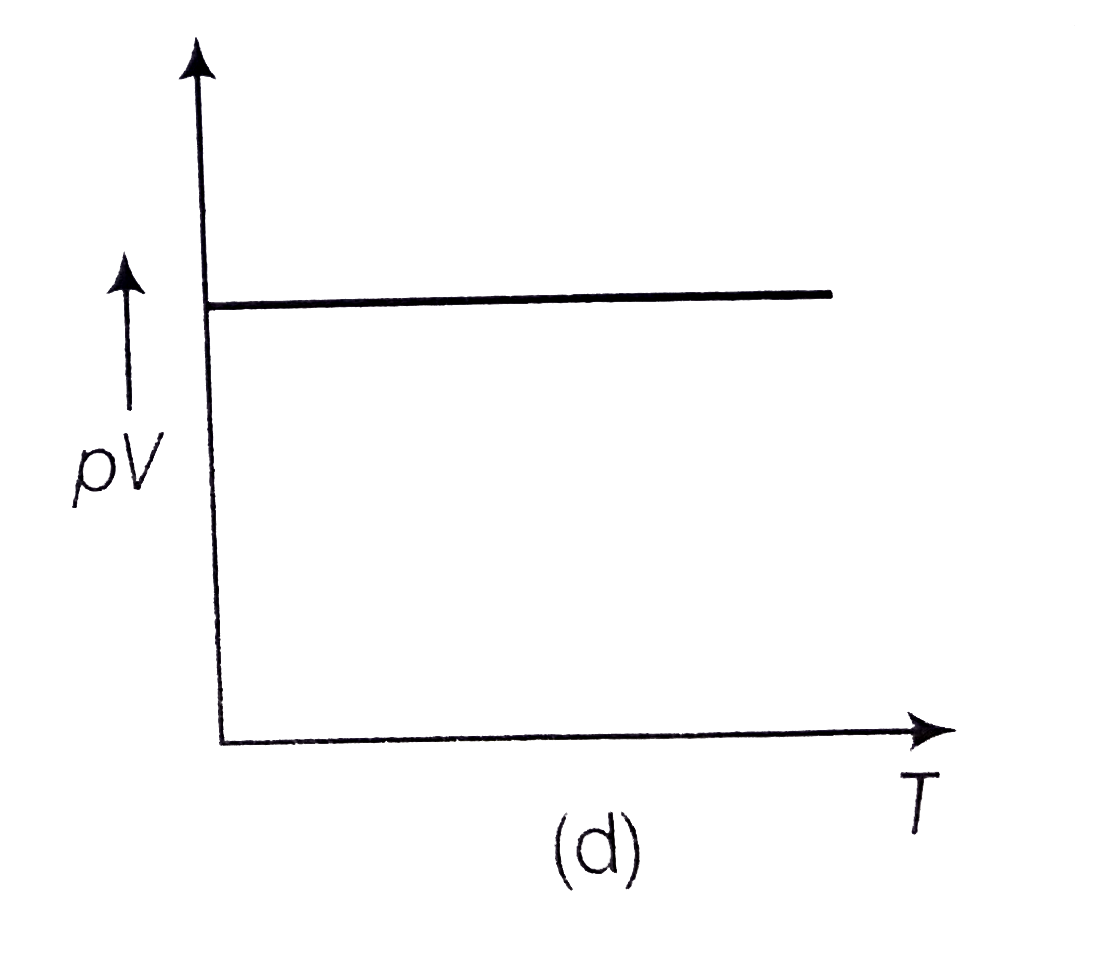
Which of the following graphs is consistent with ideal gas behaviour?
A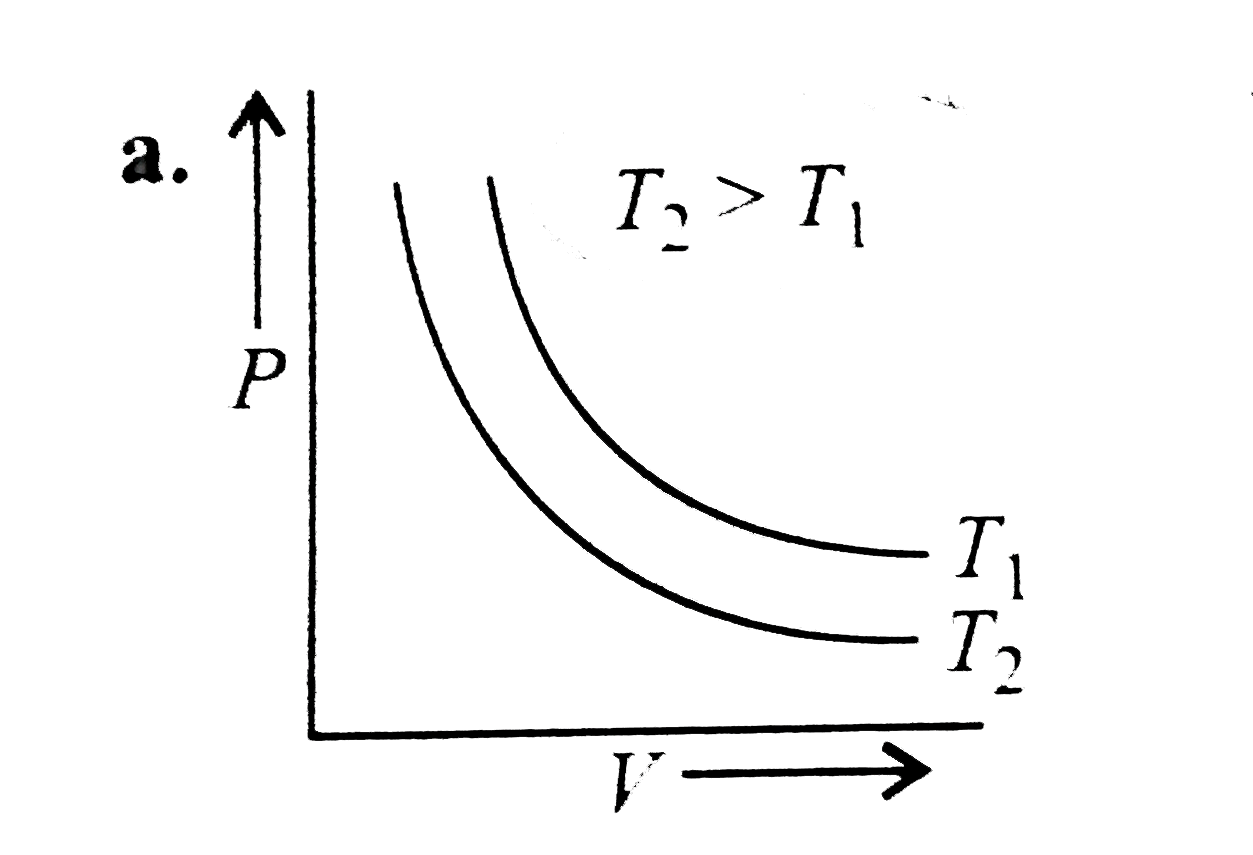 B
B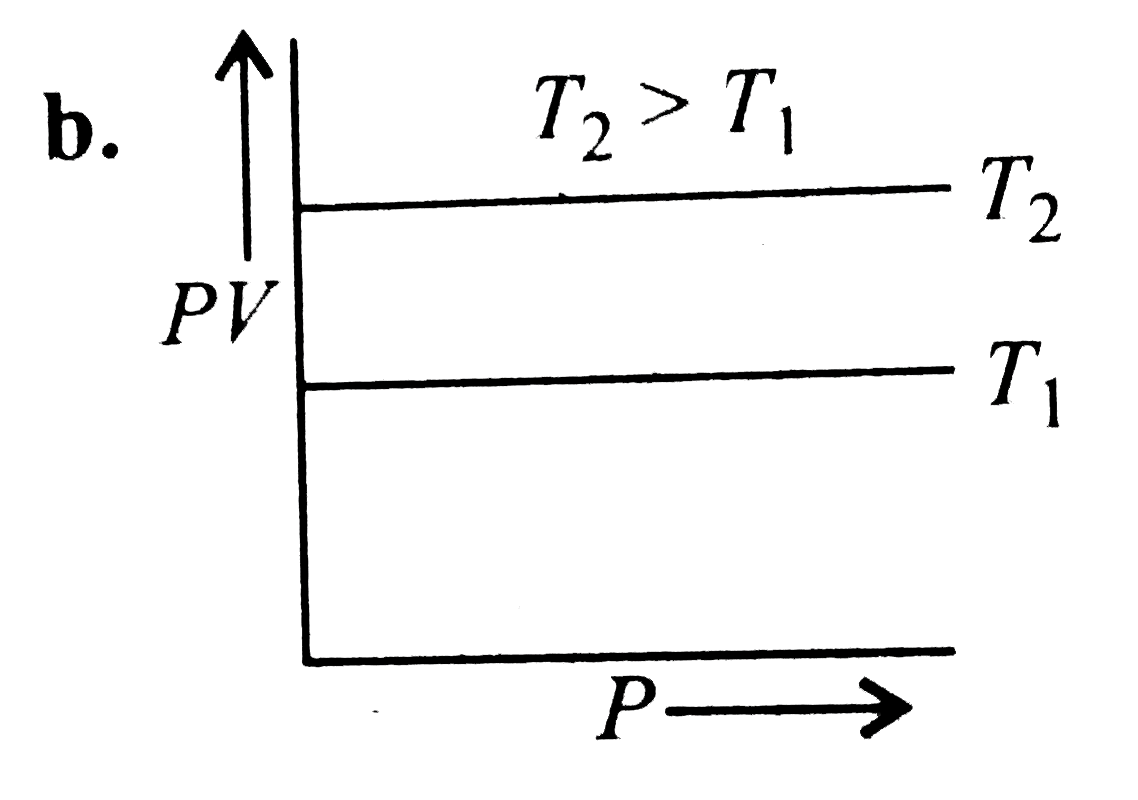 C
C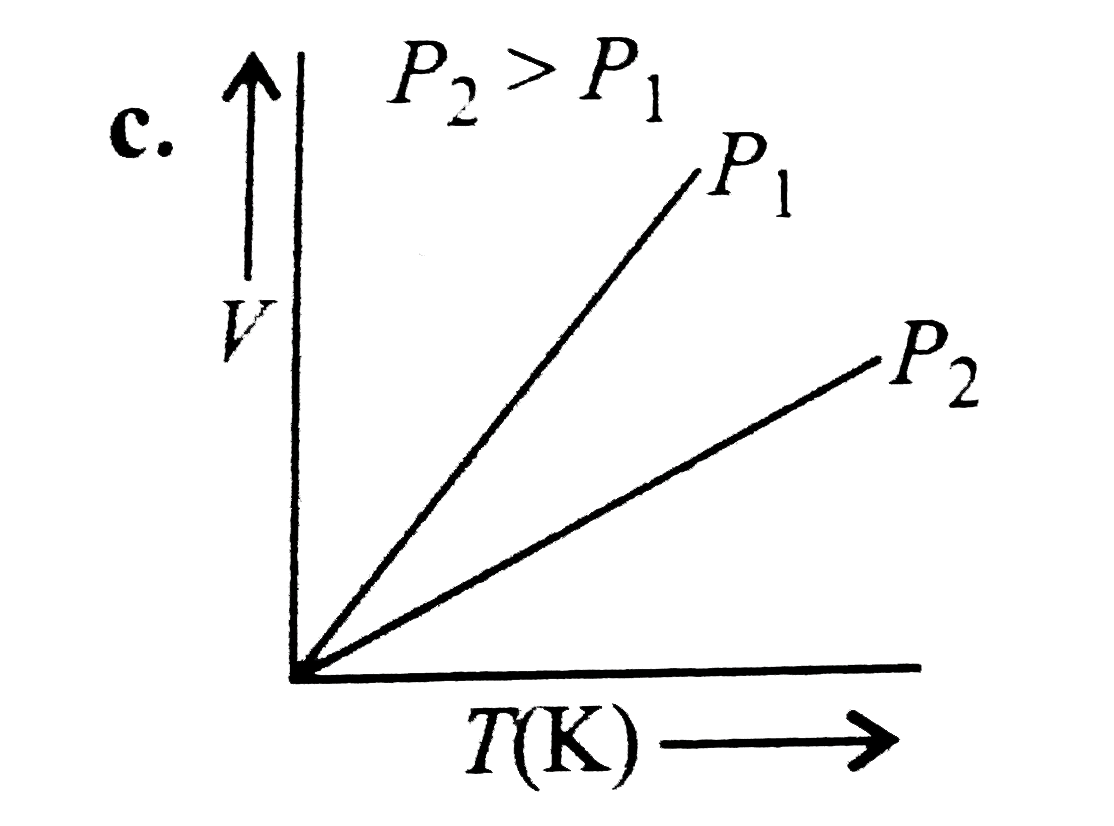 D
D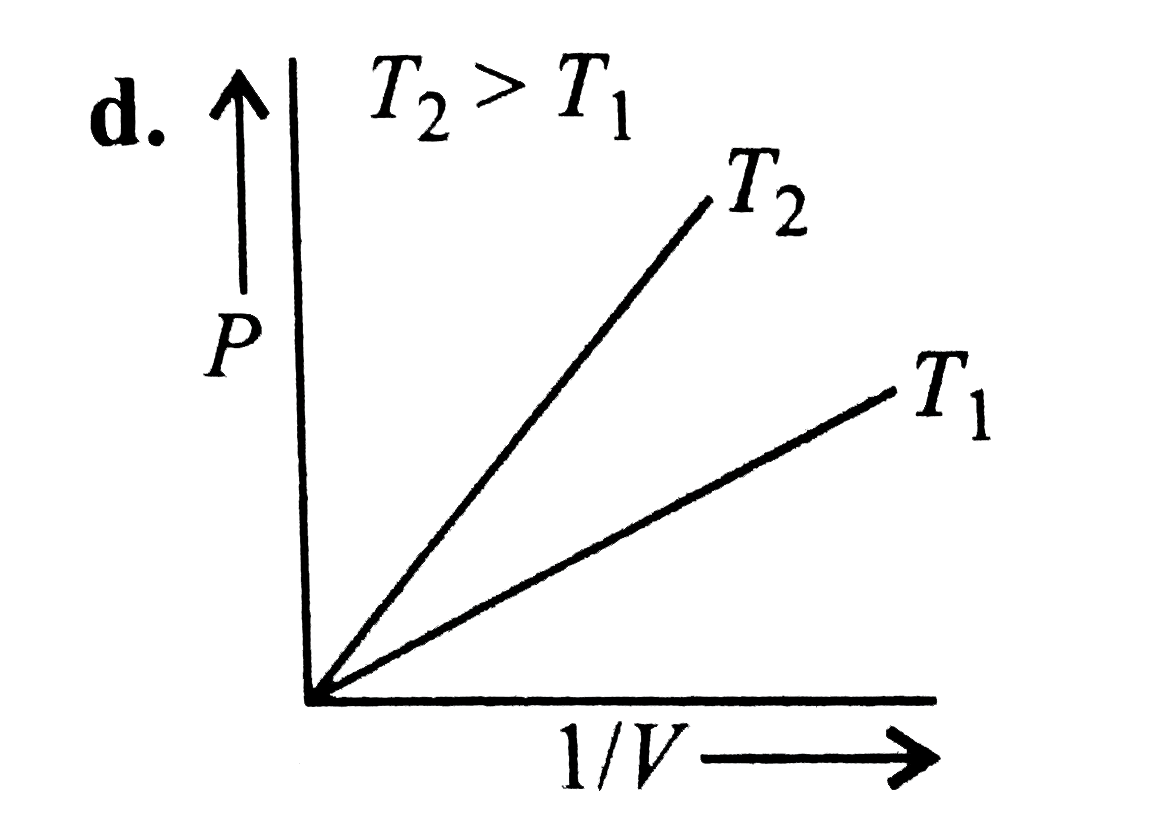
Which of the following graphs is inconsistent with ideal gas behaviour ? (Assume n = constant)
A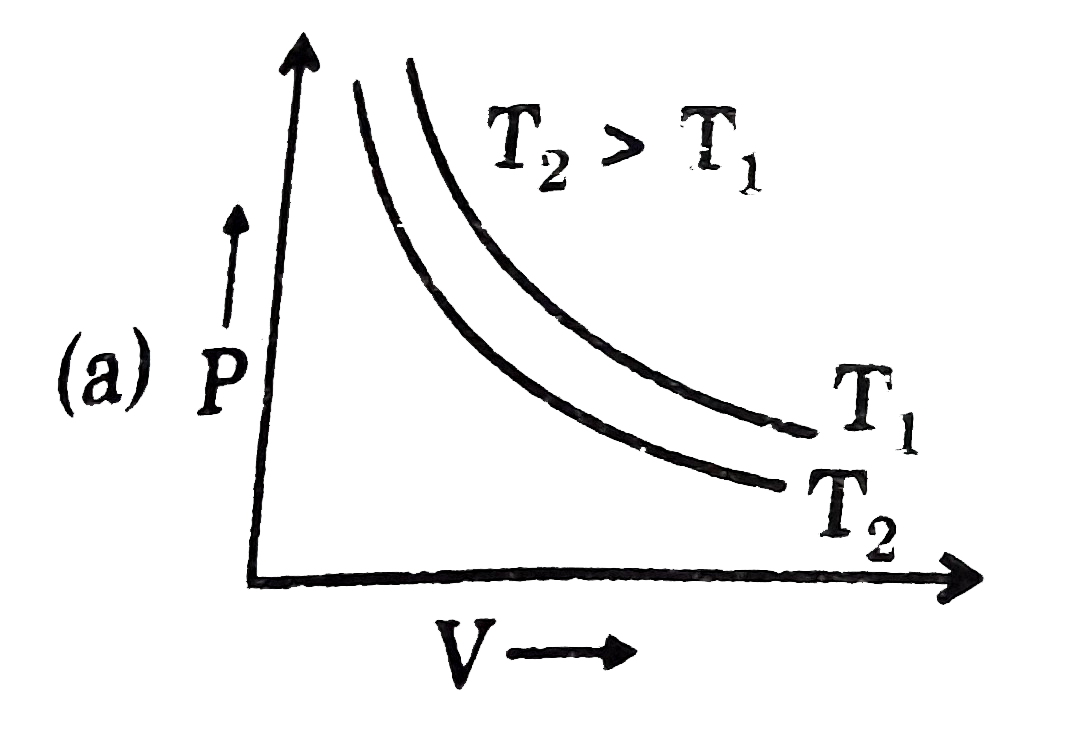 B
B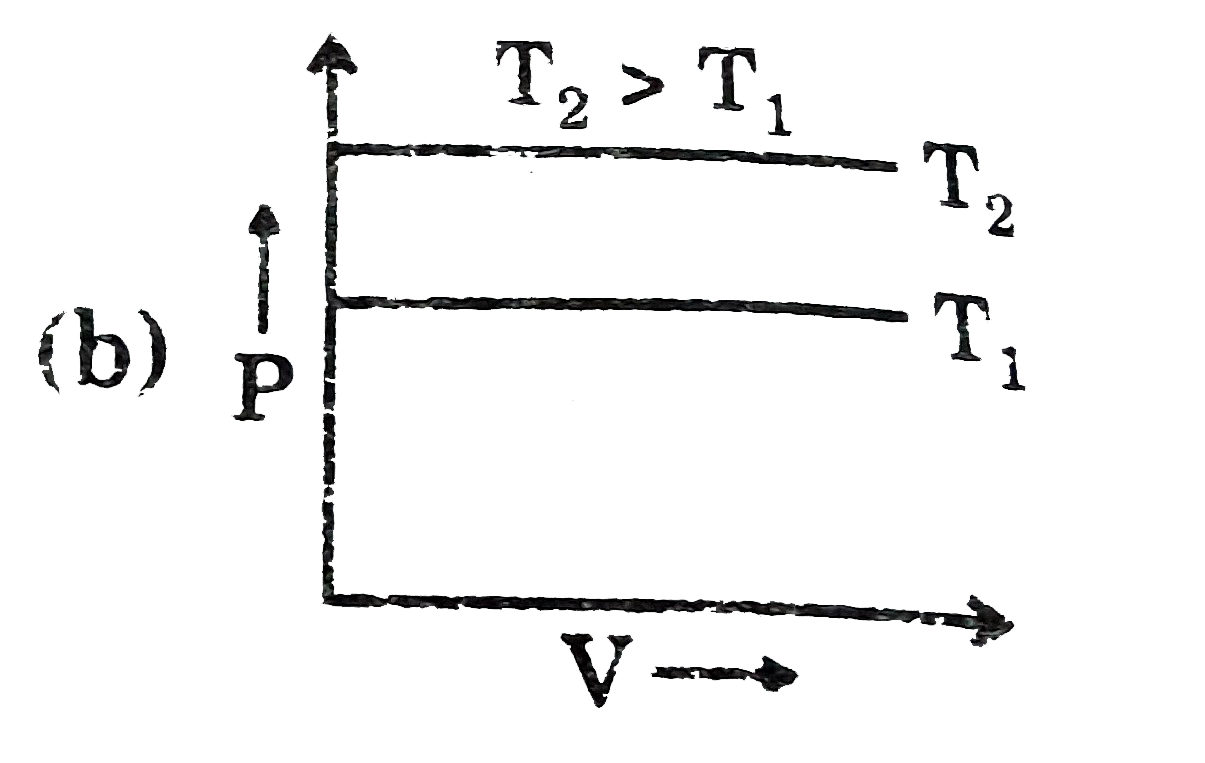 C
C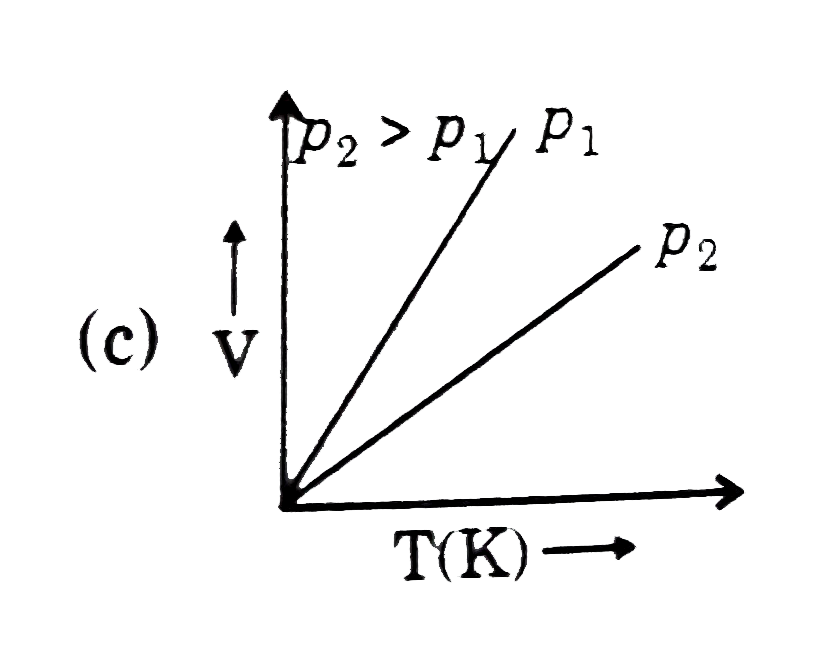 D
D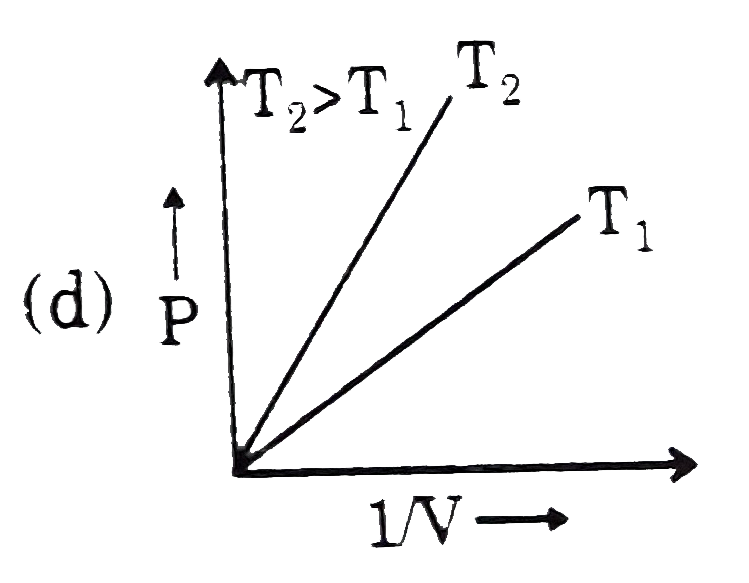
Which of the following diagram correctly describes the behaviour of a fixed mass of an ideal gas ? (T is measured in K)
View SolutionWhich of the following reaction depicts the oxidsing behaviour of H2SO4?
View SolutionWhich of the following measure the deviation from ideal behaviour of gas?
View SolutionWhich of the following reactions depict the oxidising behaviour of H2SO4?
View SolutionWhich of the following diagram correctly depicts the ralation between AC and MC ?
View Solution