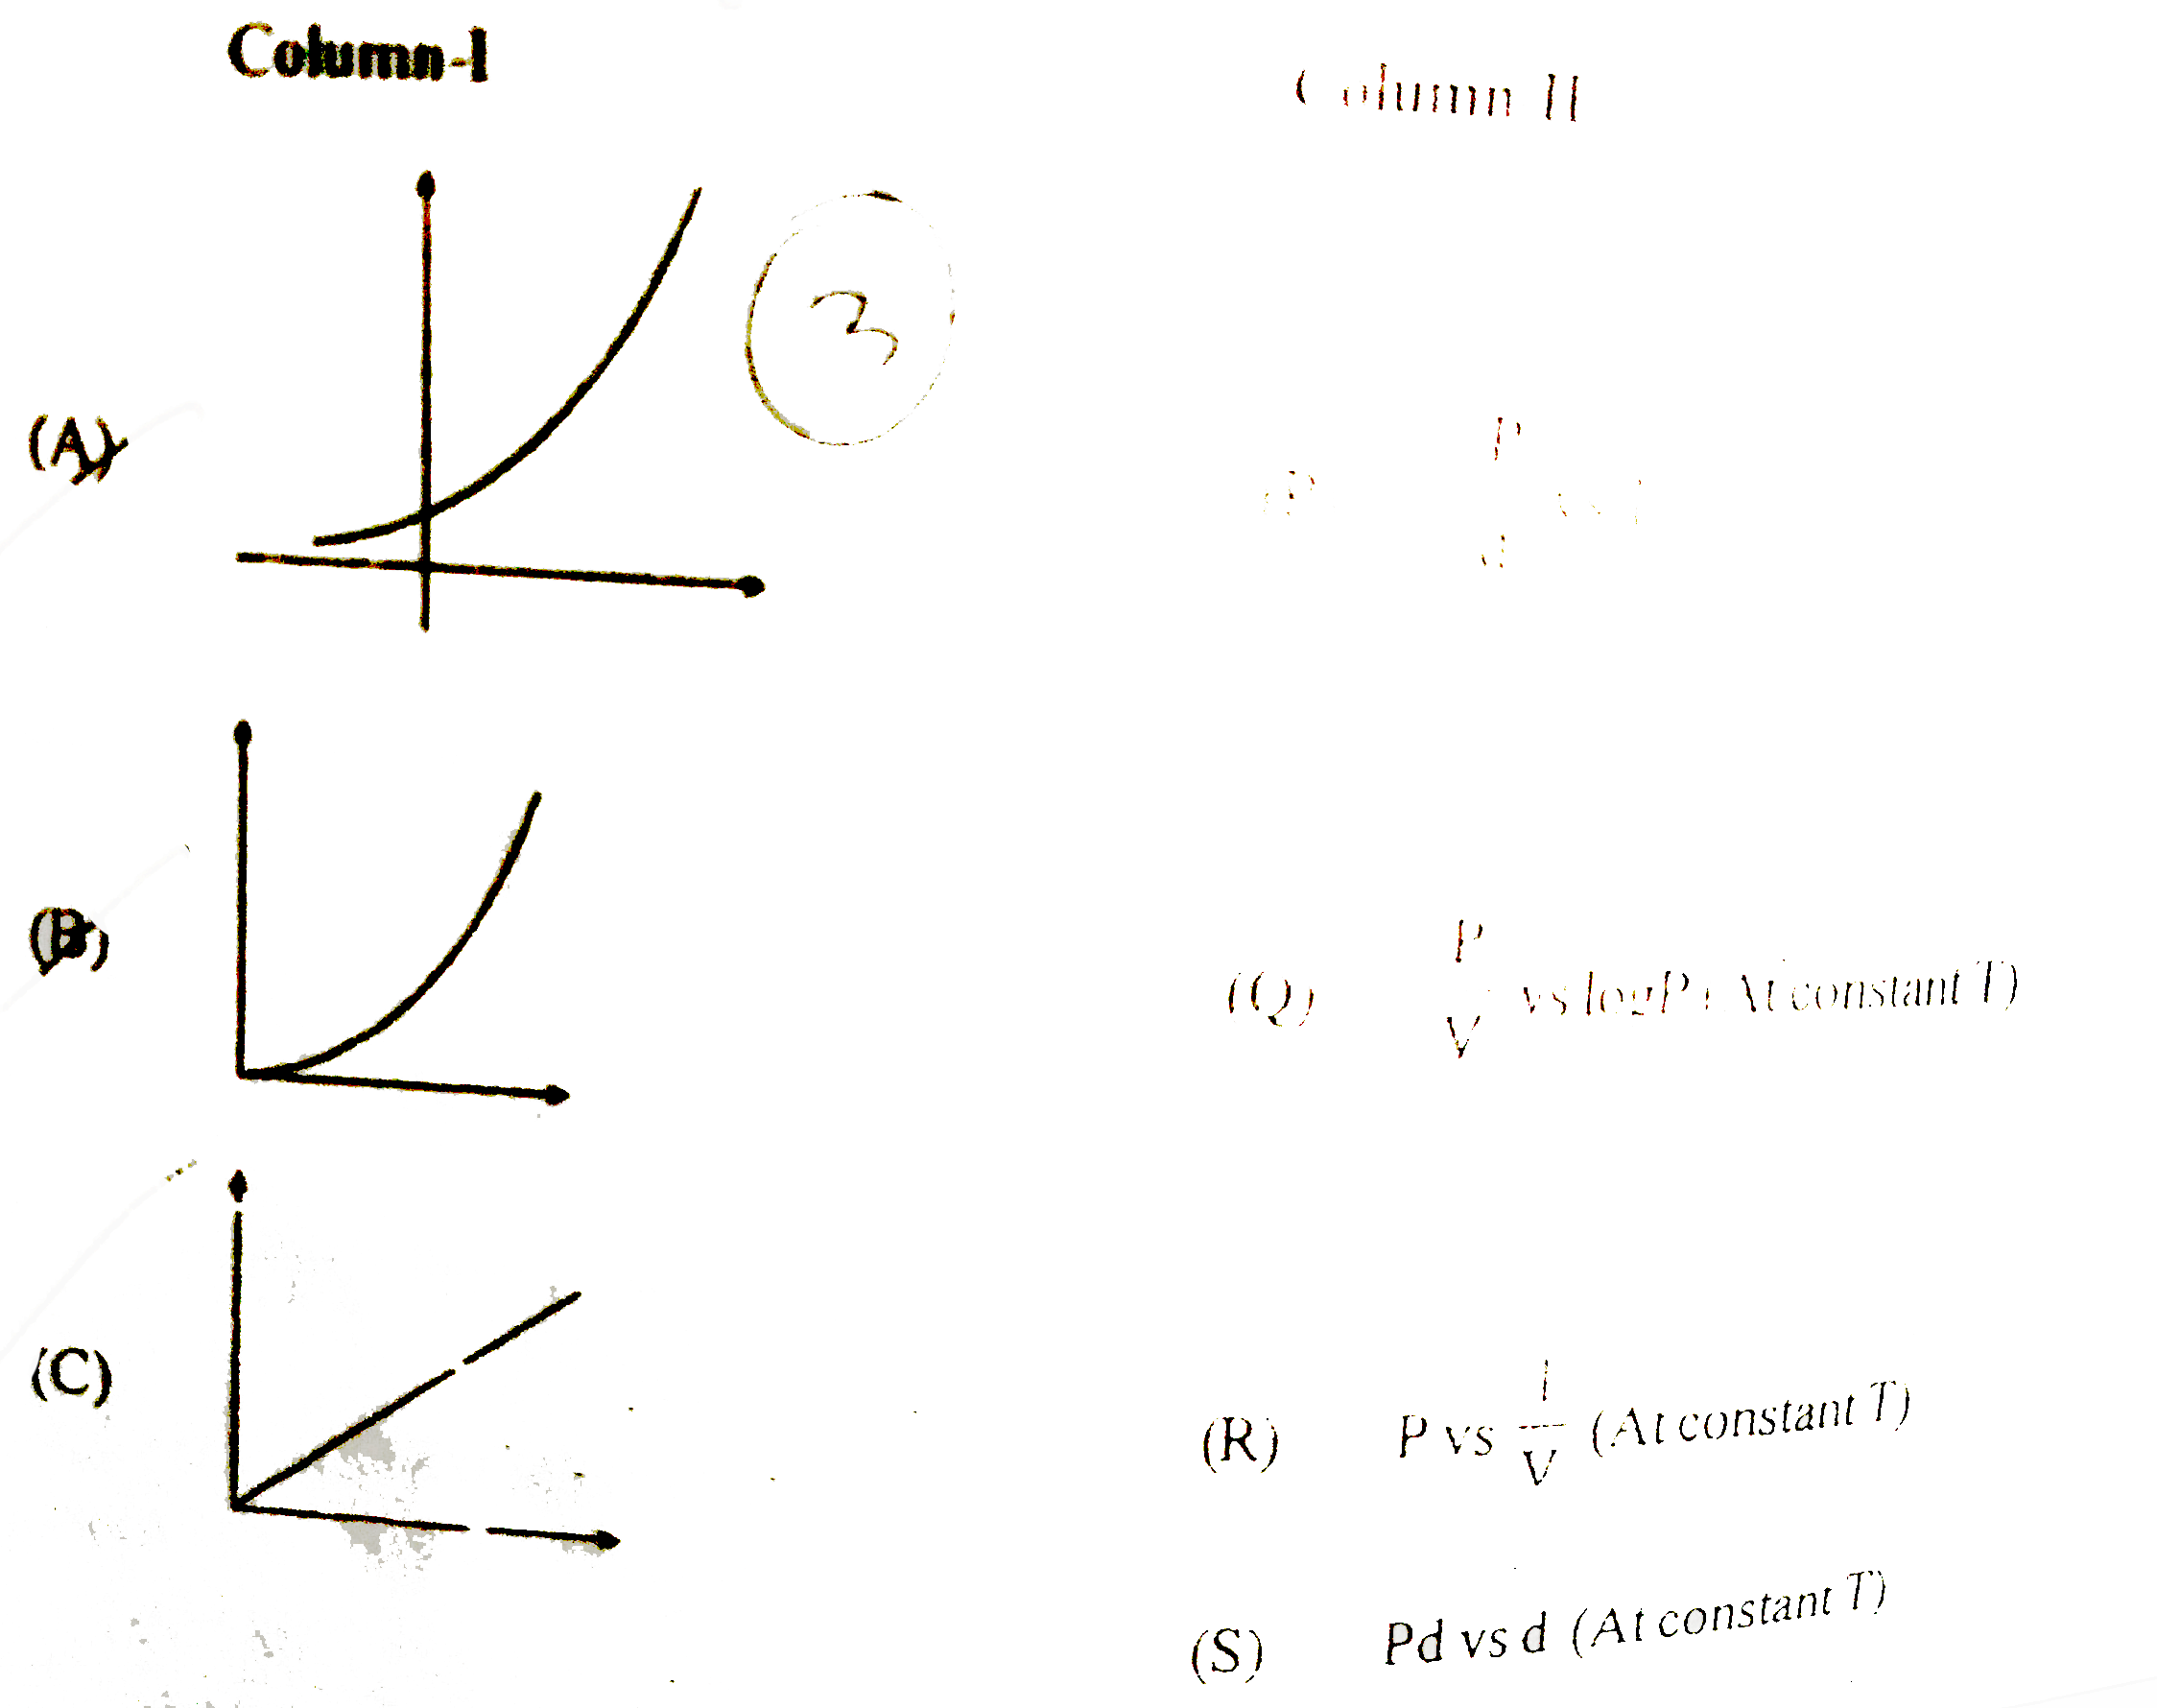
Which of the following diagram correctly describes the behaviour of a fixed mass of an ideal gas ? (T is measured in K)
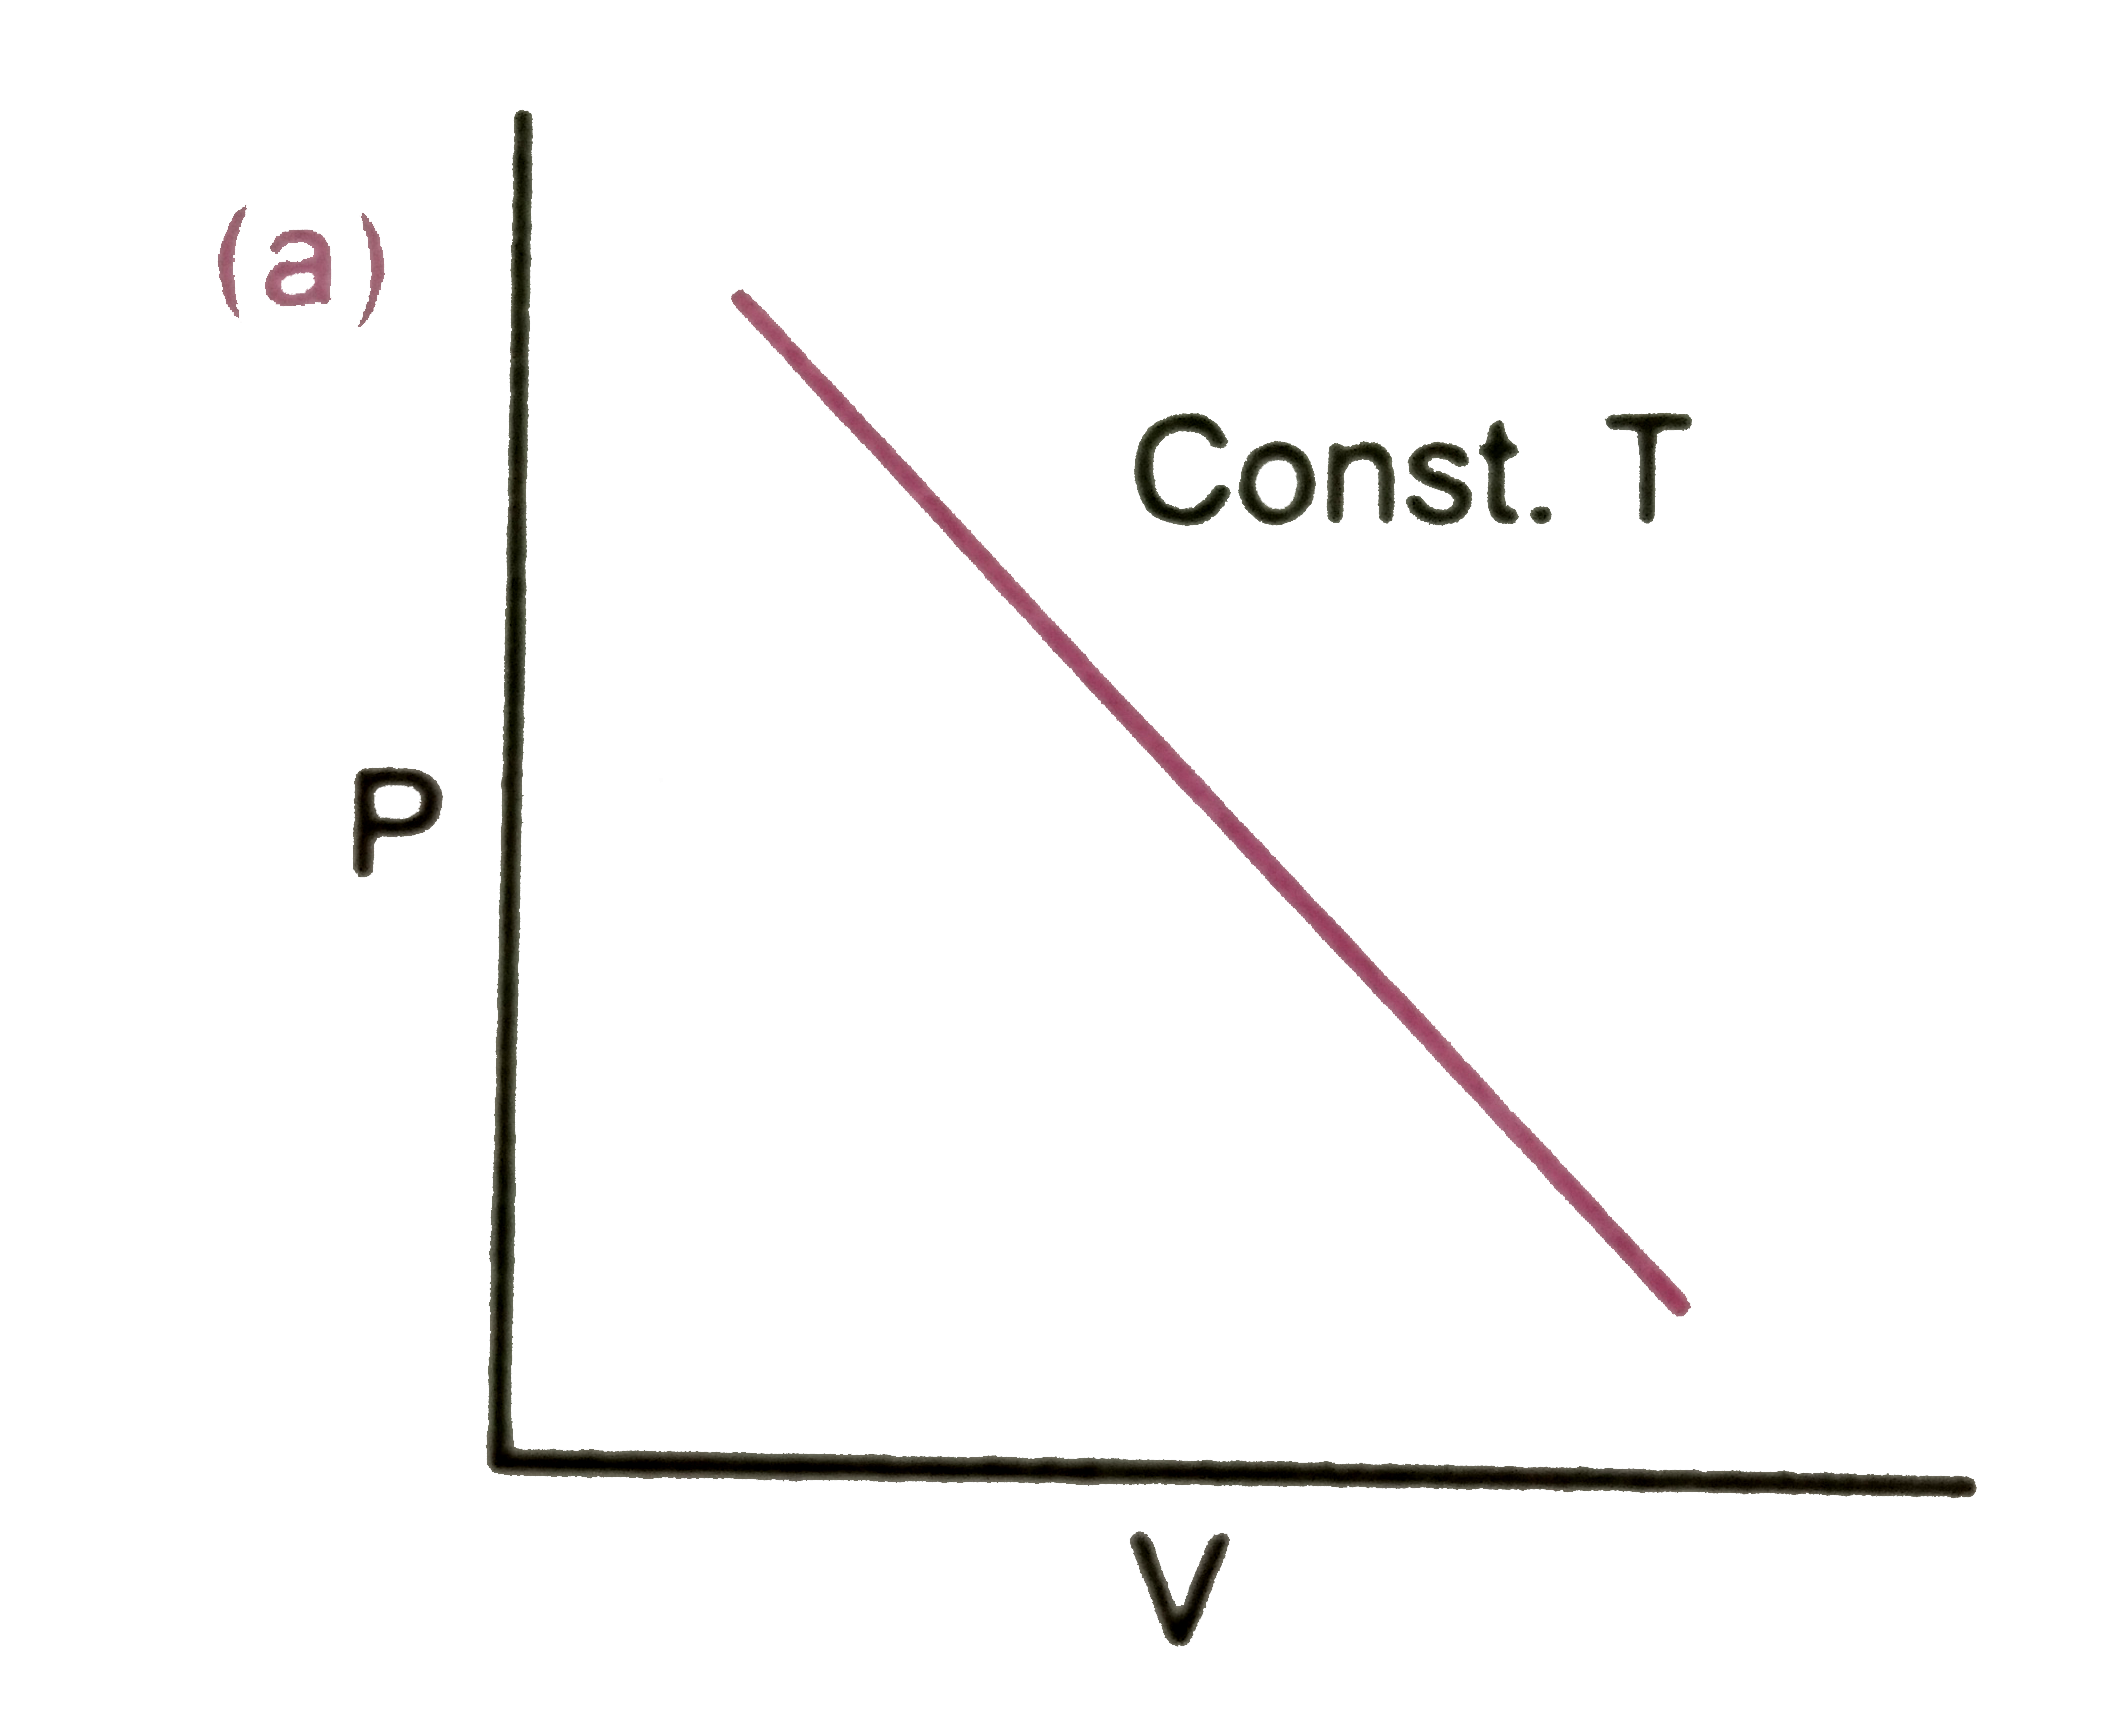
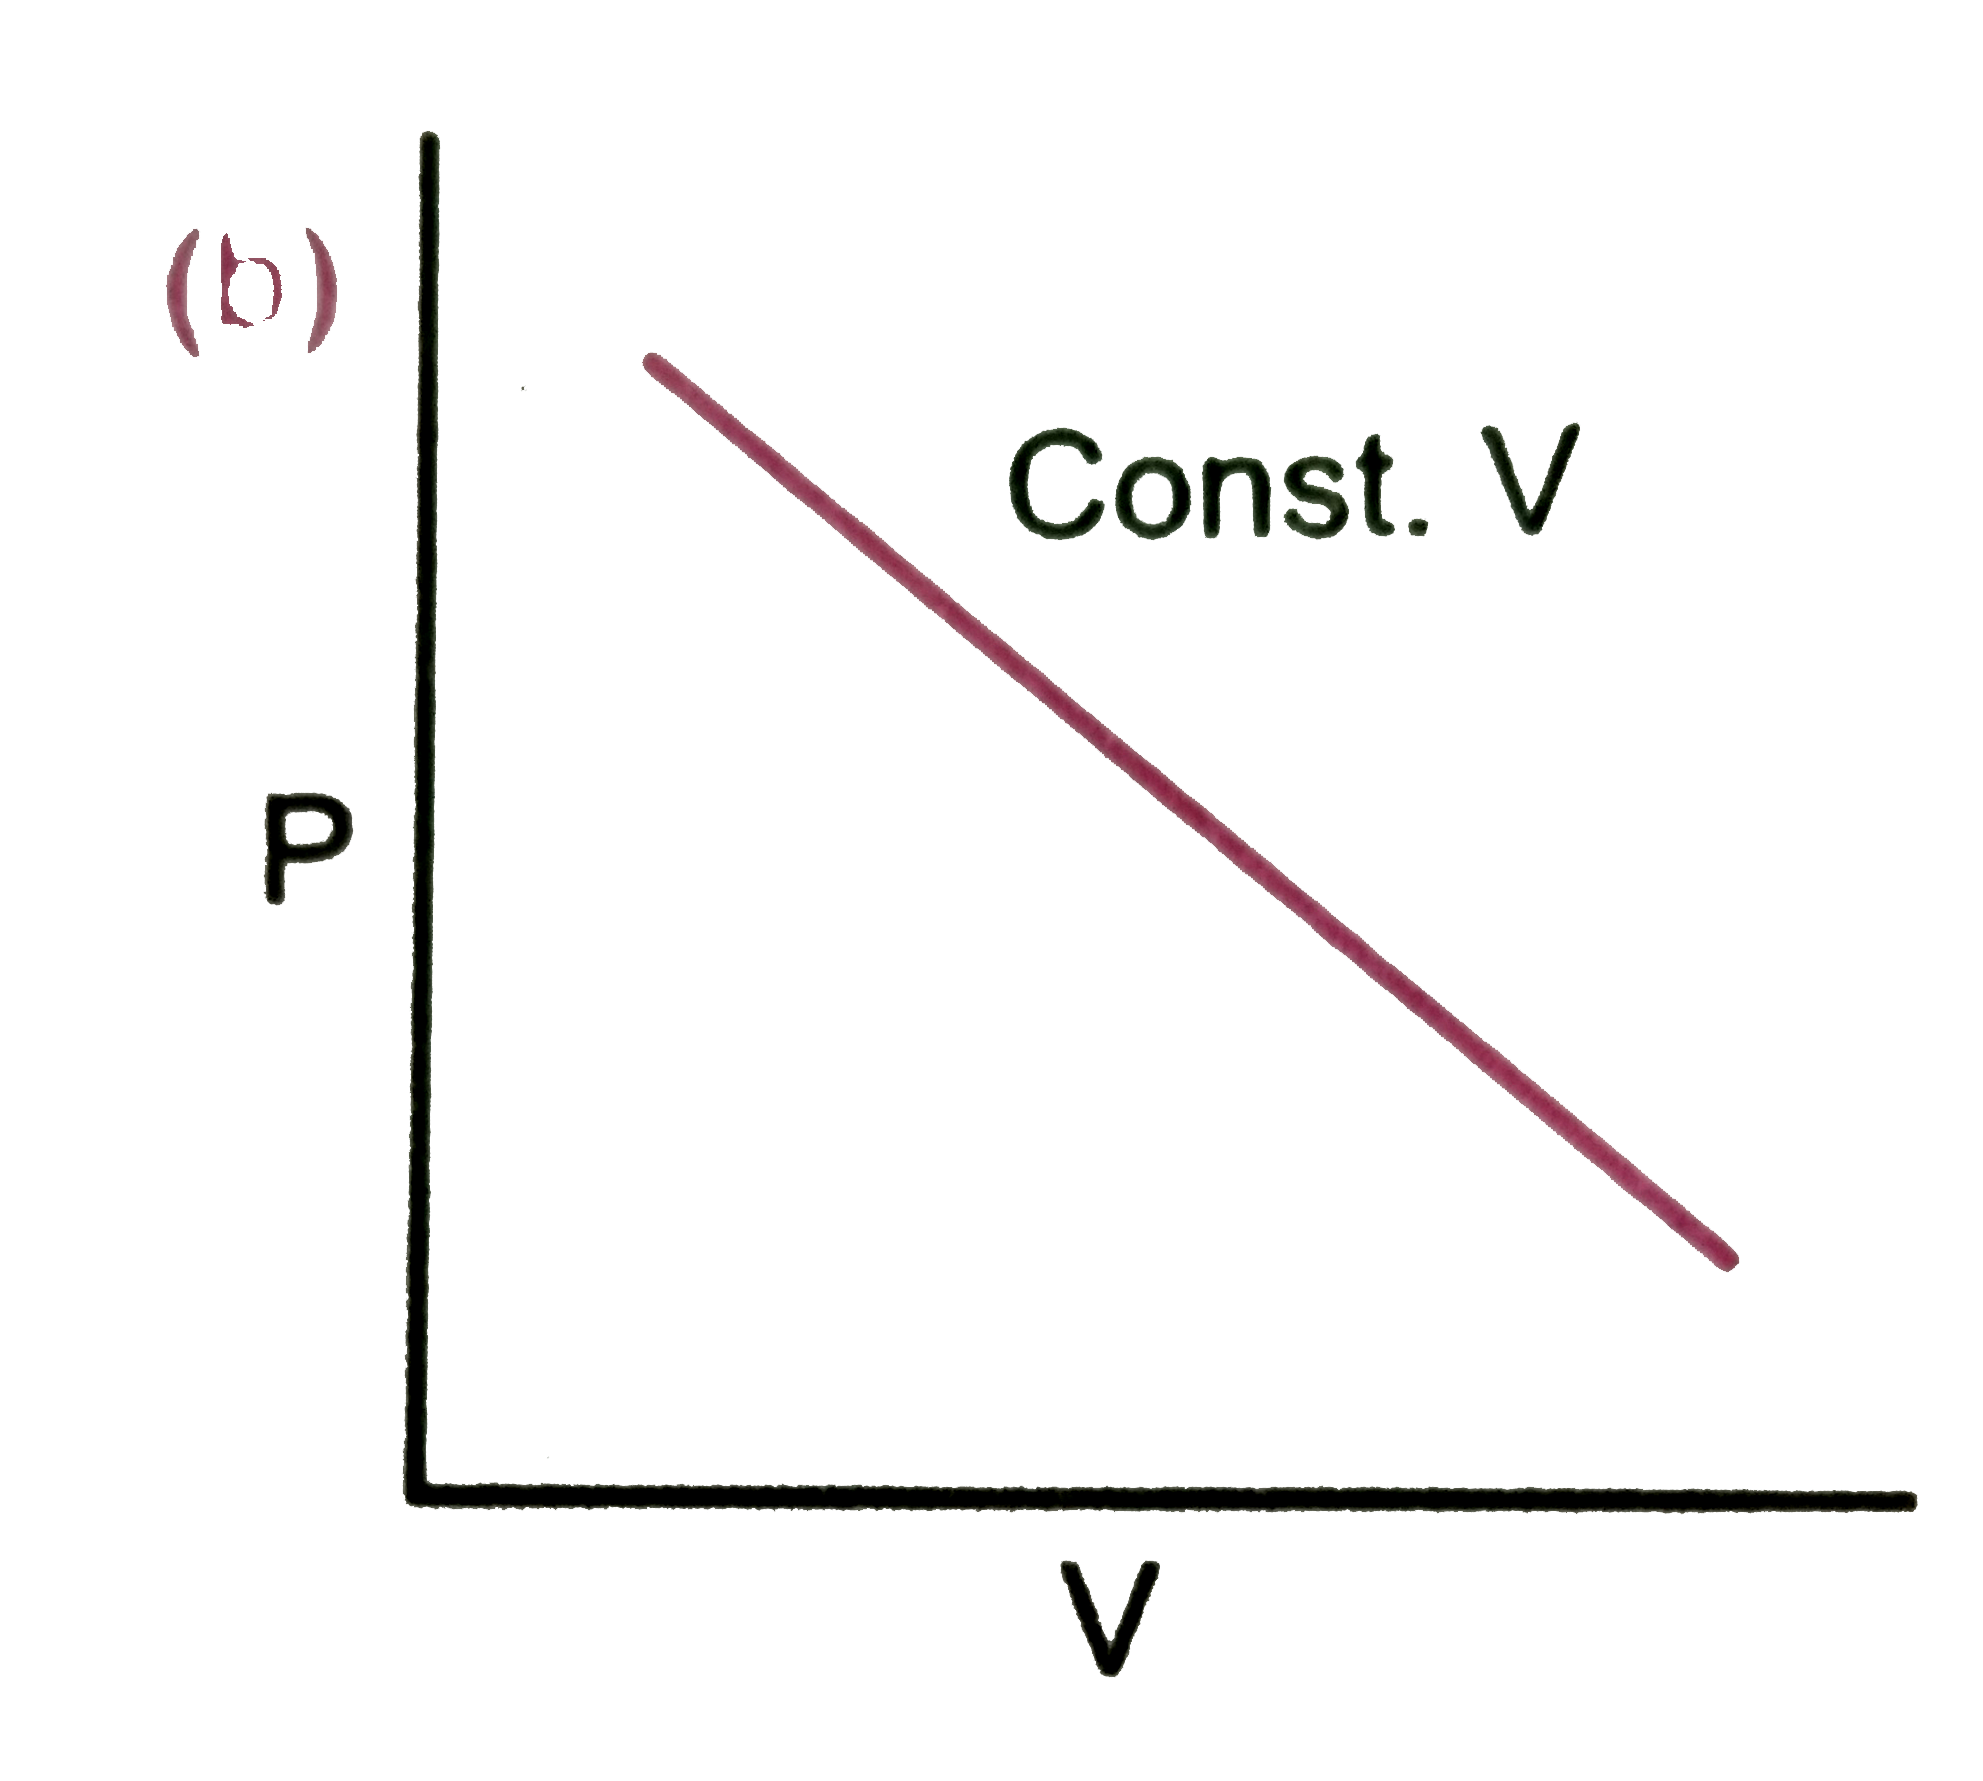
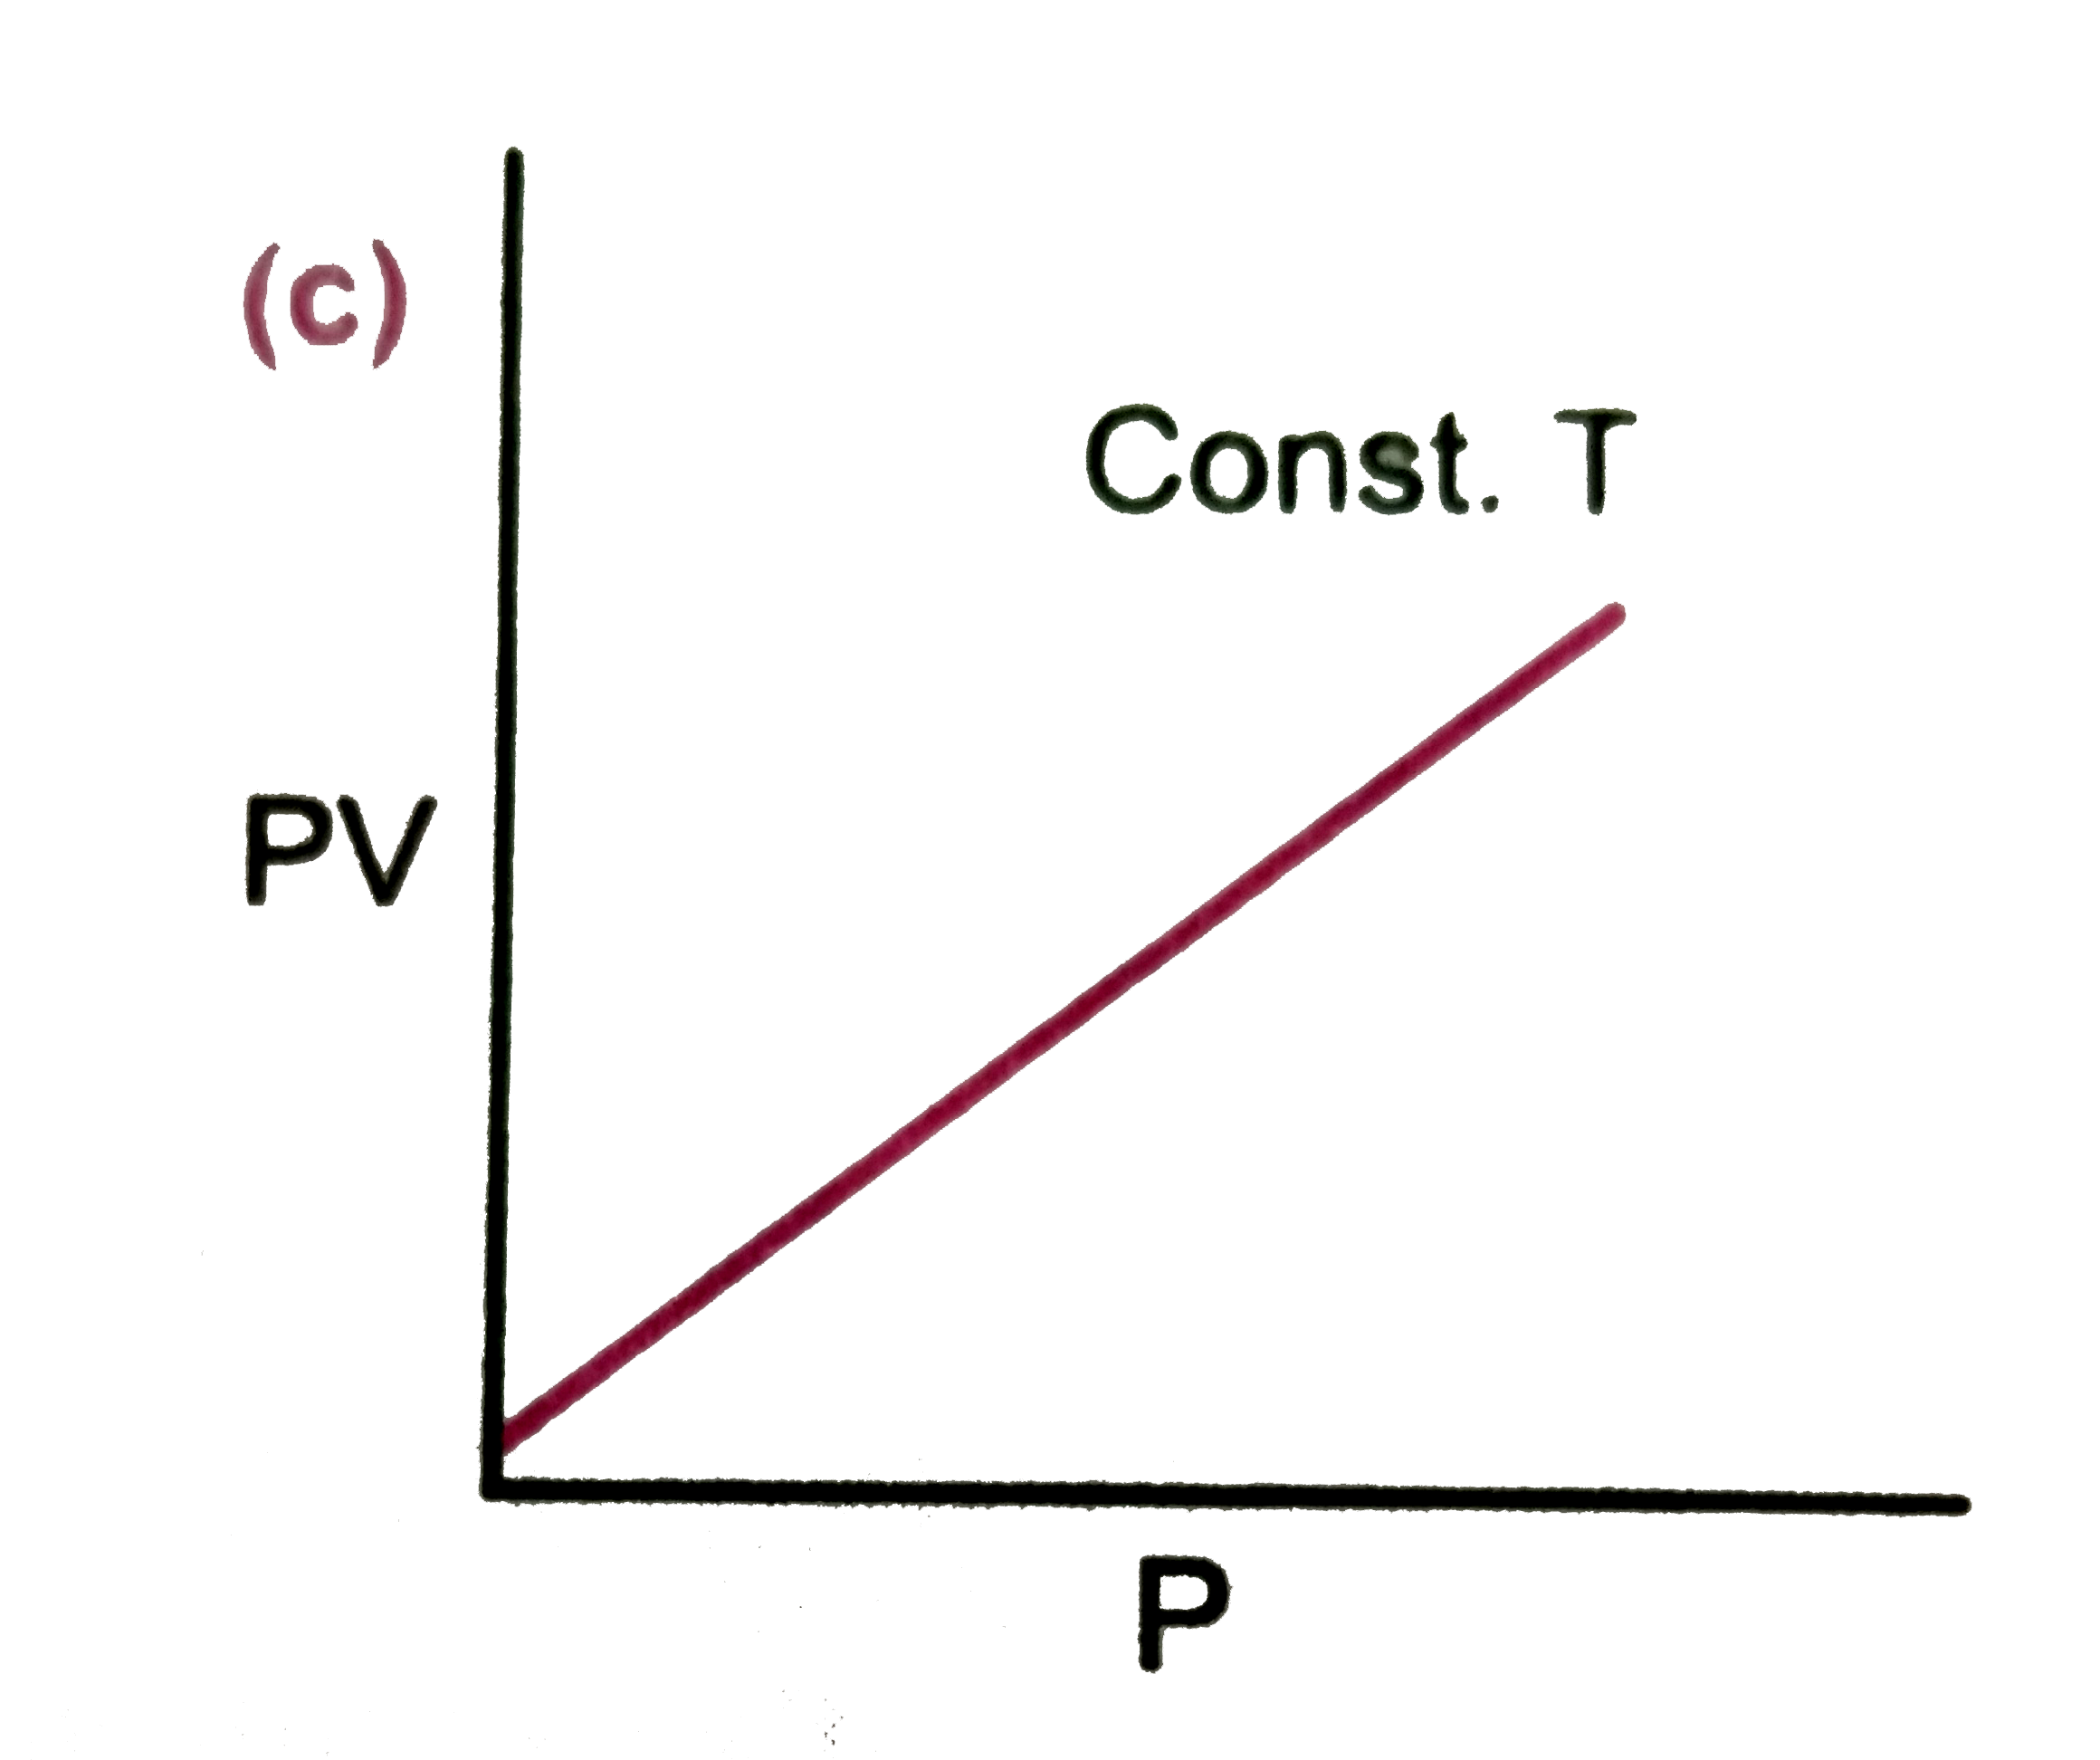
The correct Answer is:A, B, C, D
To determine which diagram correctly describes the behavior of a fixed mass of an ideal gas, we can analyze the relationships between pressure (P), volume (V), and temperature (T) using the ideal gas law, which is given by:
PV=nRT
Where:
- P = pressure
- V = volume
- n = number of moles of gas (constant for fixed mass)
- R = ideal gas constant
- T = temperature in Kelvin
1. Understanding the Ideal Gas Law:
- The ideal gas law states that for a fixed mass of gas, the product of pressure and volume is proportional to the temperature.
2. Analyzing the First Graph (P vs. V at Constant T):
- If temperature (T) is constant, then from the ideal gas equation, we can express it as:
P∝1V
- This indicates that pressure is inversely proportional to volume, which means the graph of P vs. V should be a hyperbola, not a straight line. Therefore, the first graph is incorrect.
3. Analyzing the Second Graph (P vs. T at Constant V):
- If volume (V) is constant, we can rearrange the ideal gas law to show:
P∝T
- This means that pressure increases linearly with temperature. The graph of P vs. T at constant volume should be a straight line. However, if the graph is not a straight line, this option is incorrect.
4. Analyzing the Third Graph (PV vs. P at Constant T):
- Here, if we consider the product PV at constant temperature, we see:
PV=nRT
- Since PV is constant, this means that the graph of PV vs. P should also be constant. If the graph shows any variation, this option is also incorrect.
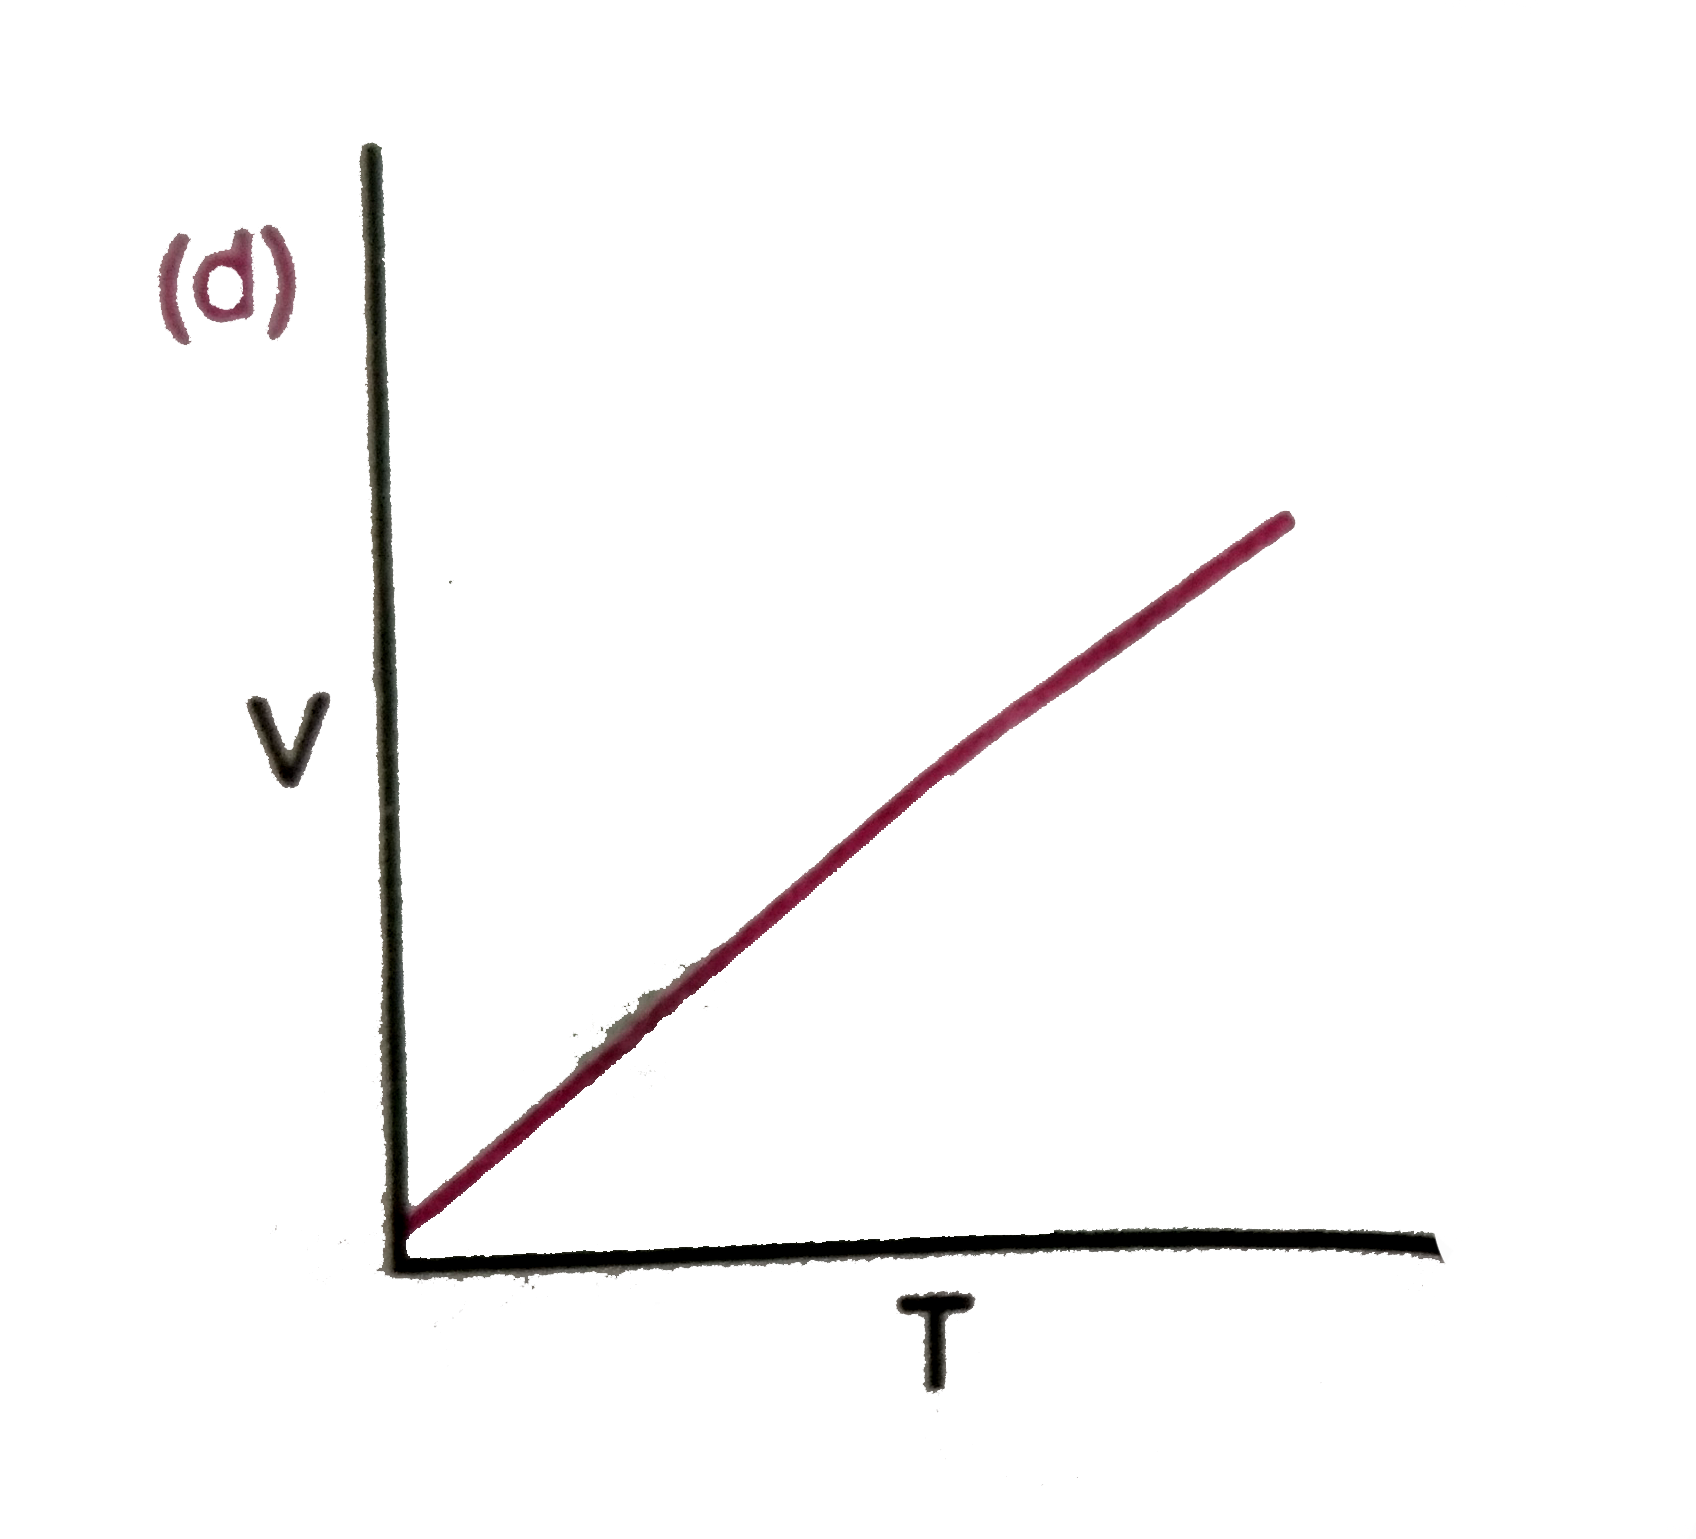
5. Analyzing the Fourth Graph (V vs. T at Constant P):
- If pressure (P) is constant, we can rearrange the ideal gas law to show:
V∝T
- This indicates a direct linear relationship between volume and temperature. Thus, the graph of V vs. T at constant pressure should be a straight line. If this graph is indeed a straight line, then this option is correct.
Conclusion:
The correct diagram that describes the behavior of a fixed mass of an ideal gas is the fourth graph, which shows a linear relationship between volume (V) and temperature (T) at constant pressure (P).
- P = pressure
- V = volume
- n = number of moles of gas (constant for fixed mass)
- R = ideal gas constant
- T = temperature in Kelvin
- The ideal gas law states that for a fixed mass of gas, the product of pressure and volume is proportional to the temperature.
- If temperature (T) is constant, then from the ideal gas equation, we can express it as:
P∝1V
- This indicates that pressure is inversely proportional to volume, which means the graph of P vs. V should be a hyperbola, not a straight line. Therefore, the first graph is incorrect.
- If volume (V) is constant, we can rearrange the ideal gas law to show:
P∝T
- This means that pressure increases linearly with temperature. The graph of P vs. T at constant volume should be a straight line. However, if the graph is not a straight line, this option is incorrect.
- Here, if we consider the product PV at constant temperature, we see:
PV=nRT
- Since PV is constant, this means that the graph of PV vs. P should also be constant. If the graph shows any variation, this option is also incorrect.
- If pressure (P) is constant, we can rearrange the ideal gas law to show:
V∝T
- This indicates a direct linear relationship between volume and temperature. Thus, the graph of V vs. T at constant pressure should be a straight line. If this graph is indeed a straight line, then this option is correct.
The correct diagram that describes the behavior of a fixed mass of an ideal gas is the fourth graph, which shows a linear relationship between volume (V) and temperature (T) at constant pressure (P).
Topper's Solved these Questions
- STATES OF MATTER : GASES AND LIQUIDESBook:PRADEEPChapter:STATES OF MATTER : GASES AND LIQUIDESExercise:FILL IN THE BLANK
Explore 20 Videos
- STATES OF MATTER : GASES AND LIQUIDESBook:PRADEEPChapter:STATES OF MATTER : GASES AND LIQUIDESExercise:CONCEPTUAL QUESTIONS (Differentiating three states of matter and intermolecular forces
Explore 2 Videos
- STATES OF MATTER : GASES AND LIQUIDESBook:PRADEEPChapter:STATES OF MATTER : GASES AND LIQUIDESExercise:ADVANCED PROBLEMS (FOR COMPETITIONS)
Explore 19 Videos
- SOME p-BLOCK ELEMENTSBook:PRADEEPChapter:SOME p-BLOCK ELEMENTSExercise:Competition Focus (JEE( Main and Advanced)/Medical Entrance) VIII. Assertion-Reason Type Questions (Type I)
Explore 23 Videos
- STATES OF MATTER: SOLID MATTERBook:PRADEEPChapter:STATES OF MATTER: SOLID MATTERExercise:COMPETITION FOCUS (ASSERTION-REASON)
Explore 17 Videos
Similar Questions
Knowledge Check
Which of the following diagrams correctly decribes the behavior of a fixed mass of an ideal gas ? (T is measured in K)
A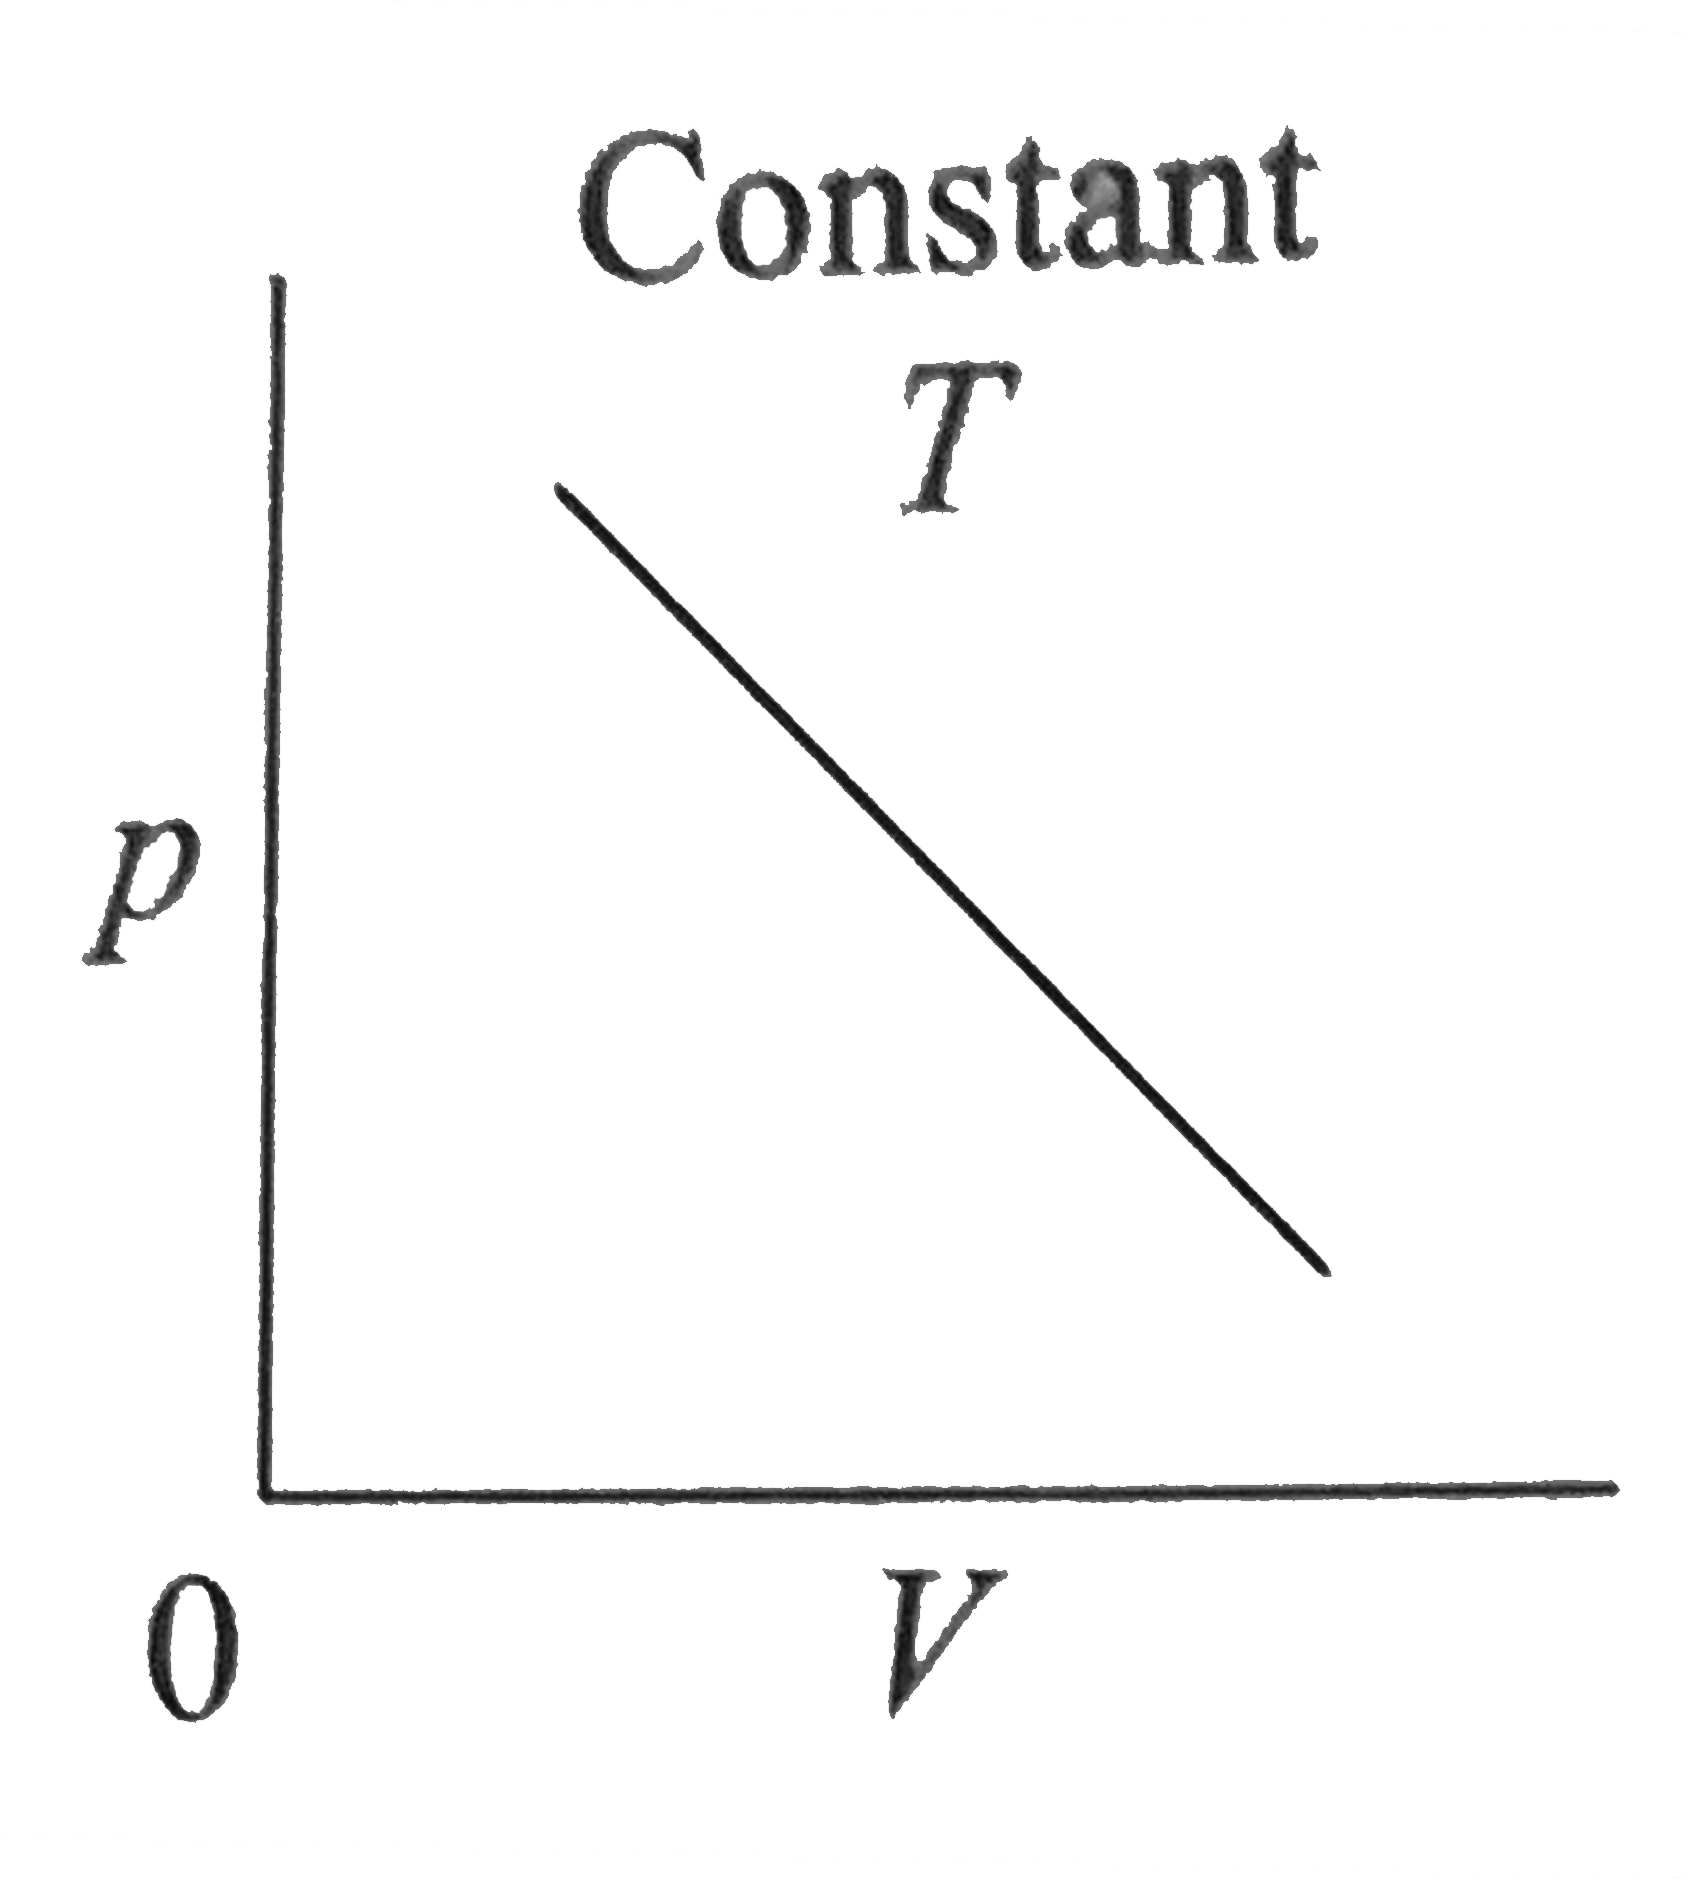 B
B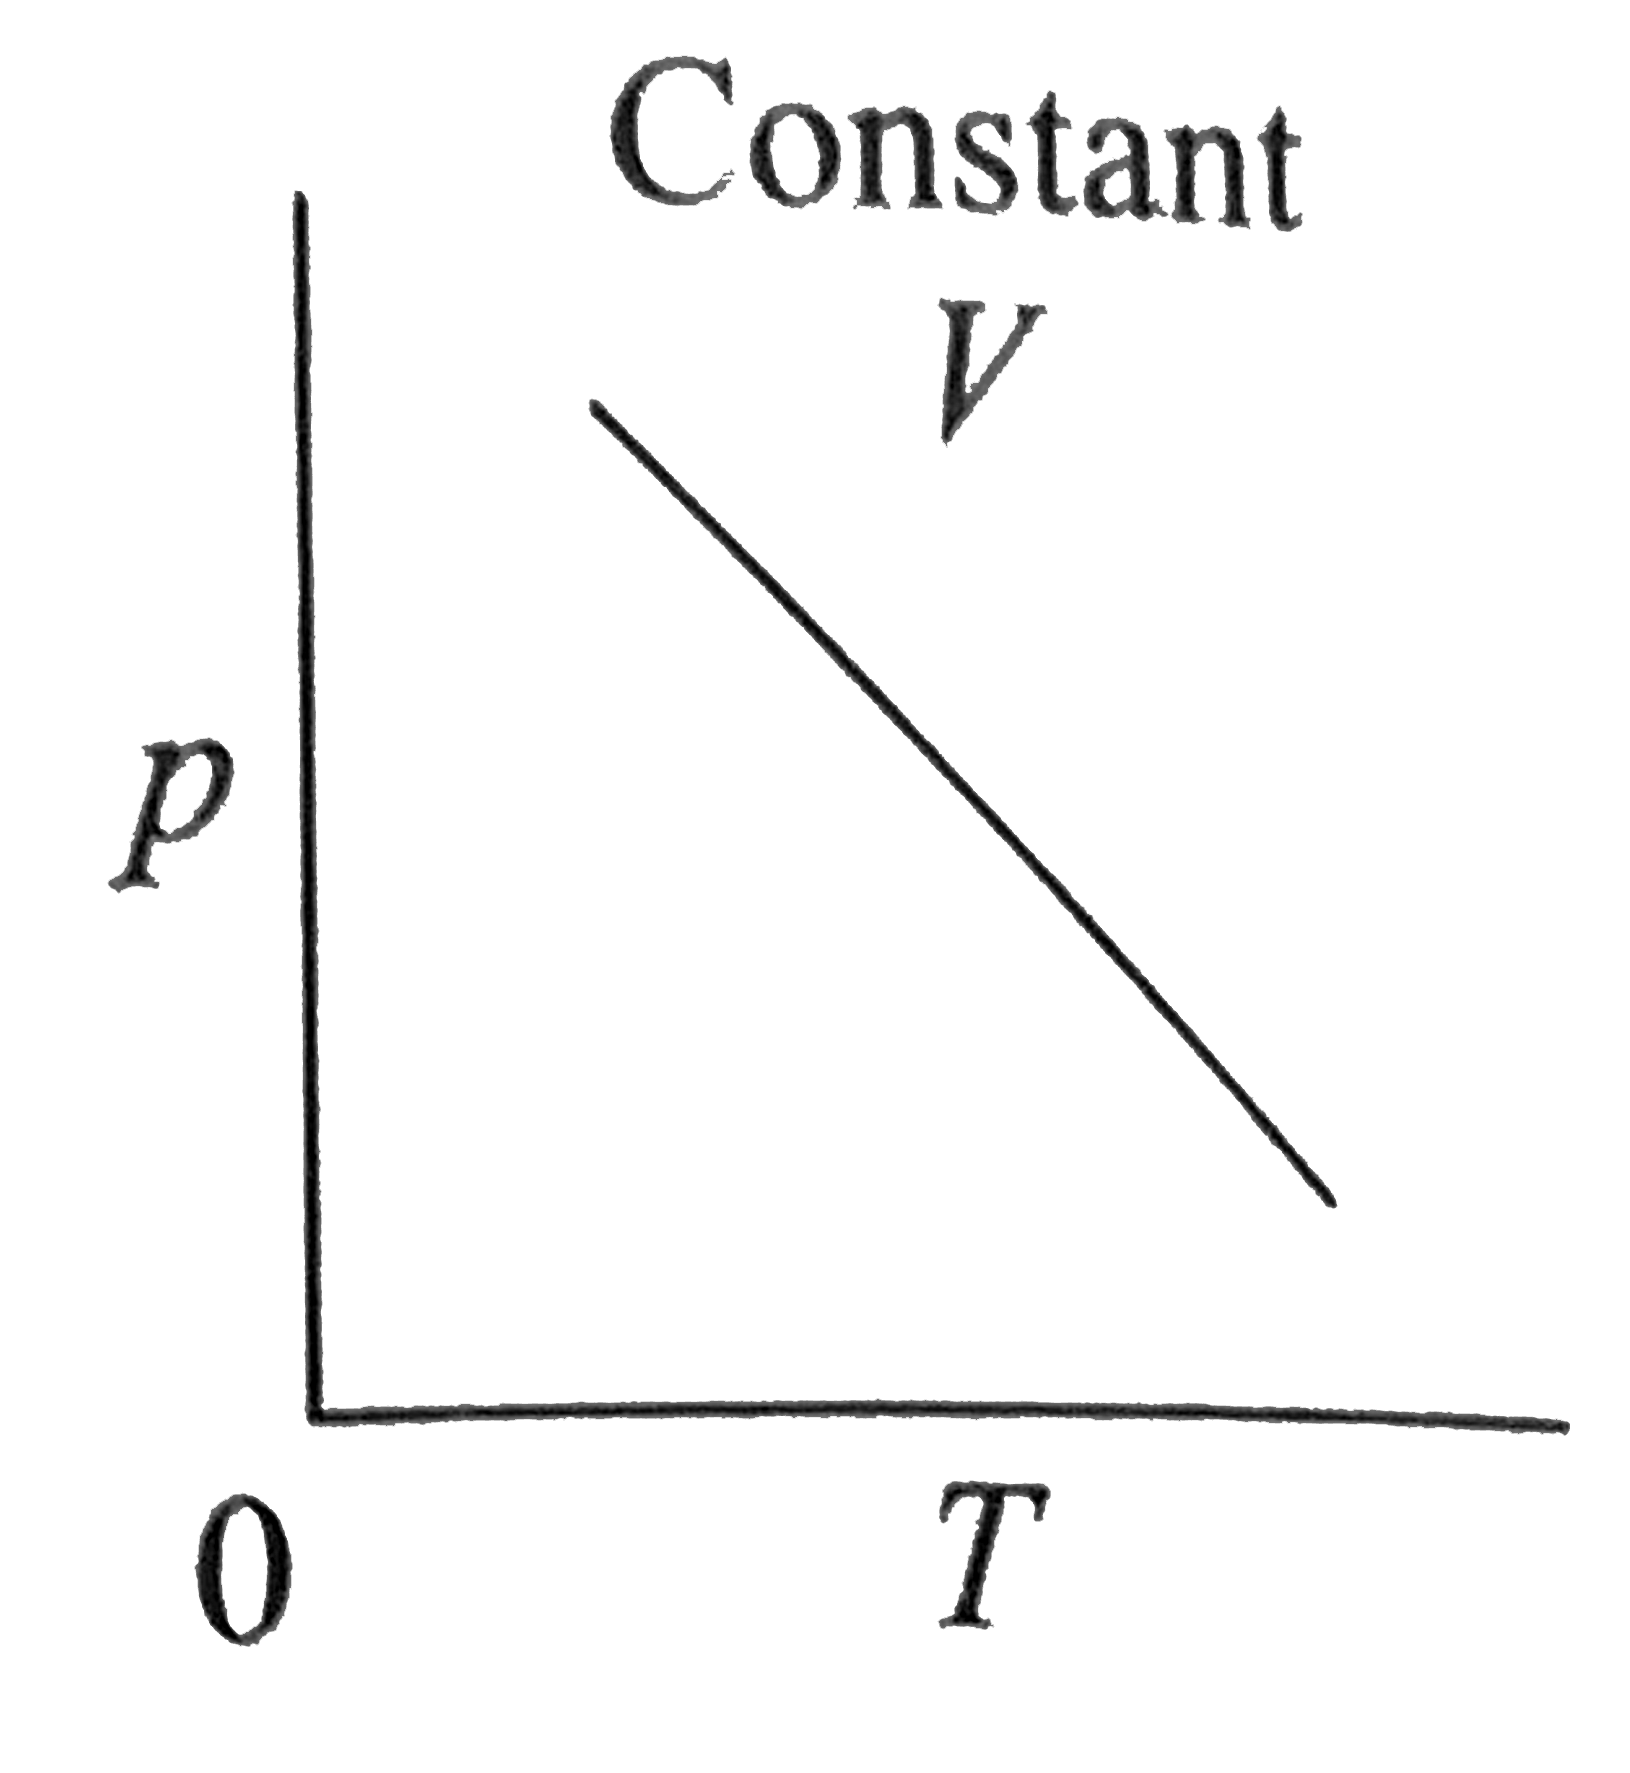 C
C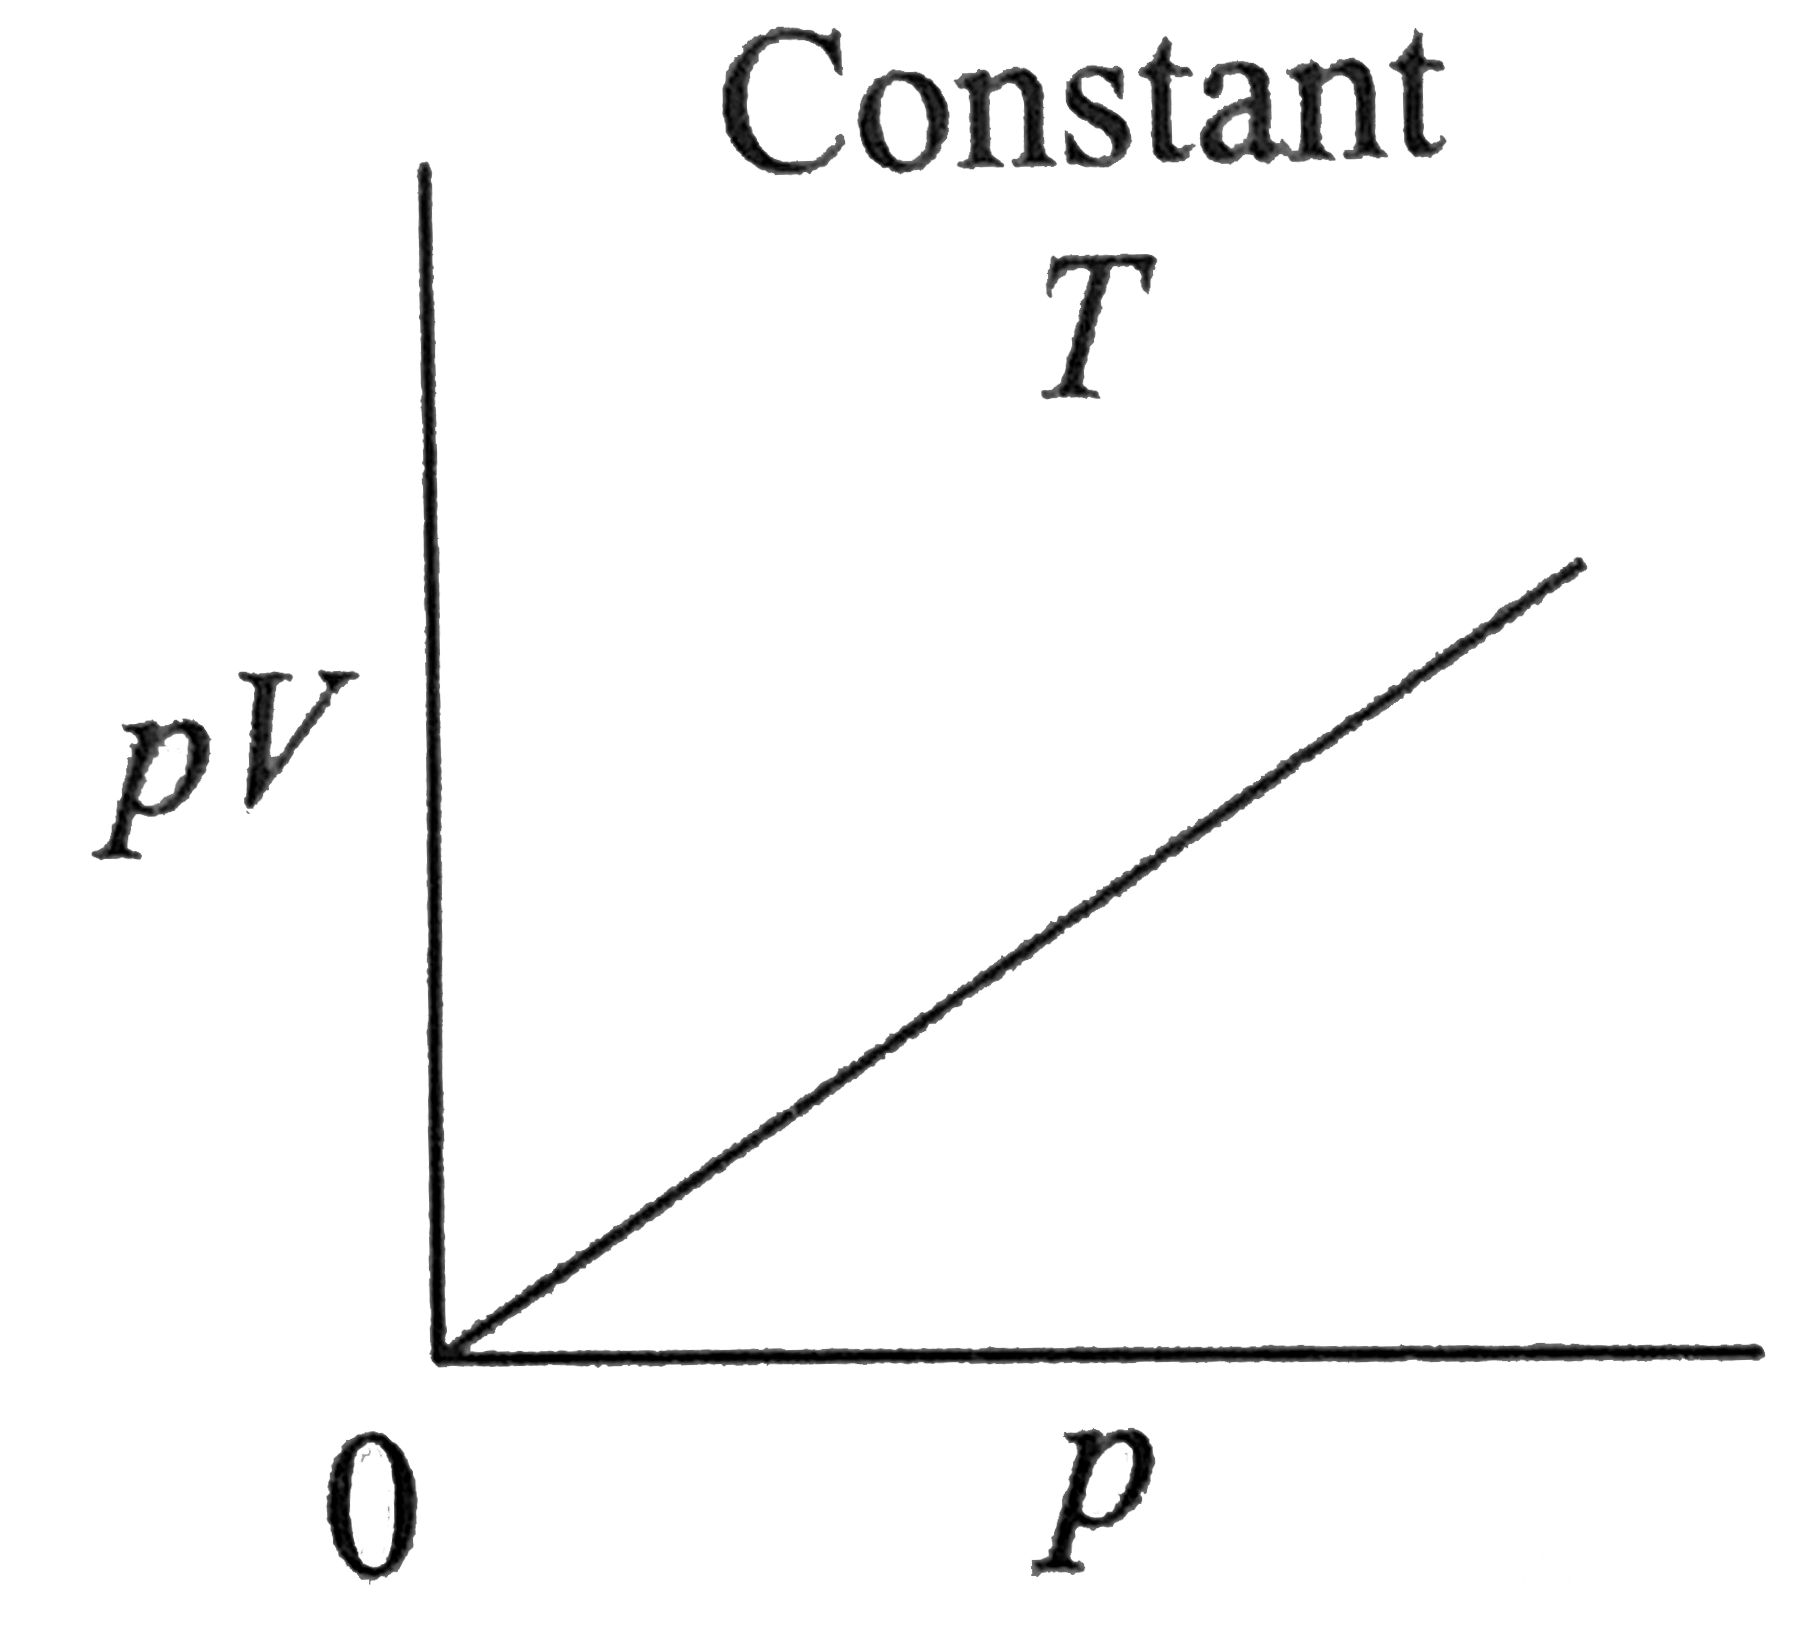 D
D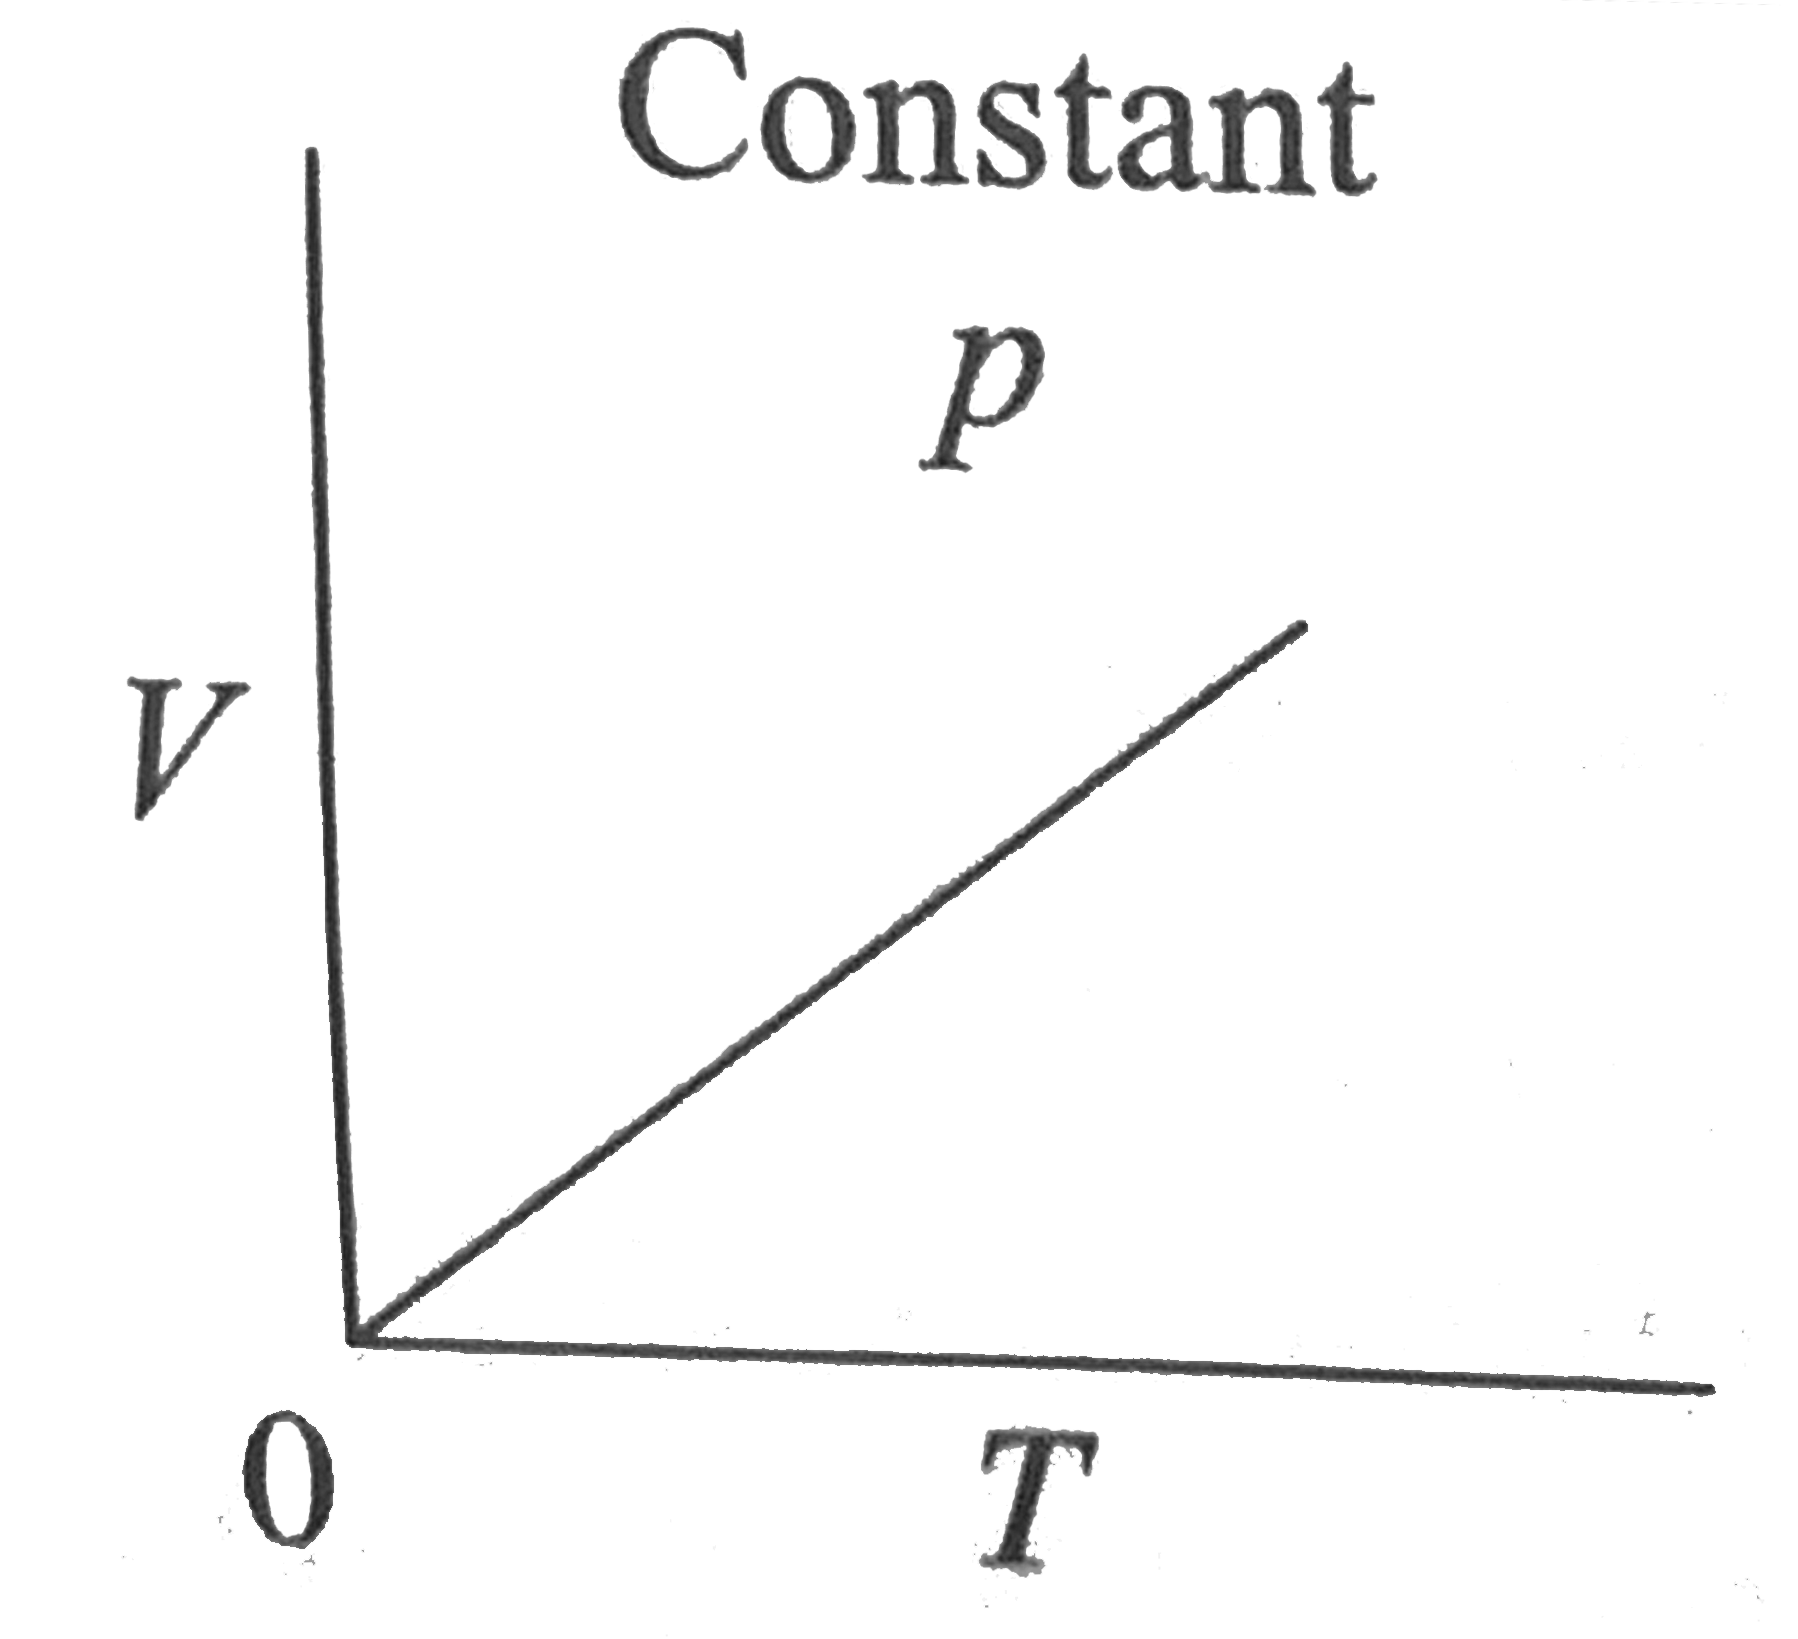
Which of the following correctly describes chromatin?
AThe complex of DNA protein from which chromosomes are composed.BThe total genetic content of a cell.CThe proteins that give structural support to a chromosome.DUnpacked DNAWhich of the following correctly describes probiotics ?
ACancer- inducing microbesBNew kind of food allergensCLive microbial food supplementsDSafe antibiotics
Which one of the following graphs correctly gives the ideal gas behaviour ?
View SolutionWhich of the following diagrams, Fig. depicts ideal gas behaviour ?
View SolutionWhich of the following graphs represent the behaviour of an ideal gas ?
View SolutionWhich of the following diagrams (figure) depicts ideal gas behaviour?
View SolutionWhich of the following graphs is consistent with ideal gas behaviour?
View Solution


