A thin piece of thermal conductor of constant thermal conductivity insulated on the lateral sides connects two reservoirs which are maintained at temperatures T1 and T2 as shown. Assuming that the system is in steady state, which of the following plots best represents the dependence of the rate of change of entropy of the ratio of temperatures T1/T2


The correct Answer is:B
Step by step video, text & image solution for A thin piece of thermal conductor of constant thermal conductivity insulated on the lateral sides connects two reservoirs which are maintained at temperatures T_(1) and T_(2) as shown. Assuming that the system is in steady state, which of the following plots best represents the dependence of the rate of change of entropy of the ratio of temperatures T_(1)//T_(2) by Physics experts to help you in doubts & scoring excellent marks in Class 12 exams.
Updated on:21/07/2023Topper's Solved these Questions
Similar Questions
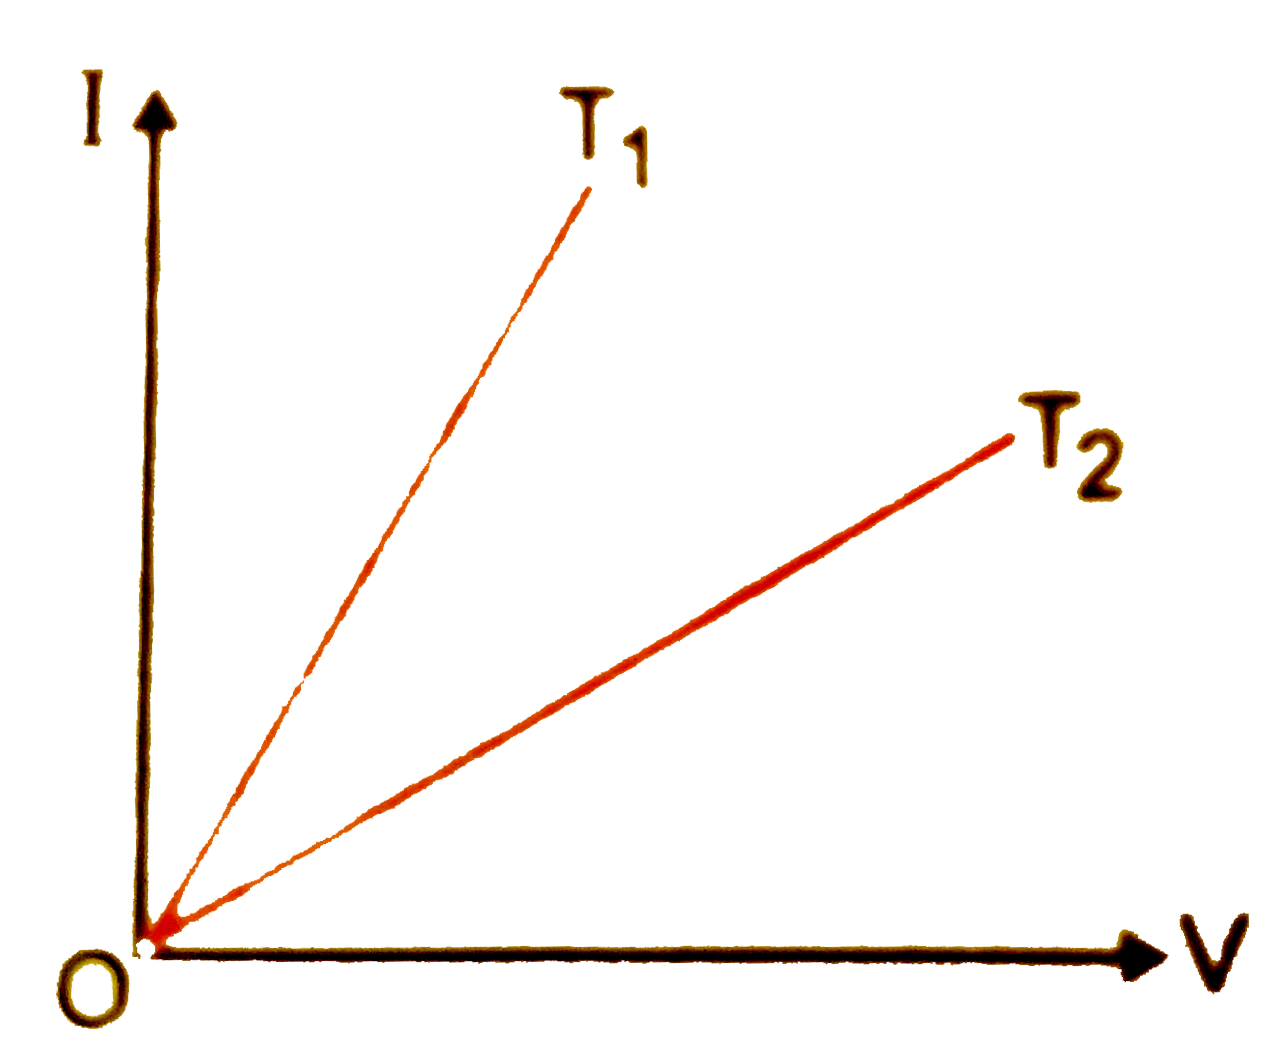
V- I graph for a metallic wire at two different temperature T1 and T2 is shown in figure. Which of the two temperature is higher and why?
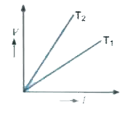
View SolutionThe voltage-current (V-I) graph of a metallic conductor at two different temperature T1 and T2 is shown in figure. At which temperature is the resistance higher?
View Solution
Knowledge Check
If K1= Rate constant at temperature T1 and k2 rate constant at temperature T2 for a first order reaction, then which of the following relation is correct ?
Alog.k2k1=2.303RT[T2−T1T1T2]Blog.k2k1=Ea2.303RT[T2−T1T1T2]Clog.k2k1=Ea2.303RT[T1T2T2−T1]Dlog.k1k2=Ea2.303RT[T2T2T2−T1]Two walls of thickness d and d and thermal conductivities k and k are in contact. In the steady state, if the temperature at the outer T1 and T2 , the temperature at the common wall is
Ak1T1d2+k2T2d1k1d2+k2d1Bk1T1+k2d2d1+d2C(k1d1+k2d2T1+T2)T1T2Dk1d1T1+k2d2T2k1d1+k2d2Shown below are the black body radiation curves at temperature T1 and T2(T2>T1). Which of the following plots is correct?
A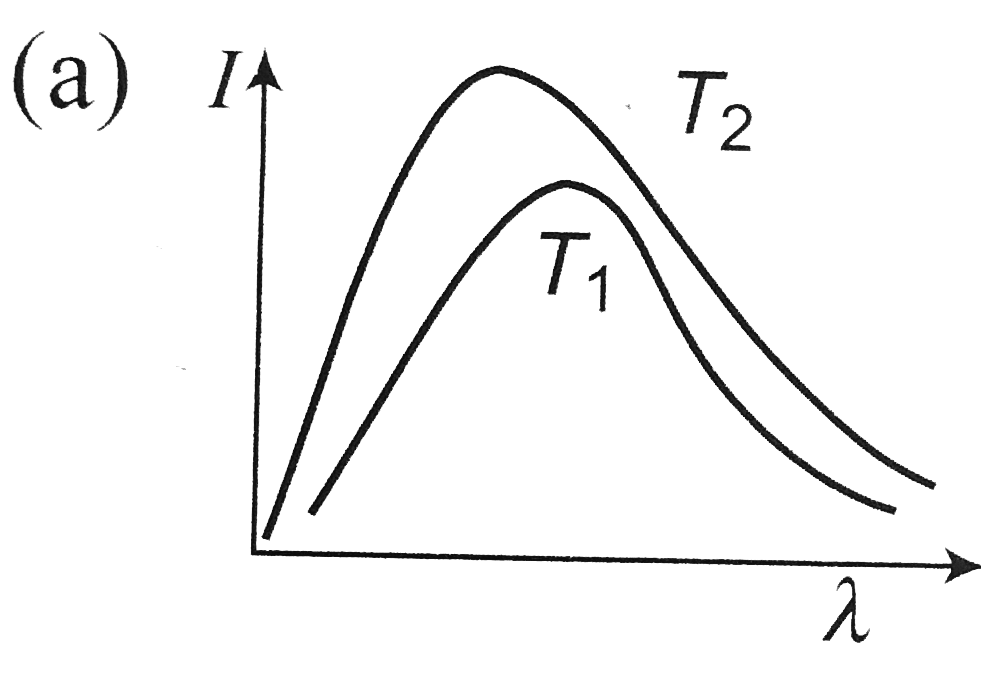 B
B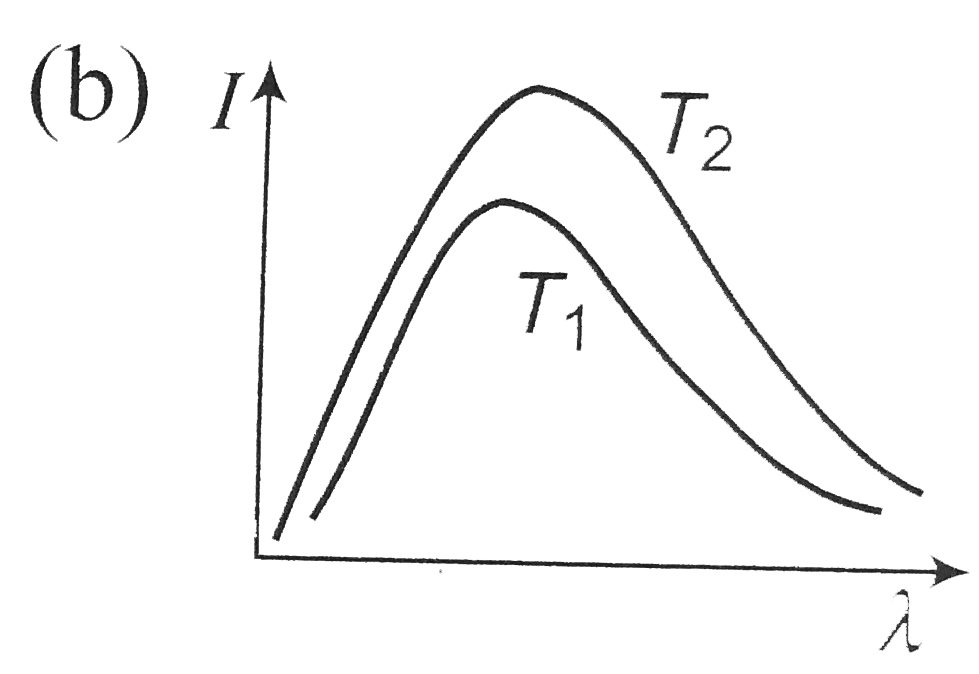 C
C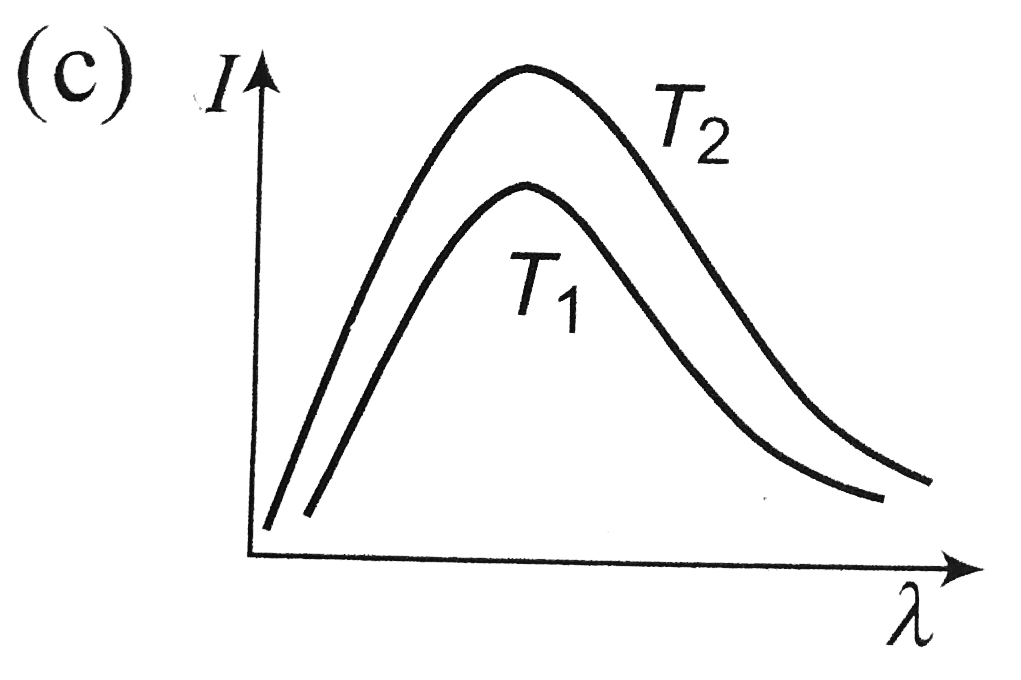 D
D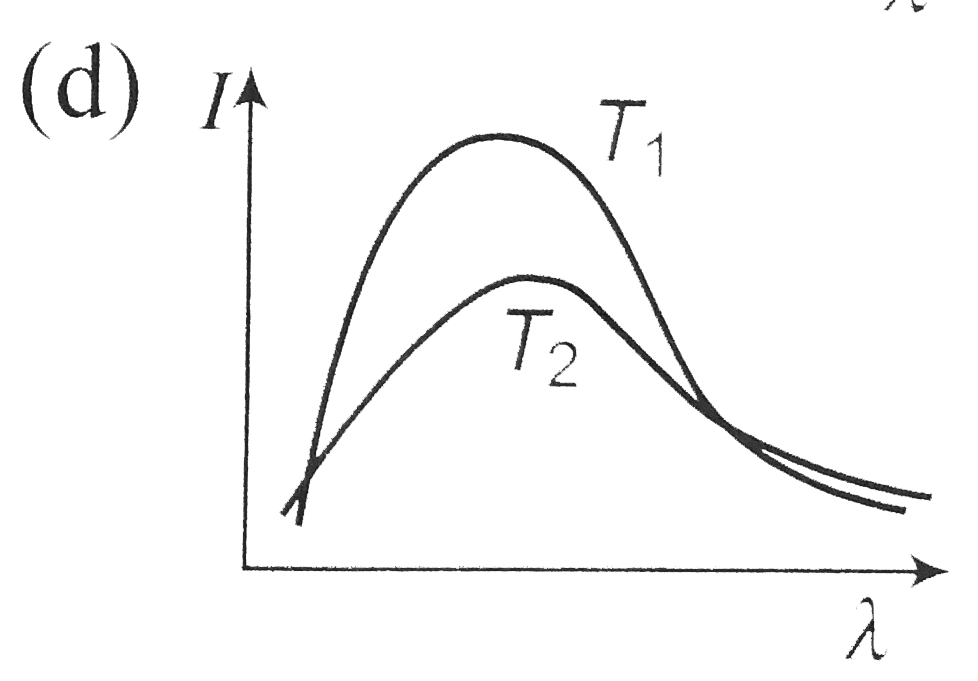
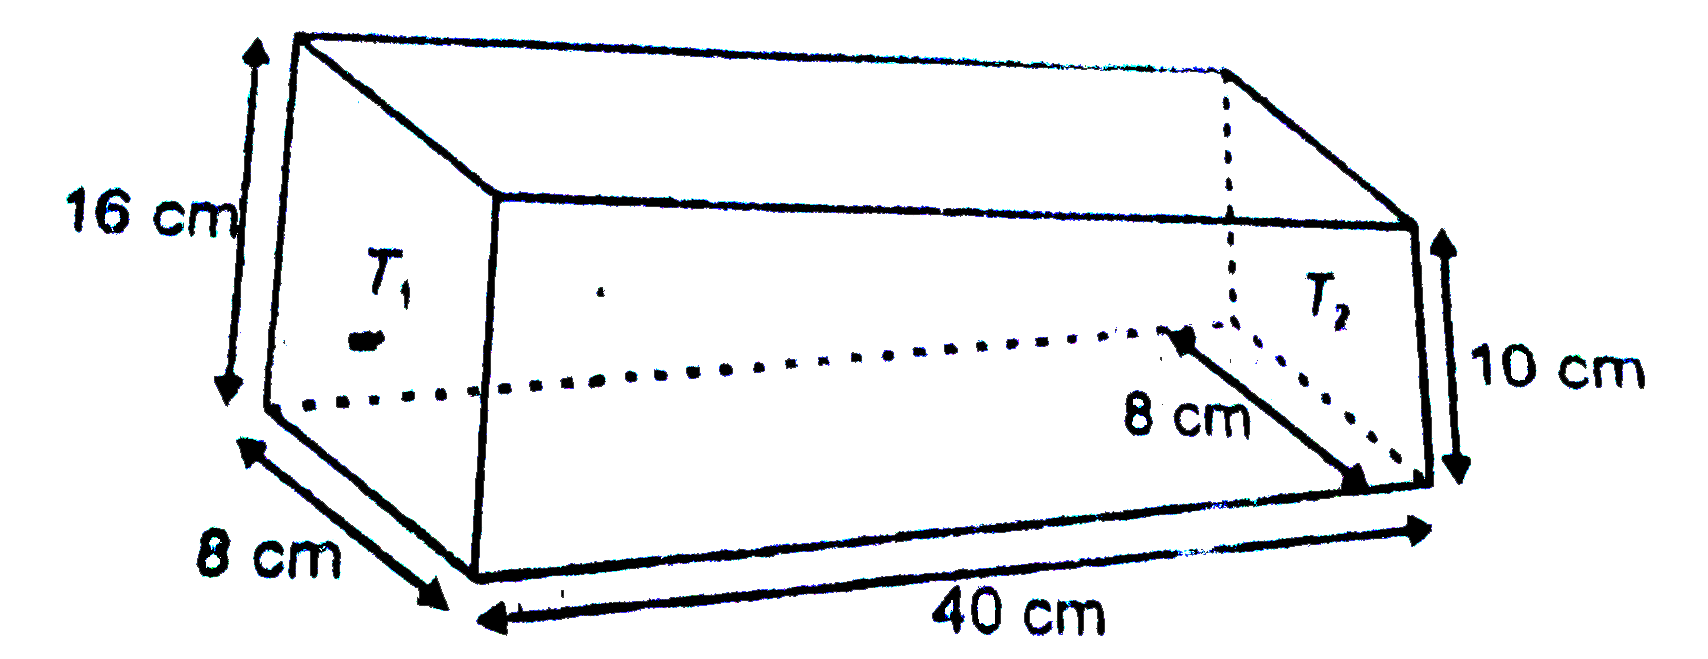
A slab of cunductivity k is in the shape of trapezoid as shown I figure. If the two end faces be maintained at temperature T1=50∘CandT2=25∘C, then determine the thermal current through the slab by ignoring any heat loss through the lateral surfaces.
 .
.
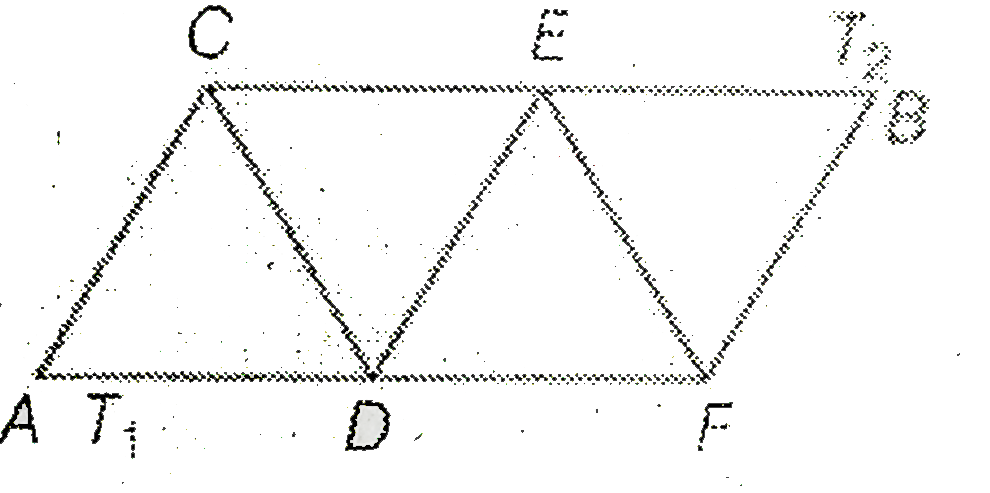
View SolutionNine identical conducting rods are arranged as shown in the figure. The ends A and B are maintained at temperatues T1 and T2. Calculate the ratio of rate of flow of heat across AD to that of EB in the given arrangement in steady state.
View SolutionThe V - i graph for a conductor at temperature T1 and T2 are as shown in the figure. (T2−T1) is proportional to
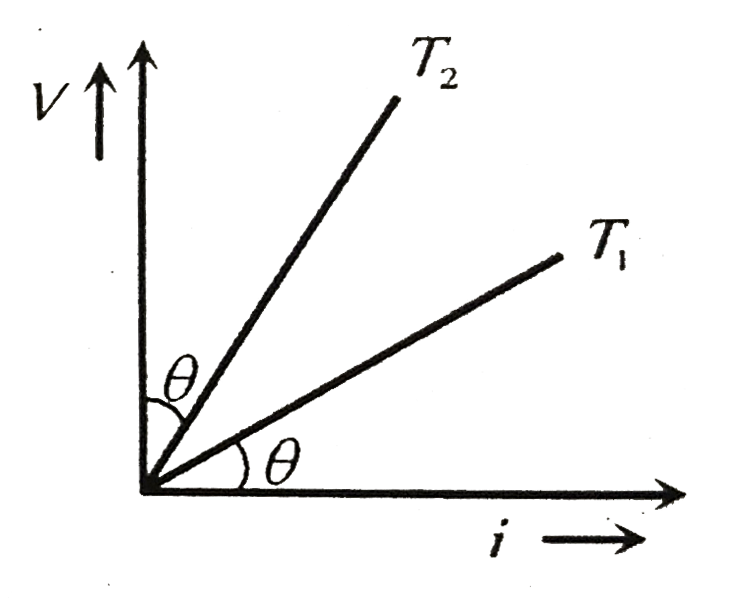
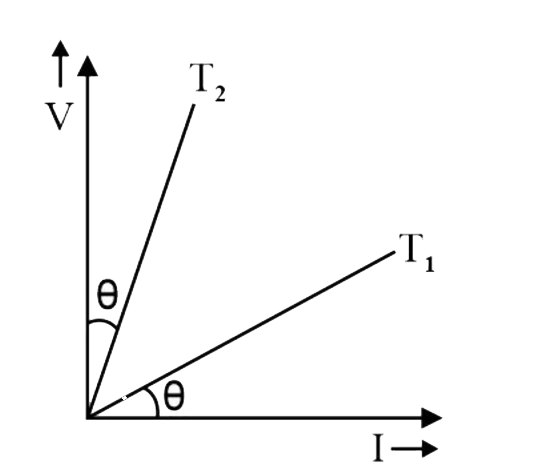
View SolutionThe V - I graphs for a conductor at temperature T1andT2 are shown in the figure (T2−T1) is proportional to
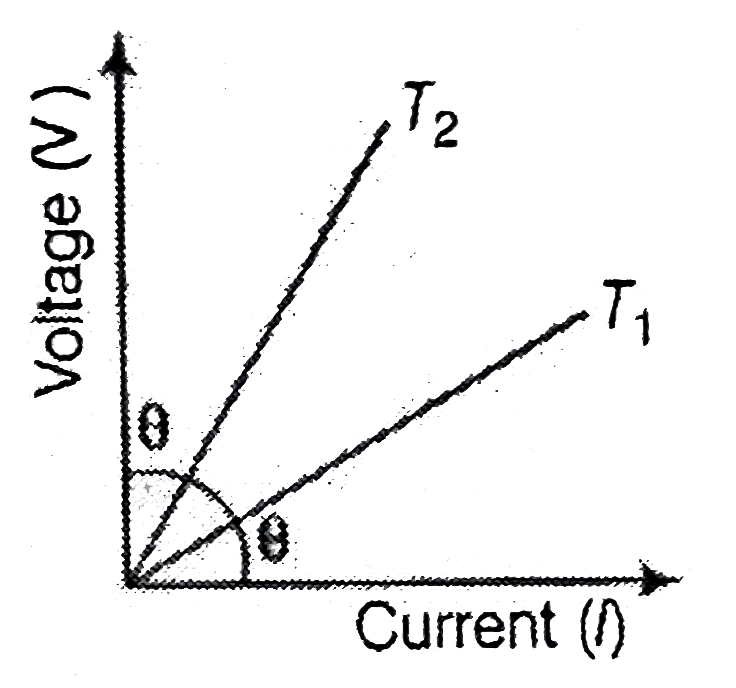
View SolutionThe V-l graph for a conductor at temperatures T1 and T2 are as shown in the figure. The term T2−T1 is proportional to
View Solution

