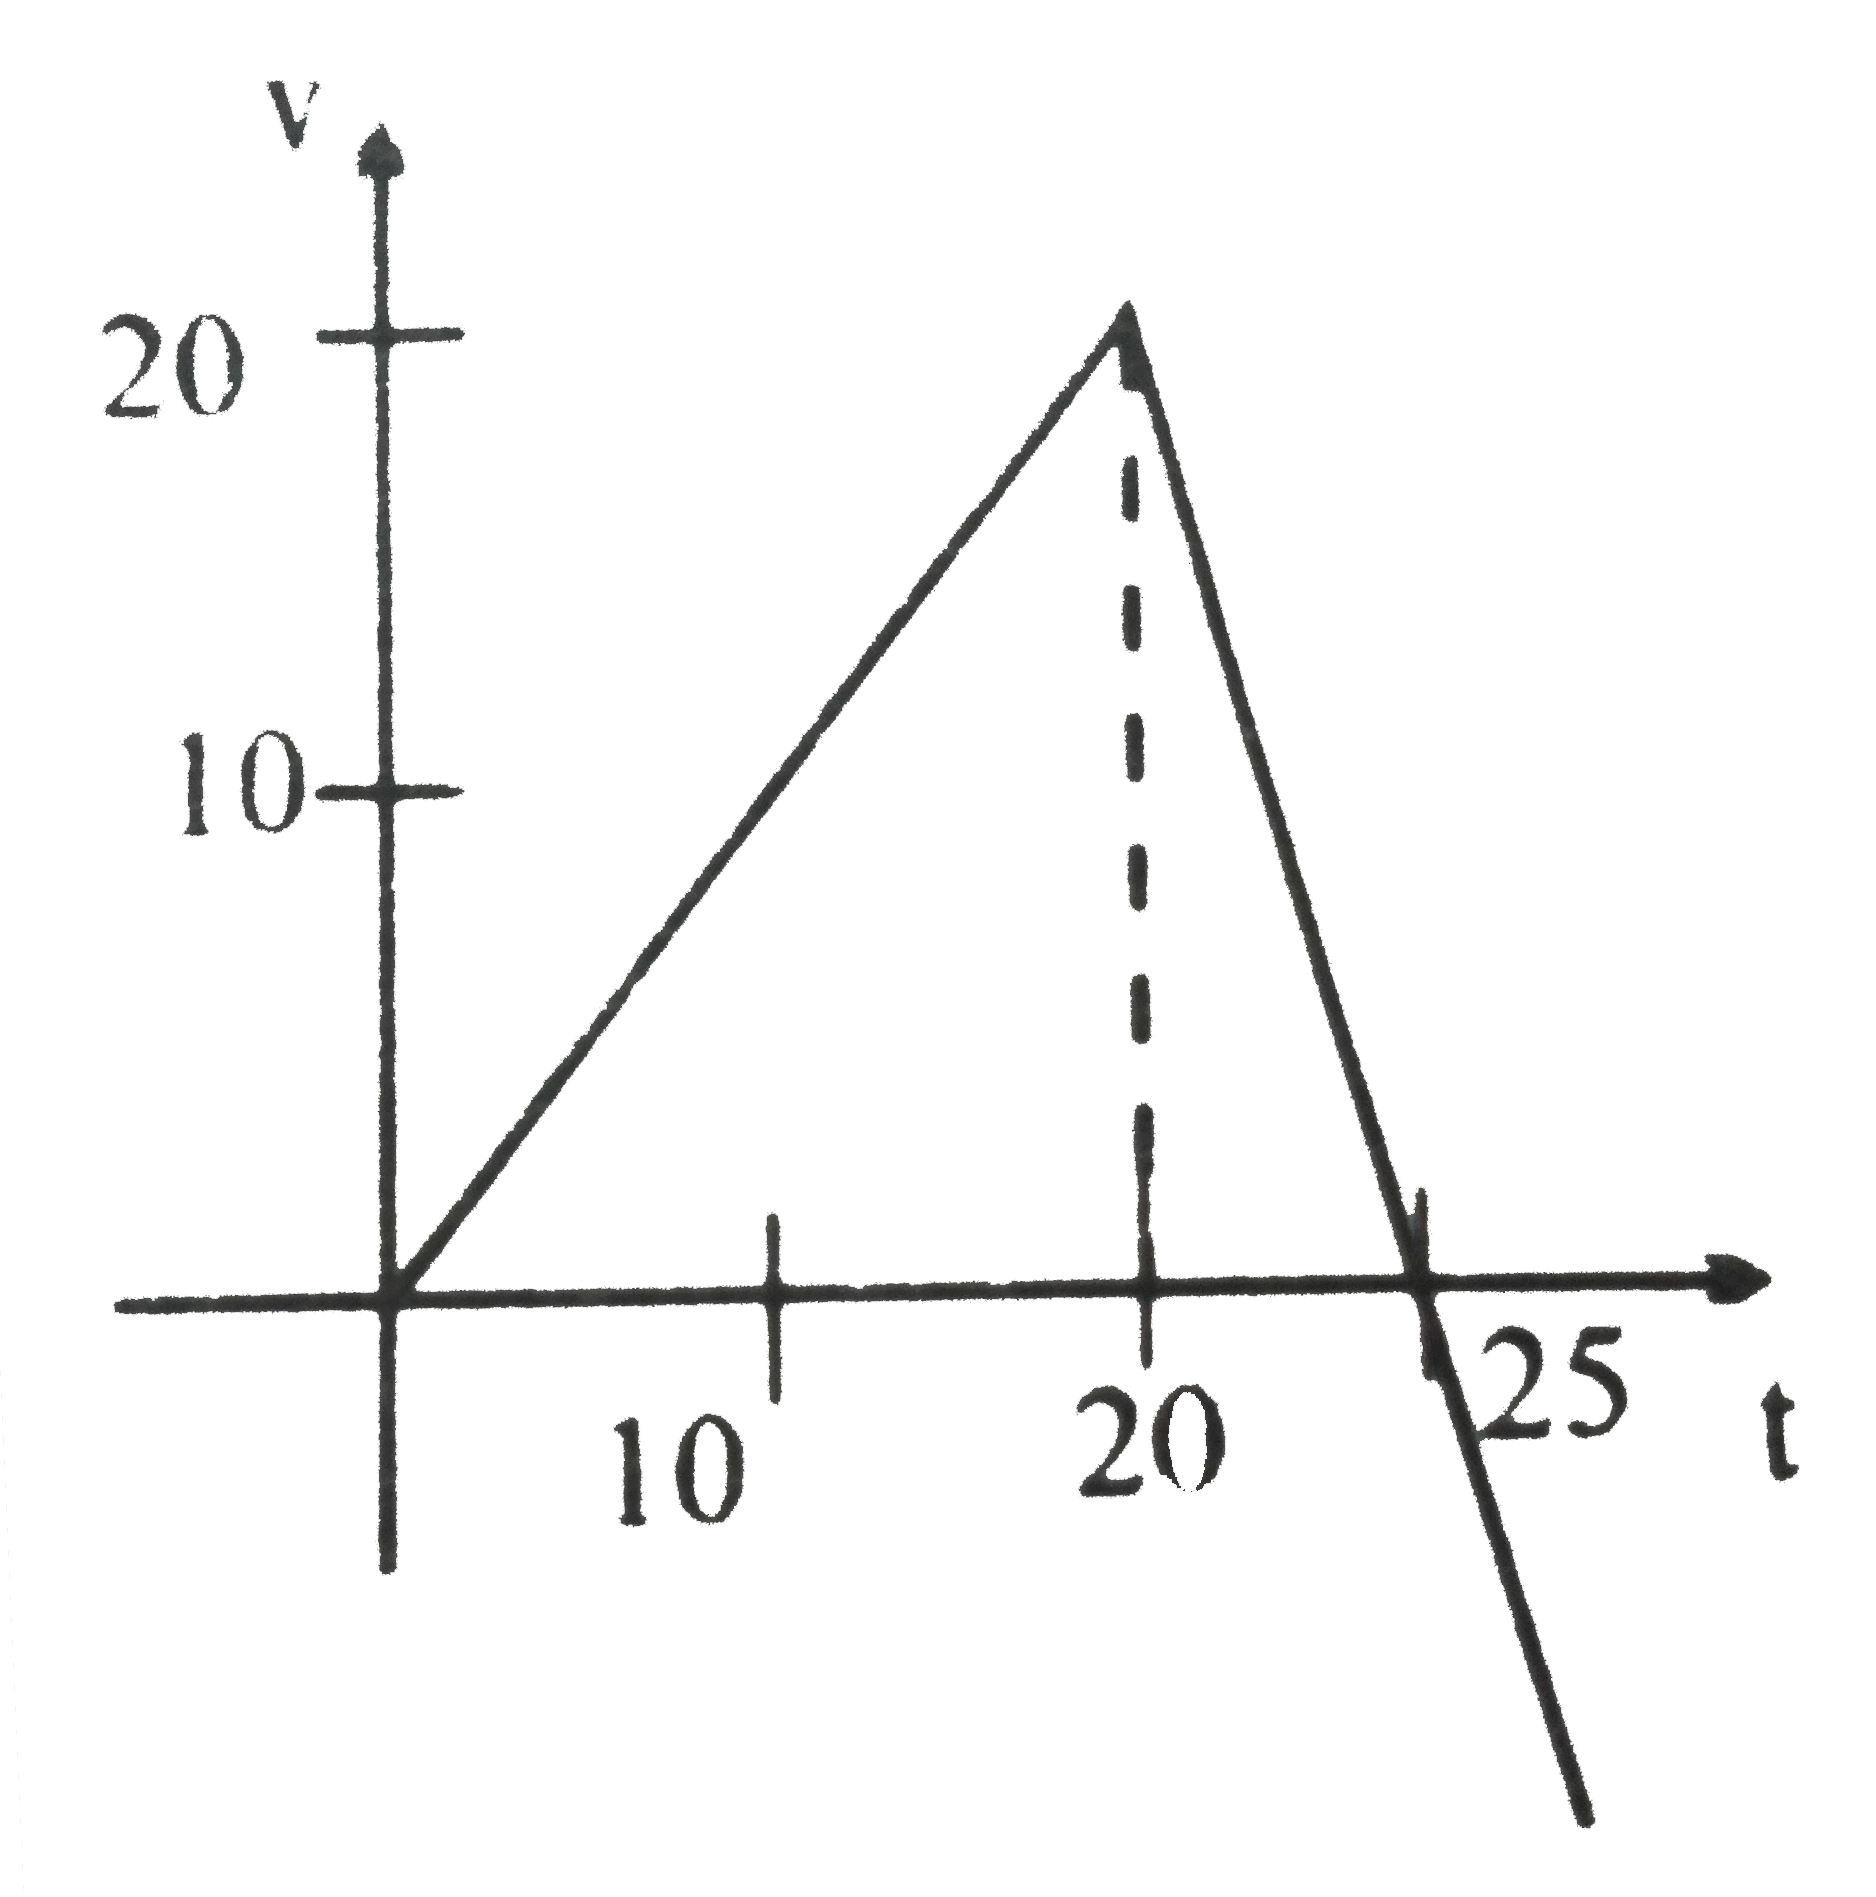
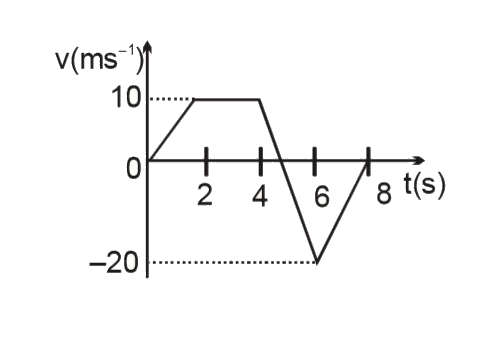
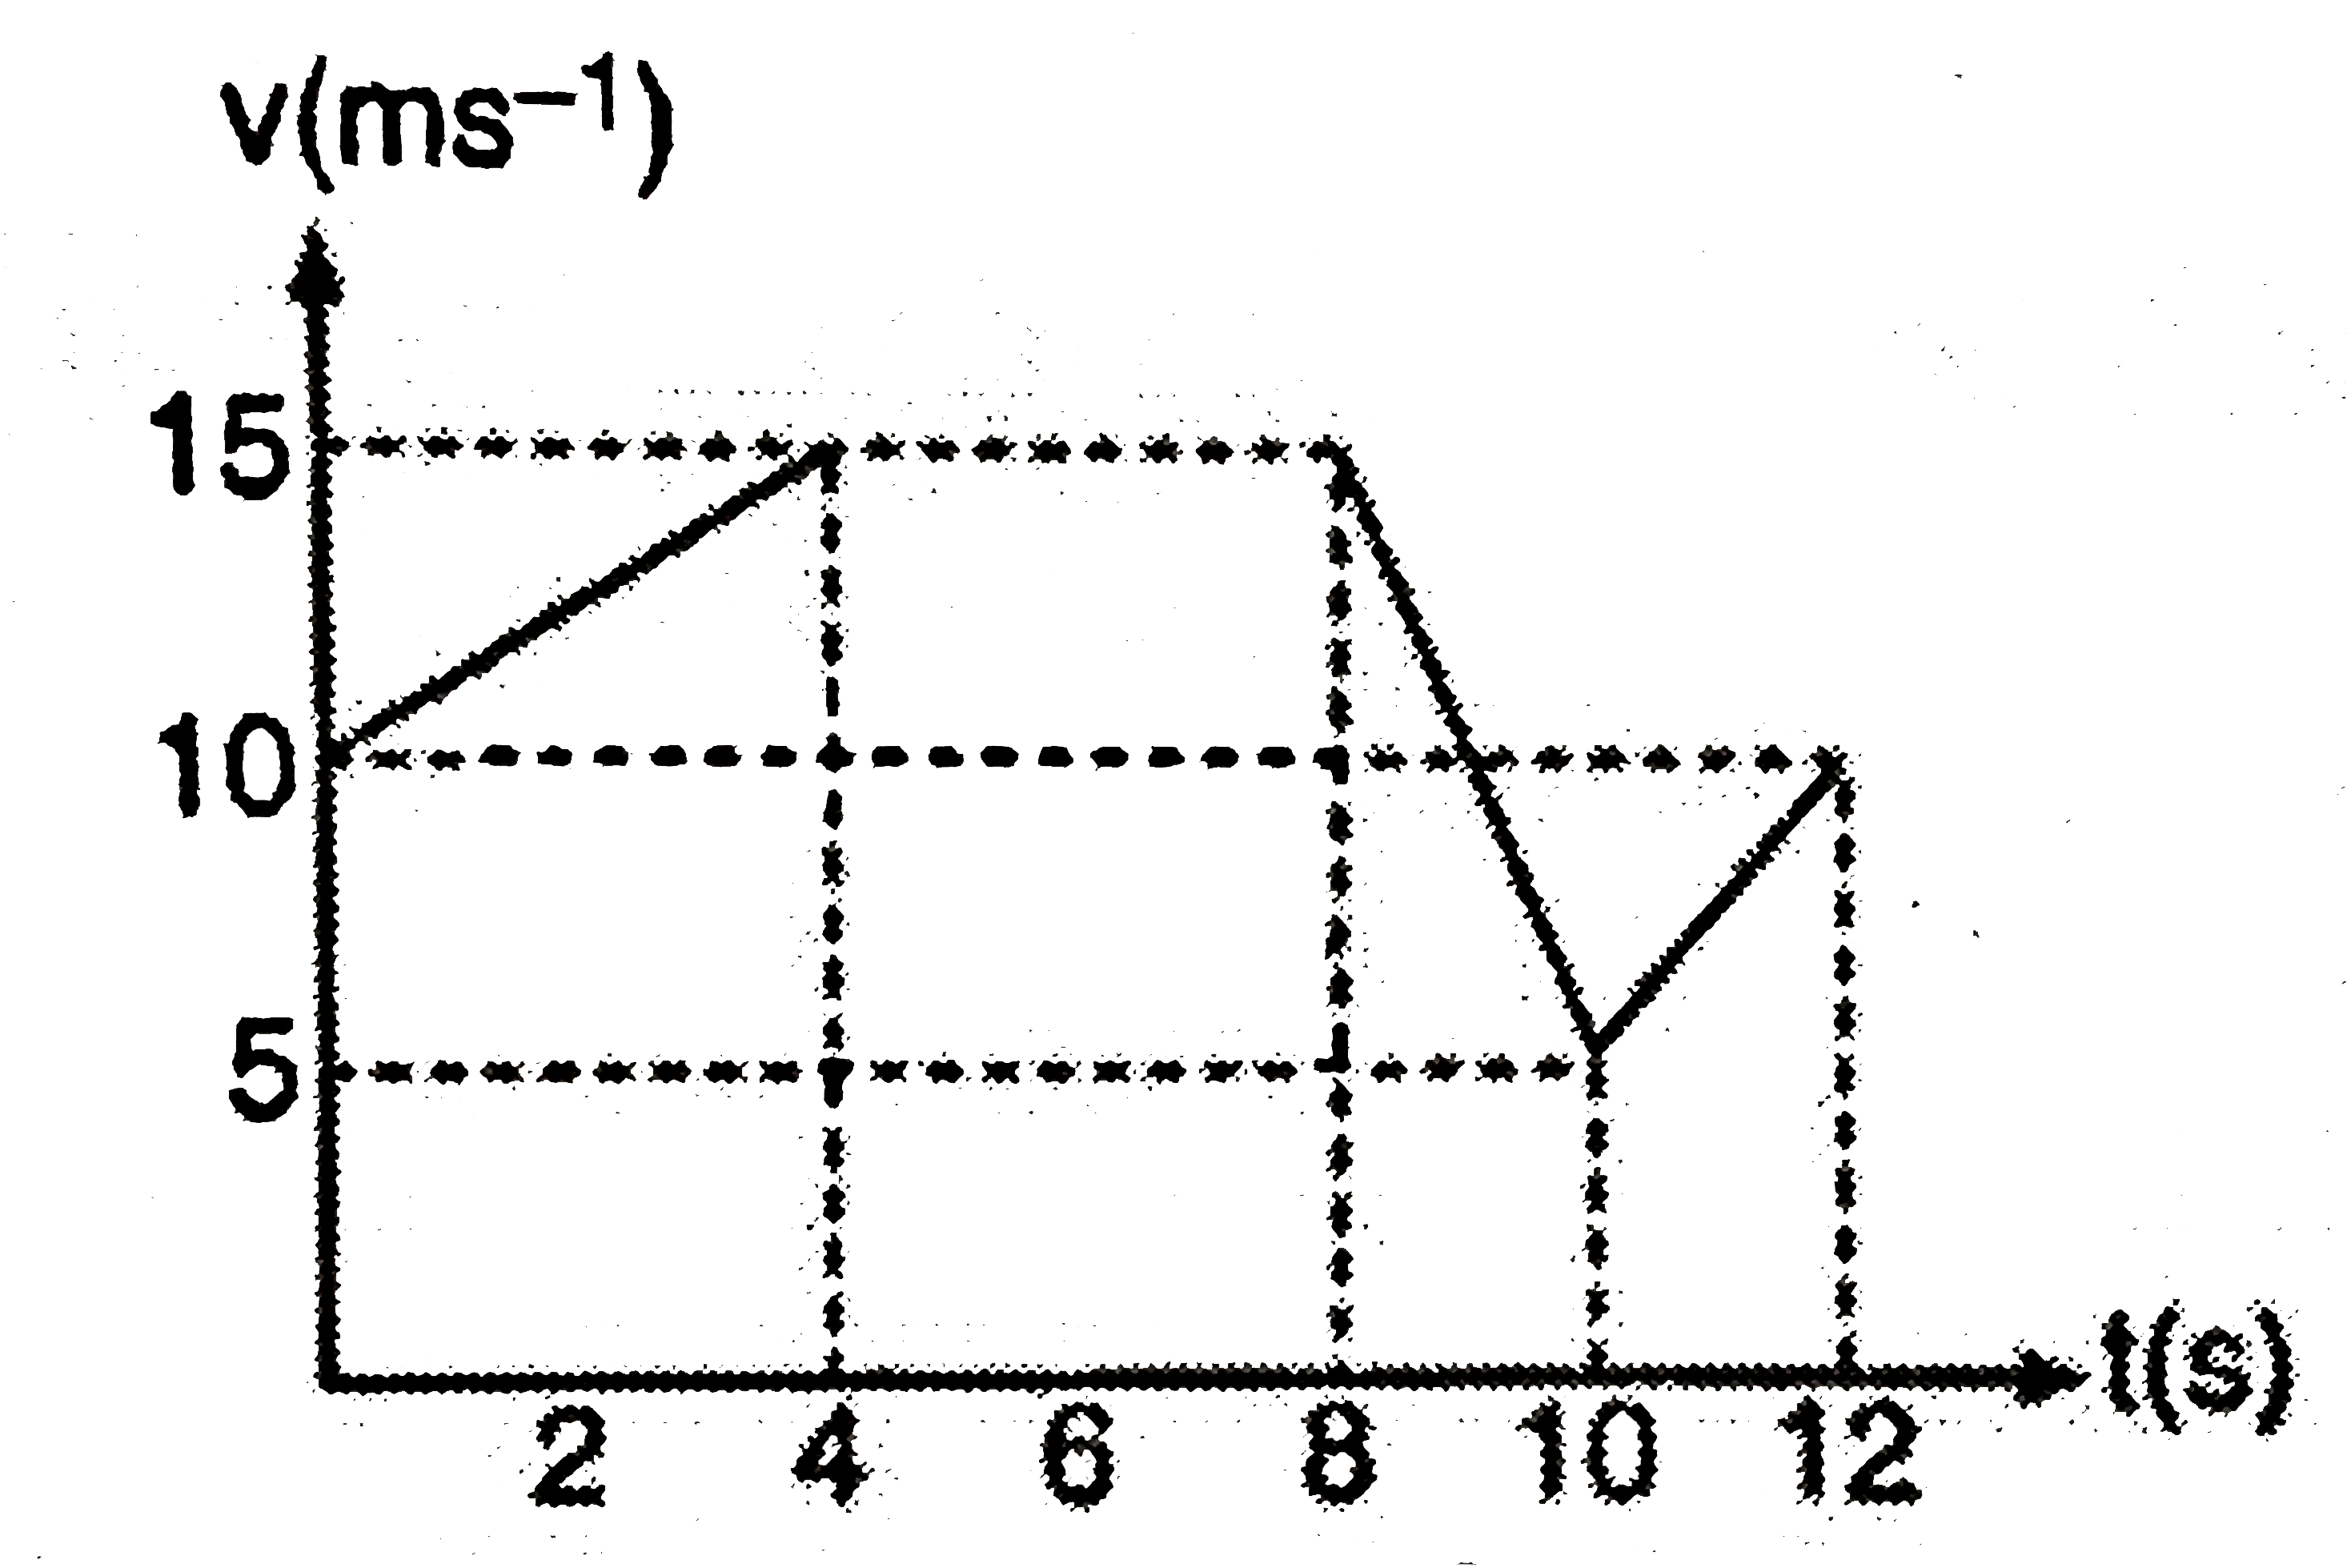
The fig. shows the v−t graph of a particle moving in straight line. Find the time when particle returns to the starting point.
30 sec
34.5 sec
36.2 sec
35.4 sec
The correct Answer is:C
For returning, the starting point
Area of (ΔOAB)= Area of (ΔBCD)
12×20×25=12×t×4t⇒t=5√5≅11.2
∴ Required time =25+11.2=36.2
Topper's Solved these Questions
- KINEMATICSBook:ALLENChapter:KINEMATICSExercise:EXERCISE-03
Explore 6 Videos
- KINEMATICSBook:ALLENChapter:KINEMATICSExercise:Assertion-Reason
Explore 20 Videos
- KINEMATICSBook:ALLENChapter:KINEMATICSExercise:EXERCISE-01
Explore 55 Videos
- ERROR AND MEASUREMENTBook:ALLENChapter:ERROR AND MEASUREMENTExercise:Part-2(Exercise-2)(B)
Explore 22 Videos
- KINEMATICS (MOTION ALONG A STRAIGHT LINE AND MOTION IN A PLANE)Book:ALLENChapter:KINEMATICS (MOTION ALONG A STRAIGHT LINE AND MOTION IN A PLANE)Exercise:BEGINNER S BOX-7
Explore 8 Videos
Similar Questions
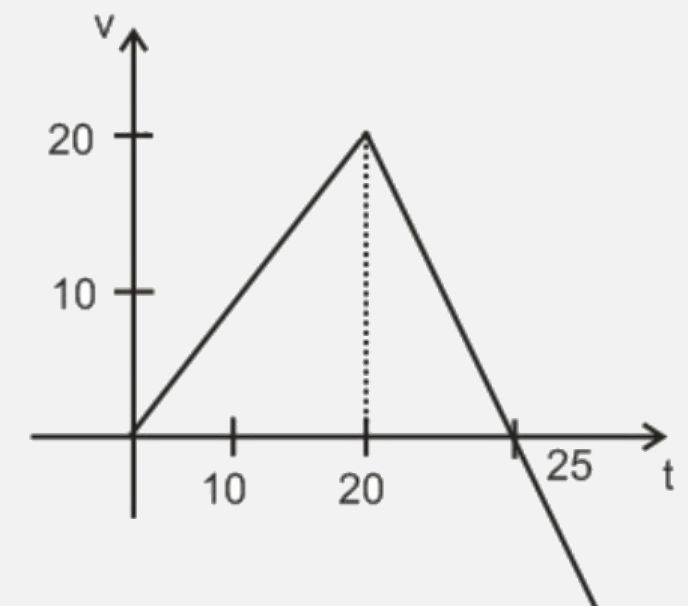
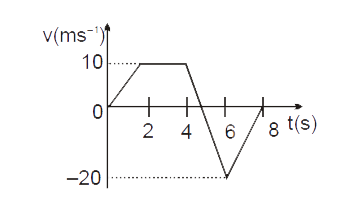
The figure shows the v−t graph of a particle moving in a straight line. Starting from rest, the time after which the particle returns to its starting position is
View SolutionThe figure shows a velocity-time graph of a particle moving along a straight line
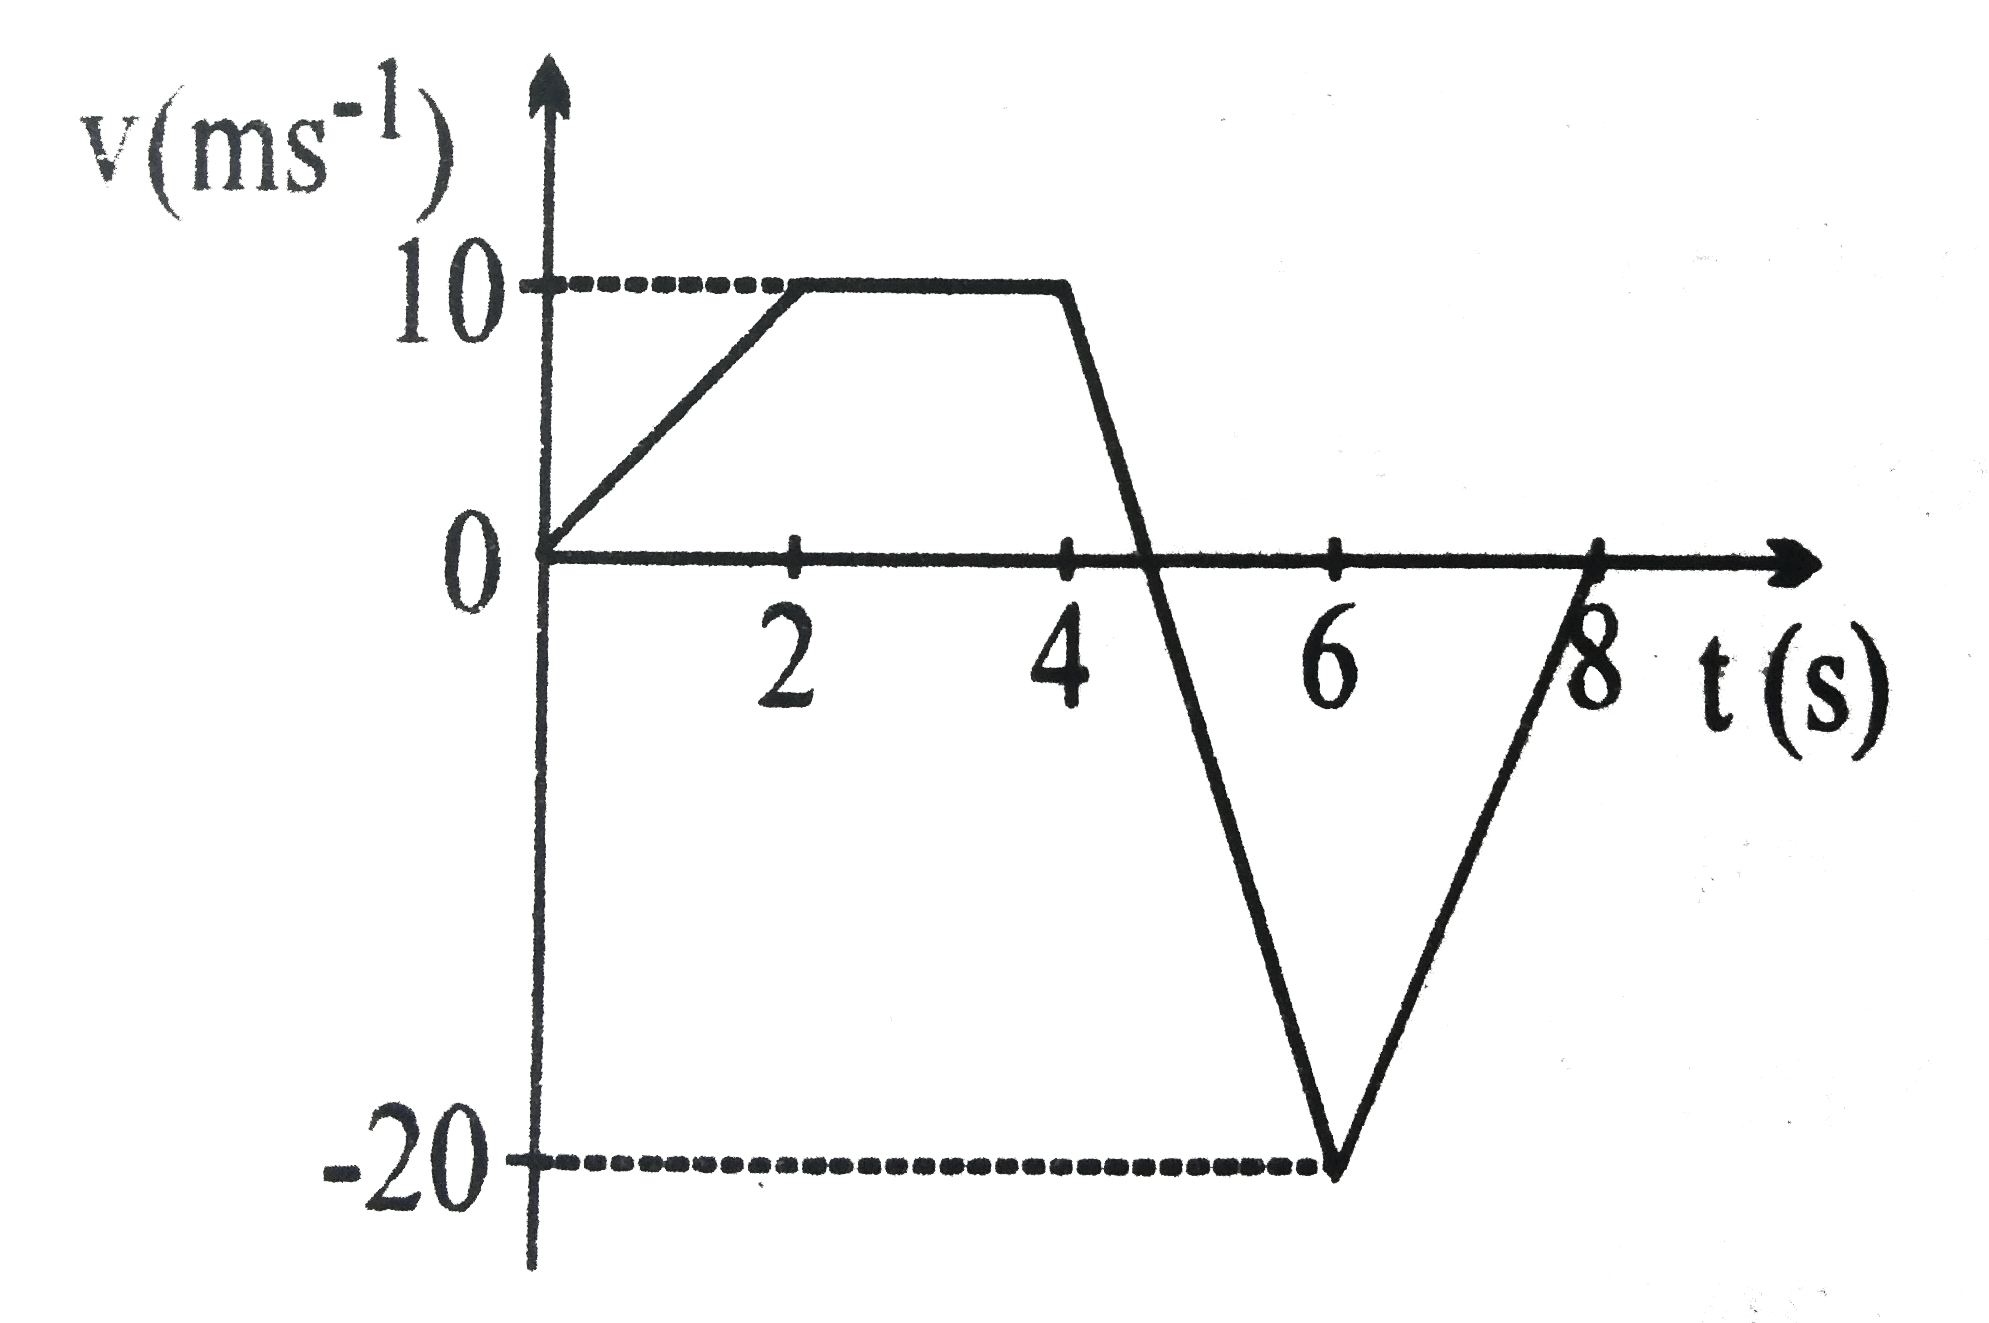
The maximum displacement of the particle is
View Solution
Knowledge Check
The figure shows a velocity-time graph of a particle moving along a straight line
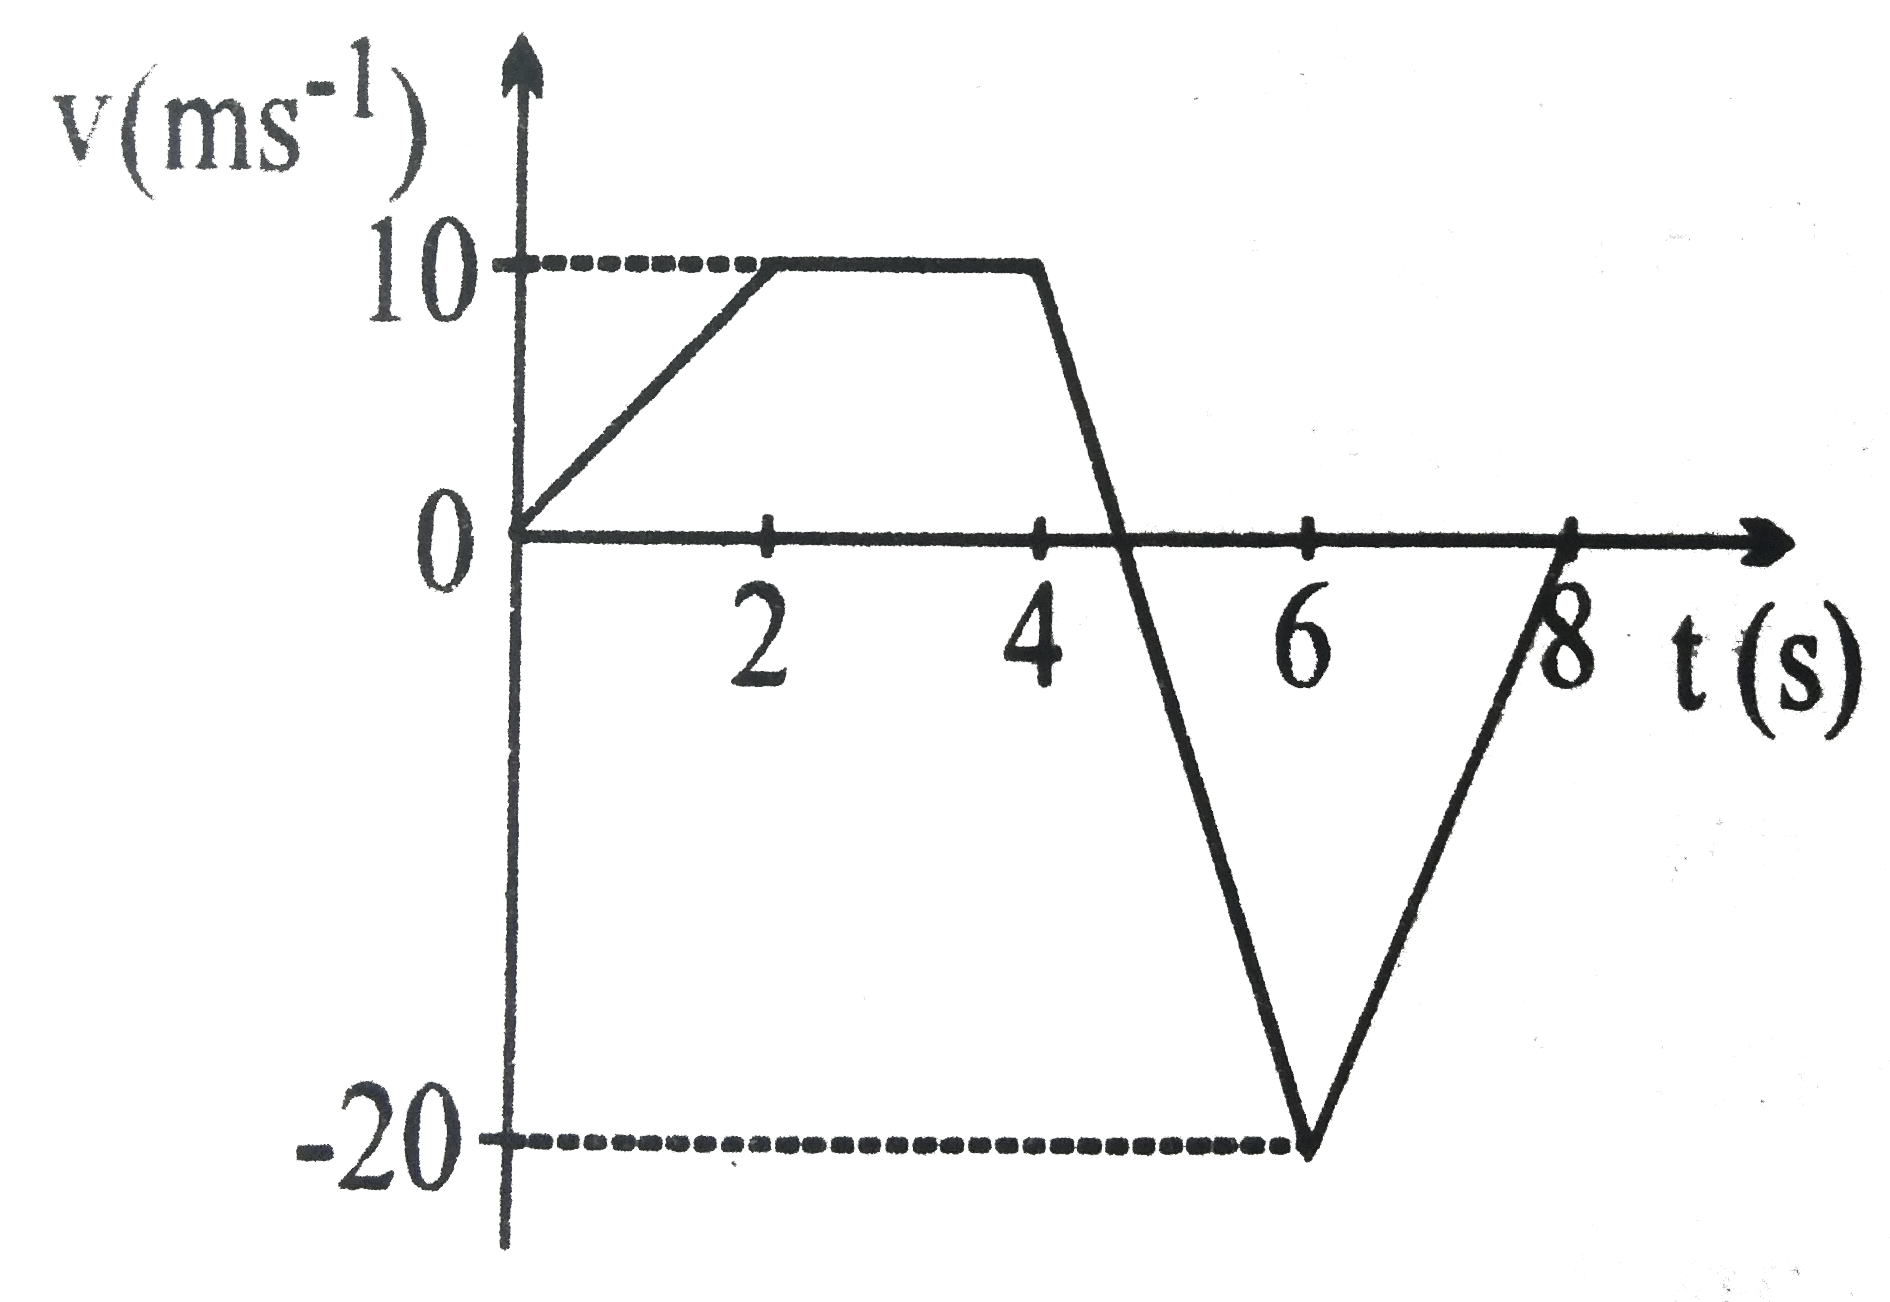
If the particles starts form the position x0=−15m, then its position at t=2s will beA−5B5mC10mD15mThe figure shows a velocity-time graph of a particle moving along a straight line
Q. If the particle starts from the position x0 = –15 m, then its position at t = 2s will beA−5mB5mC10mD15mThe figure shows a velocity-time graph of a particle moving along a straight line
If the particle starts from the position x0=–15 m, then its position at t = 2s will beA−5mB5mC10 mD15 m
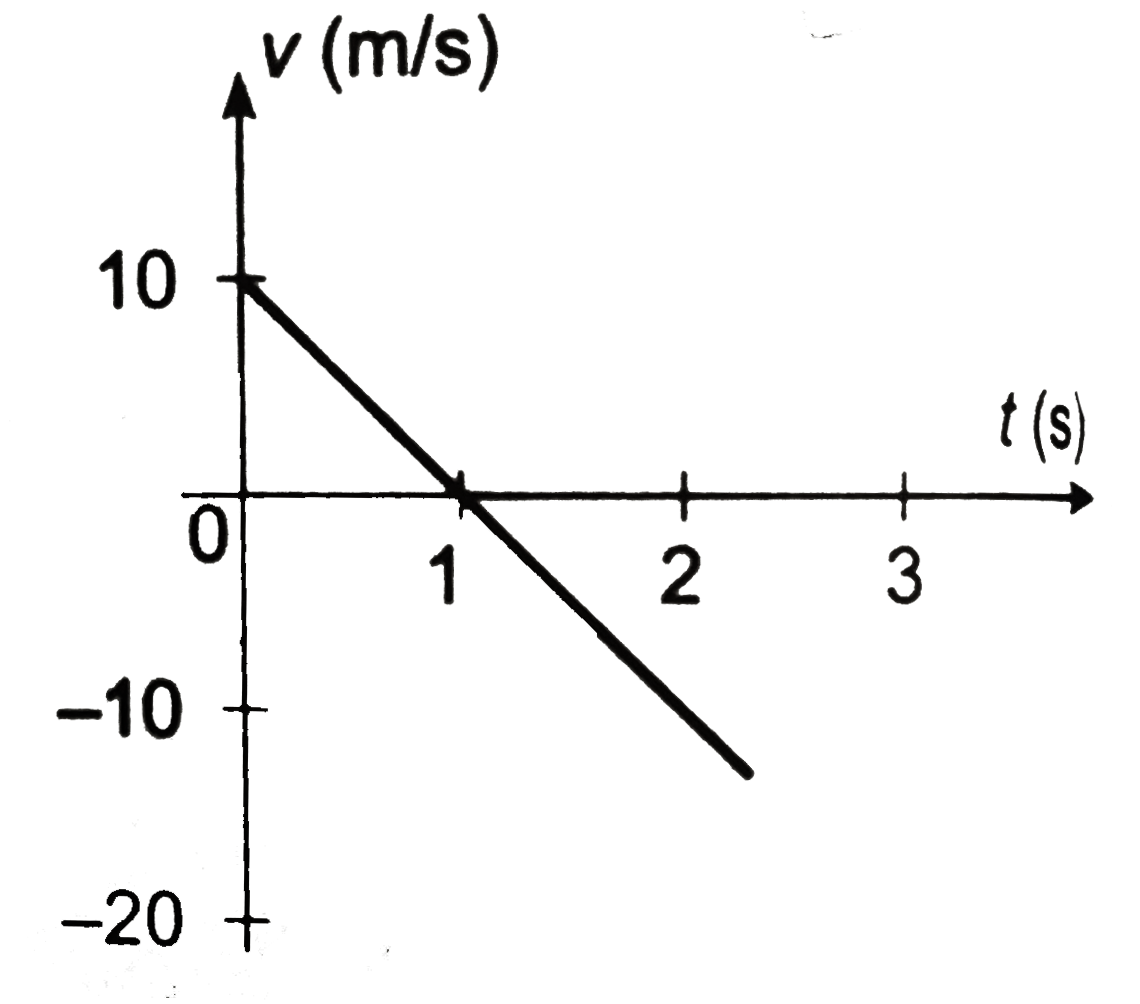
The figure shows velocity-time graph of a particle moving along a straight line. Identify the correct statement.
View SolutionThe figure shows a velocity-time graph of a particle moving along a straight line
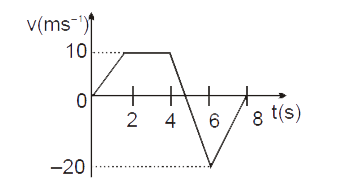
The maximum of displacement of the particle is
View SolutionThe velocity -time (v−t) graph of a particle moving in a straight line is shown in figure. The acceleration of the particle at t=9 is:
View SolutionThe diagram shows the displacement-time graph for a particle moving in a straight line. Find the average velocity for the interval from t=0 to t=5s.
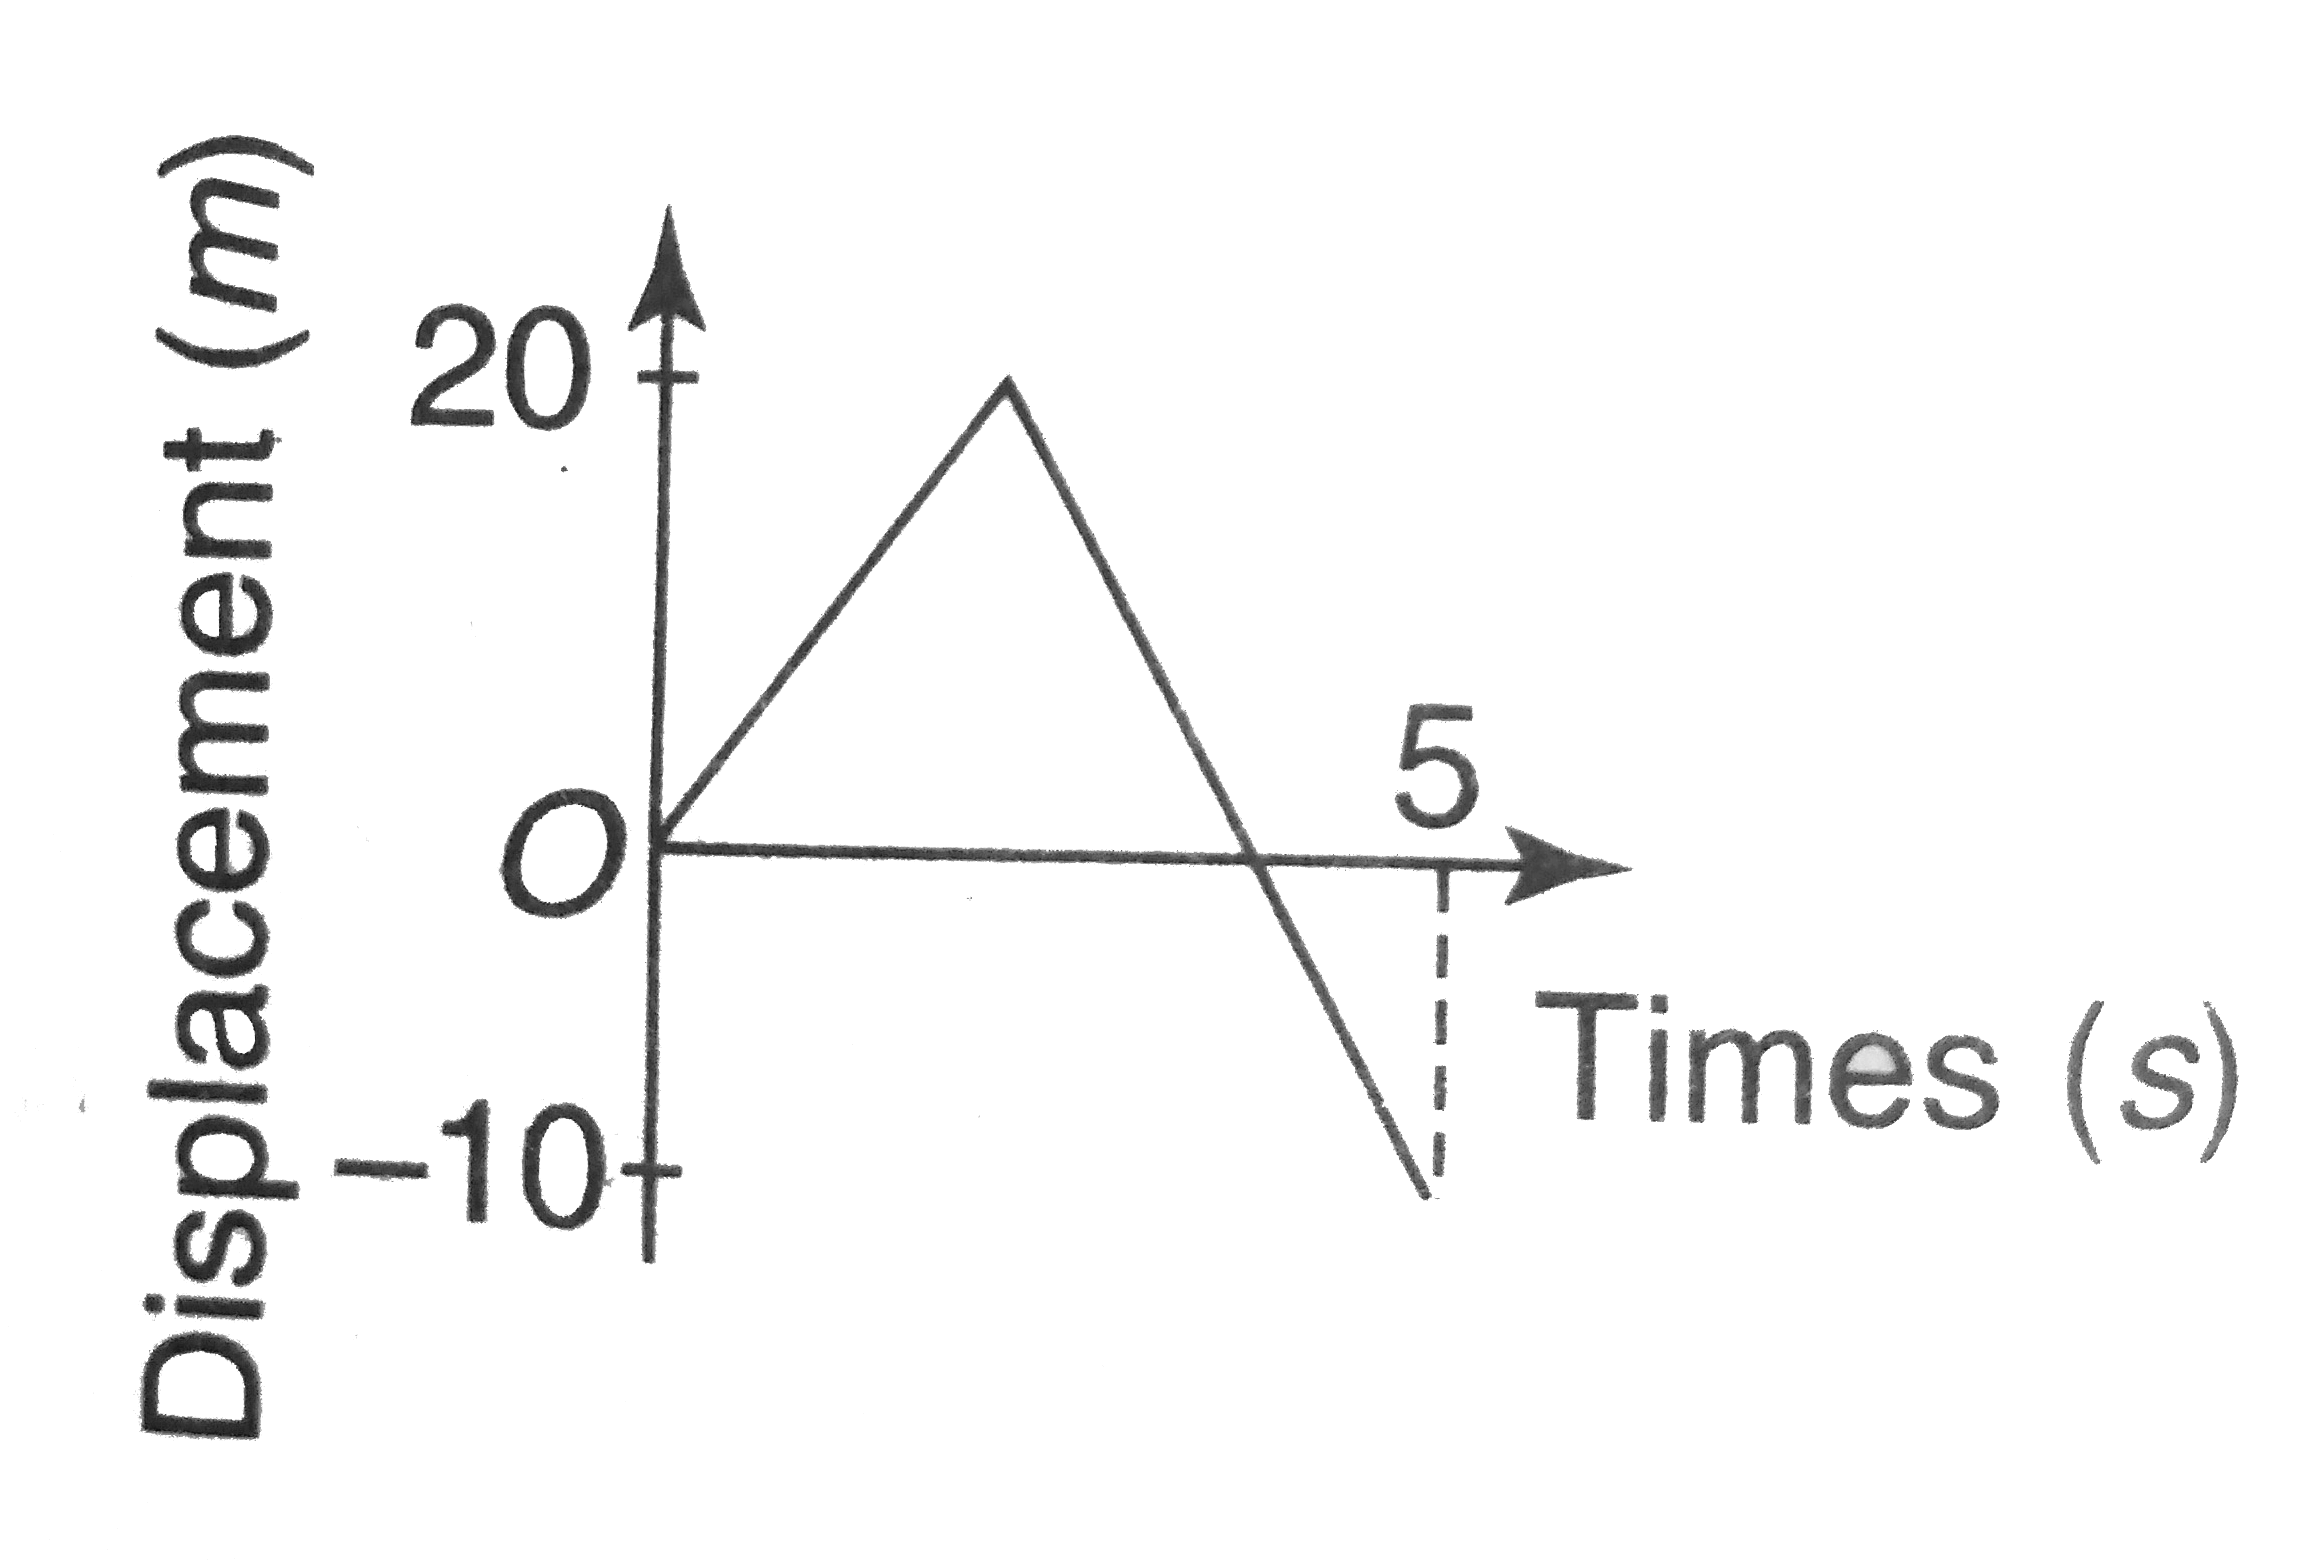
View SolutionThe diagram shows the displacement-time graph for a particle moving in a straight line. Find the average velocity for the interval from t=0 to t=5s.

View Solution

