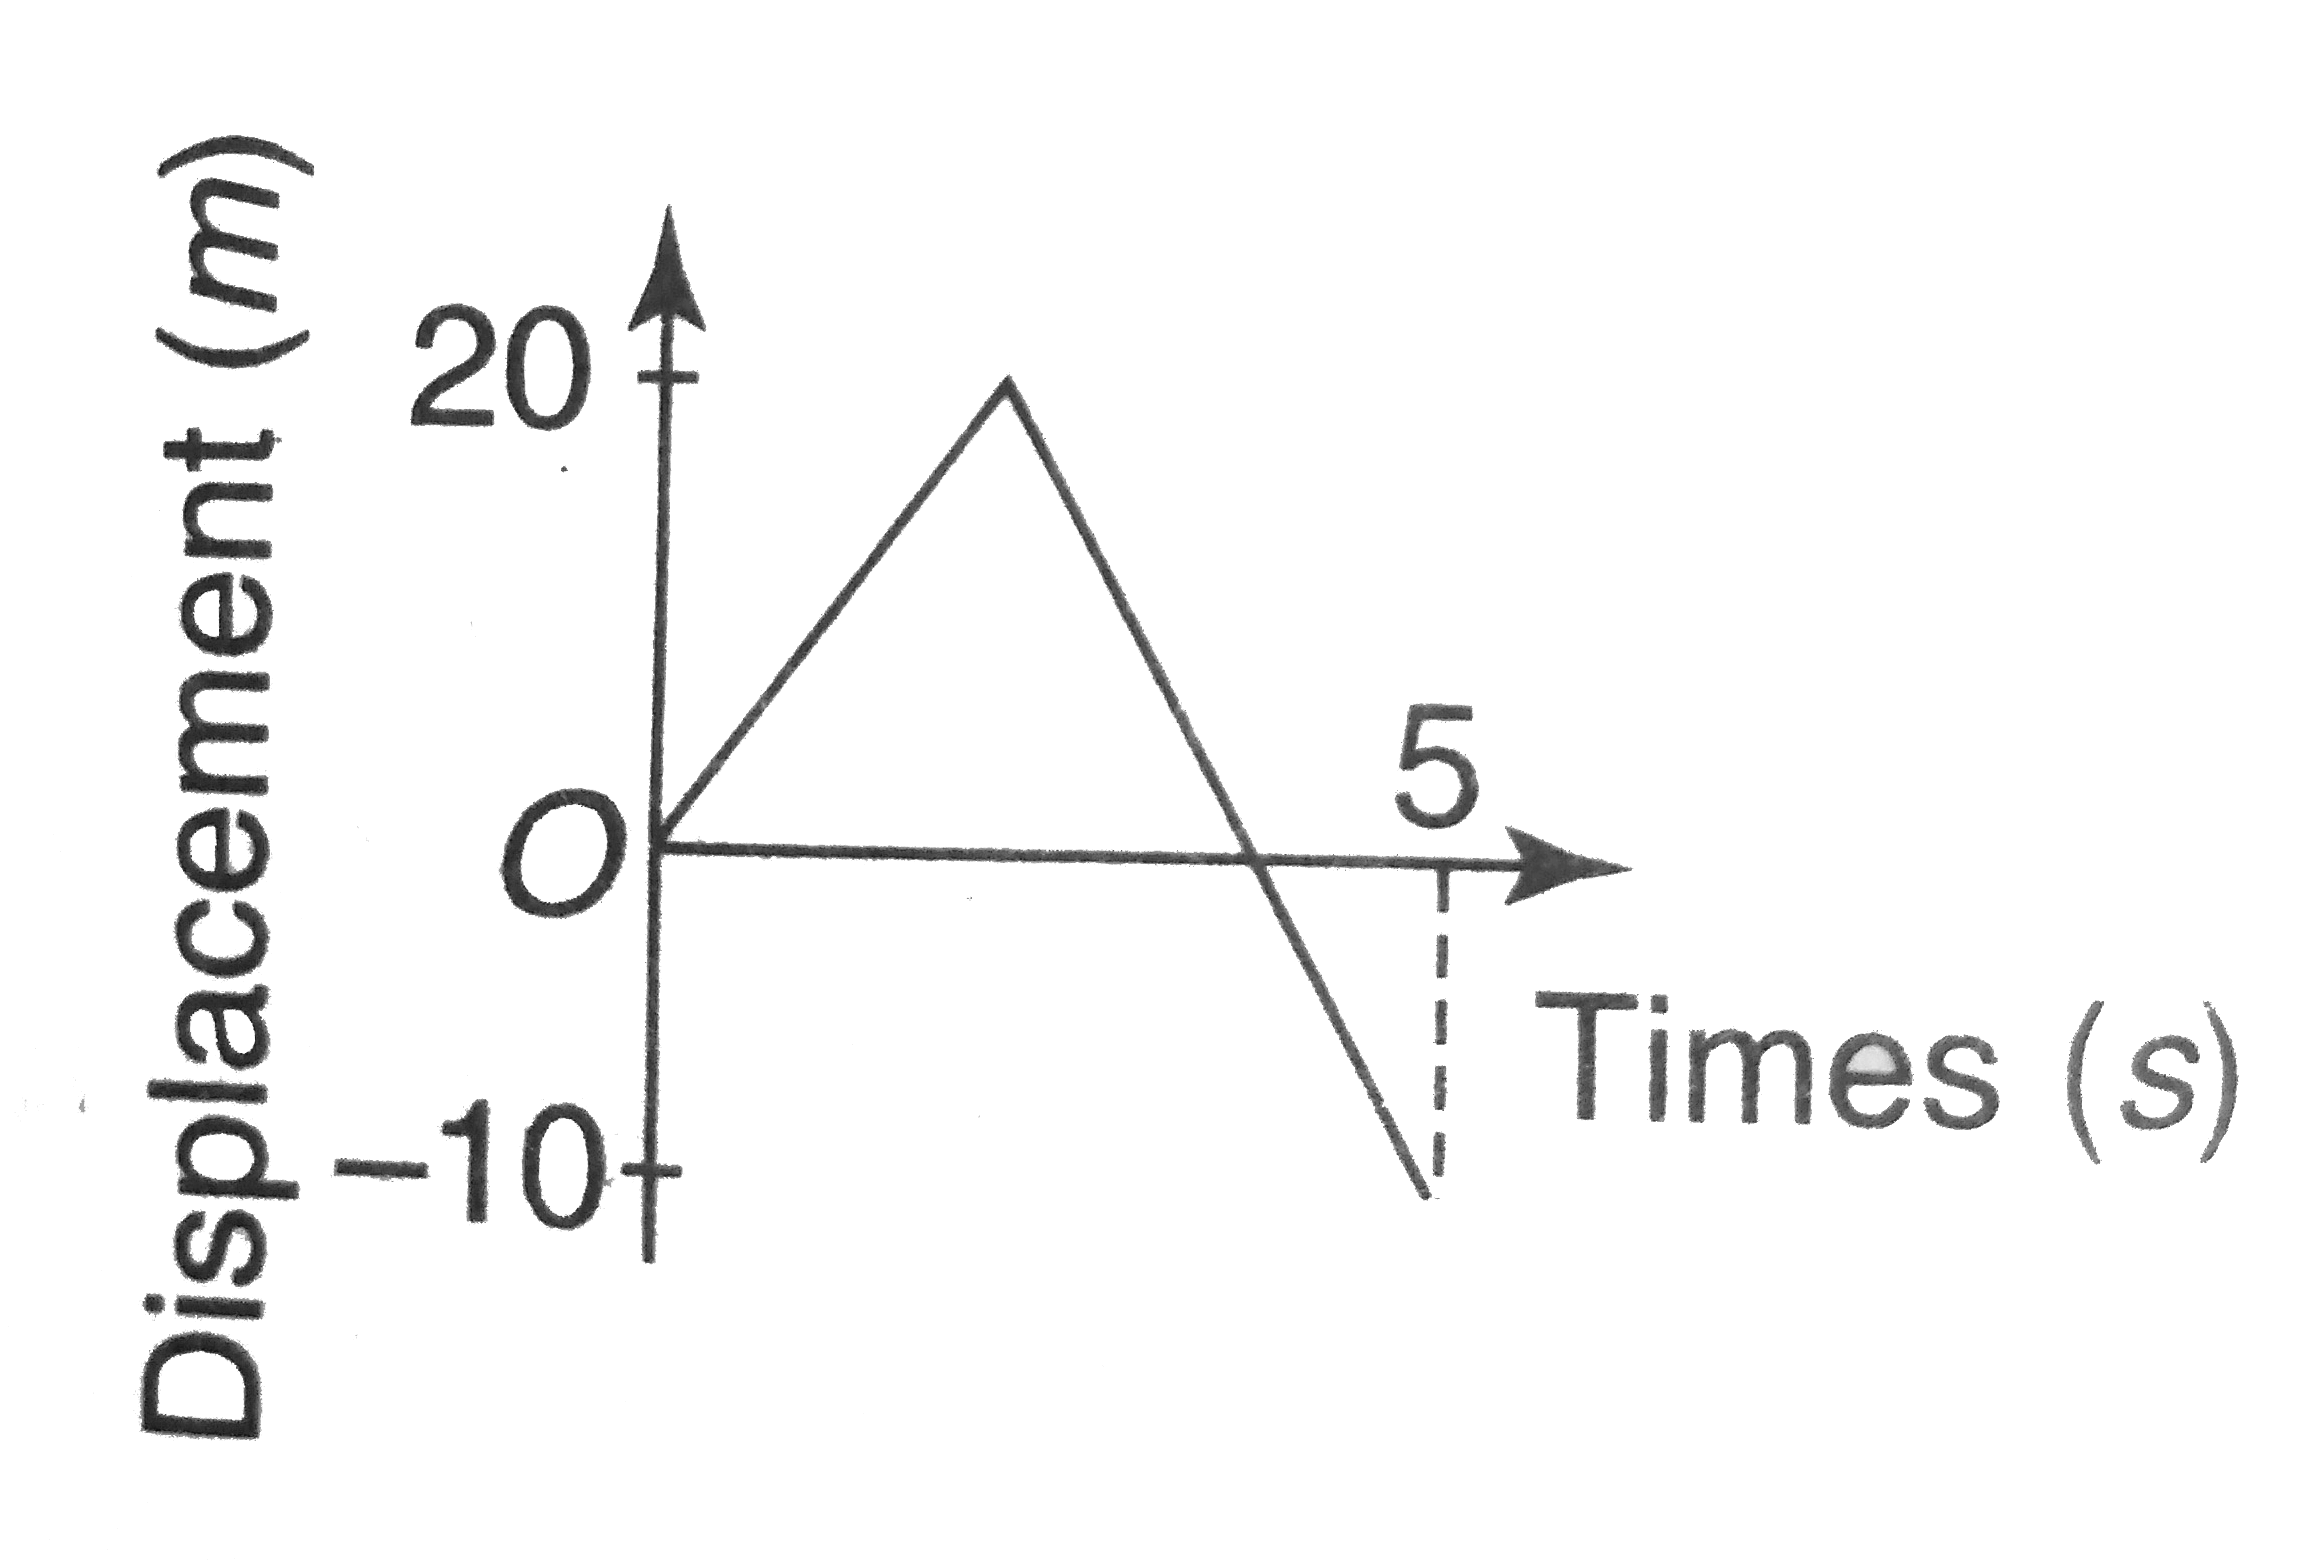
The diagram shows the displacement-time graph for a particle moving in a straight line. Find the average velocity for the interval from t=0 to t=5s.
−2ms−1
2ms−1
−4ms−1
4ms−1
The correct Answer is:A
Displacement =−10−0=−10
Average velocity =−105=−2m/s.
Topper's Solved these Questions
- GENERAL KINEMATICS AND MOTION IN ONE DIMENSIONBook:A2ZChapter:GENERAL KINEMATICS AND MOTION IN ONE DIMENSIONExercise:Problem Based On Mixed Concepts
Explore 30 Videos
- GENERAL KINEMATICS AND MOTION IN ONE DIMENSIONBook:A2ZChapter:GENERAL KINEMATICS AND MOTION IN ONE DIMENSIONExercise:Assertion Reasoning
Explore 20 Videos
- GENERAL KINEMATICS AND MOTION IN ONE DIMENSIONBook:A2ZChapter:GENERAL KINEMATICS AND MOTION IN ONE DIMENSIONExercise:Relative Motion In One Dimension
Explore 20 Videos
- FLUID MECHANICSBook:A2ZChapter:FLUID MECHANICSExercise:Chapter Test
Explore 29 Videos
- GRAVITATIONBook:A2ZChapter:GRAVITATIONExercise:Chapter Test
Explore 29 Videos
Similar Questions
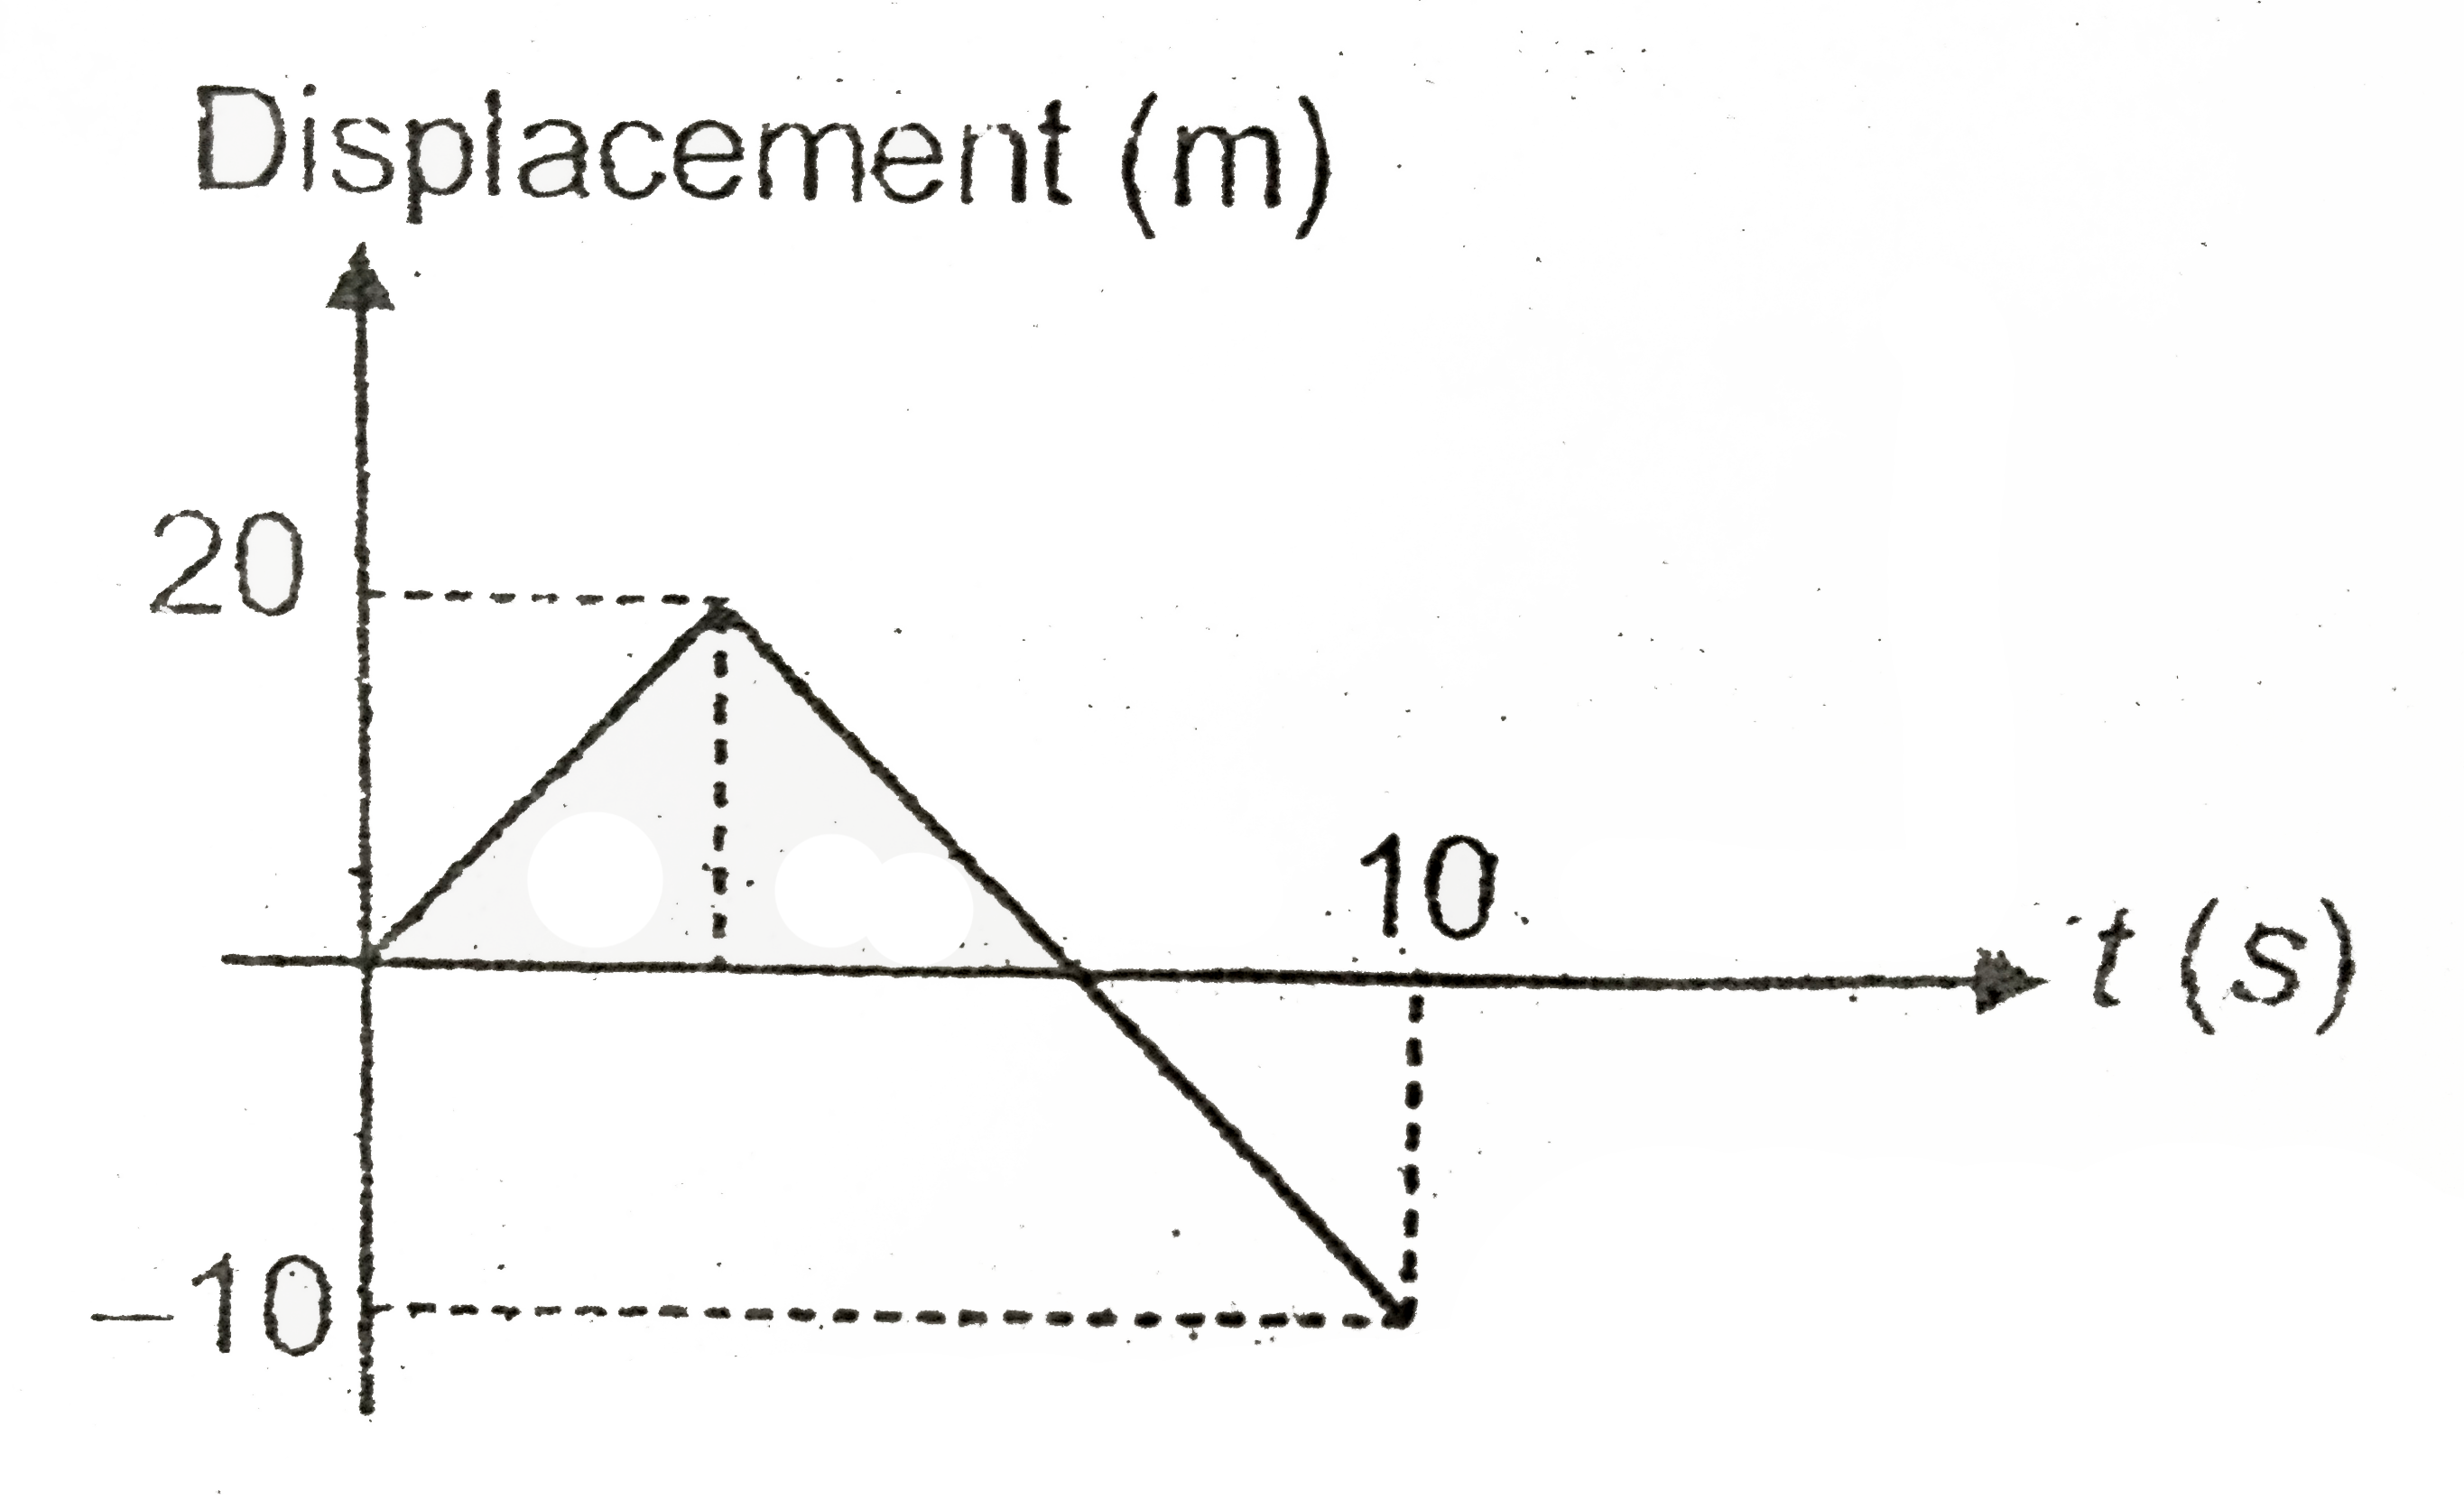
The diagram shows the displacement-time graph for the particle moving in a straight line. What is average speed (in m/s) for the interval 0-10 s?
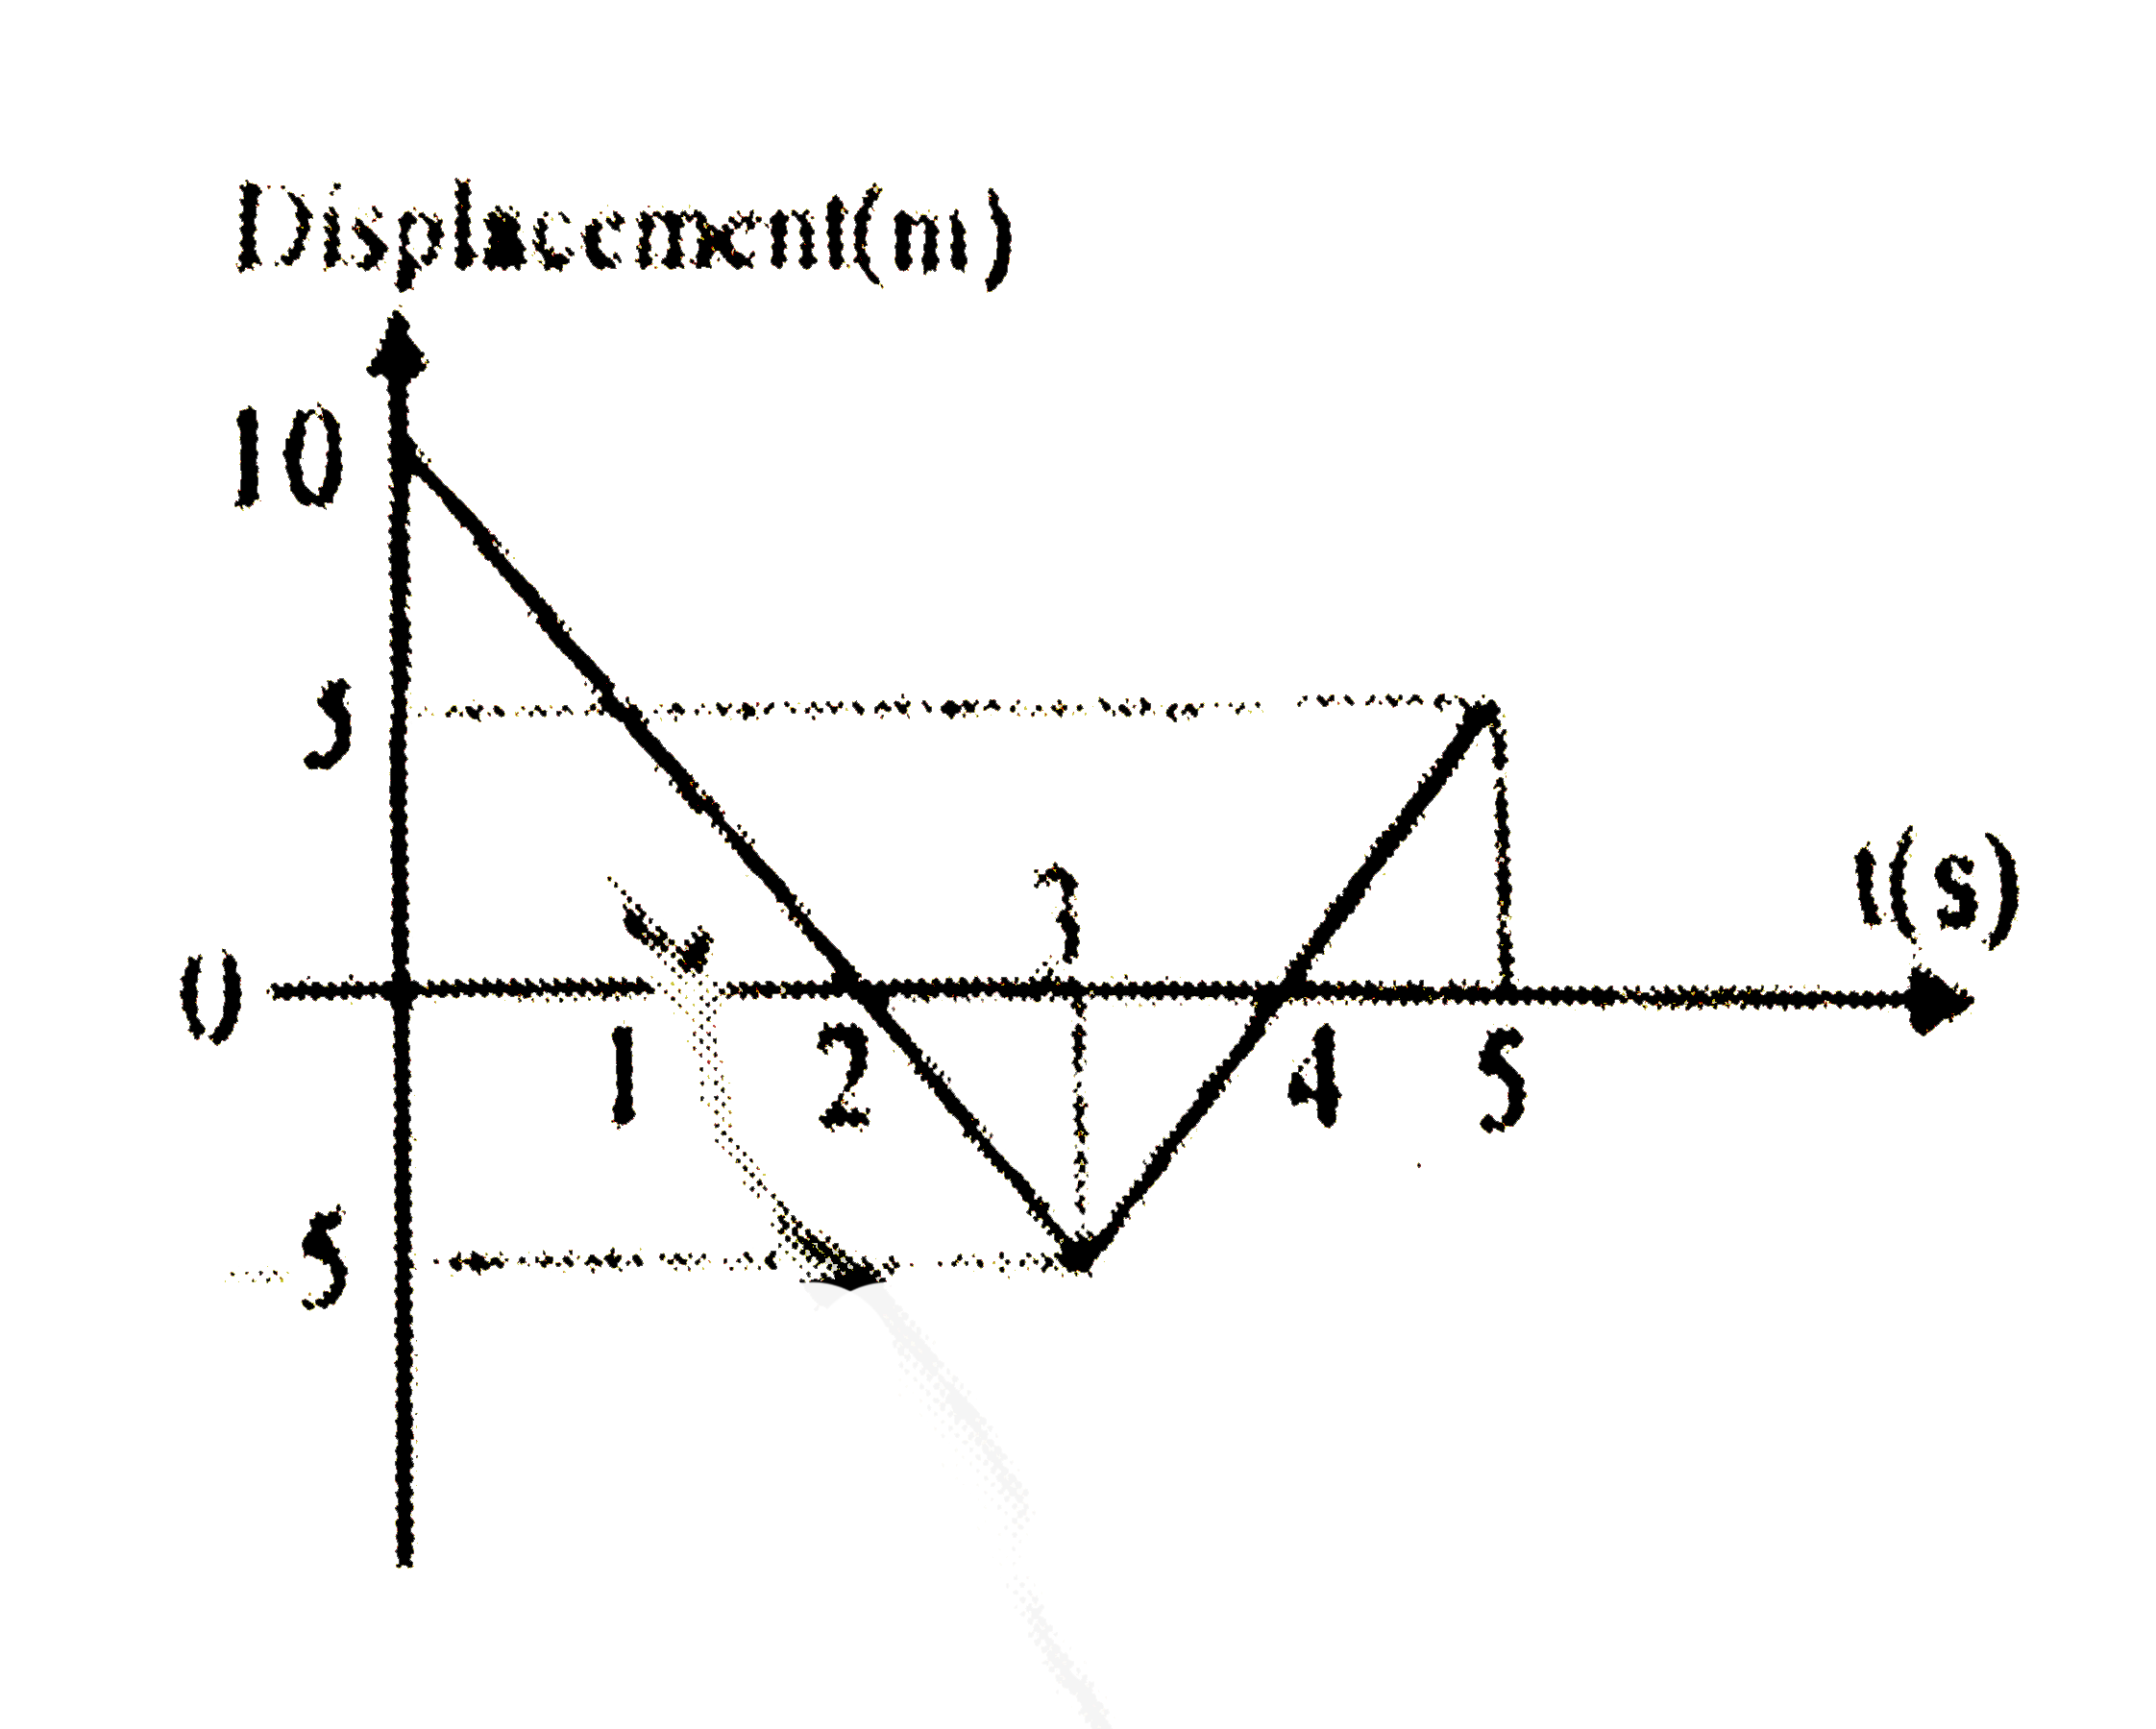
View SolutionThe diagram shows the displacement - time graph for a particle moving in a straight line. The distance (in m) coverted by the particle in the time interval t=0 to t=5s is
View Solution
Knowledge Check
The fig. shows the displacement time graph of a particle moving on a straight line path. What is the magnitude of average velocity of the particle over 10 seconds?
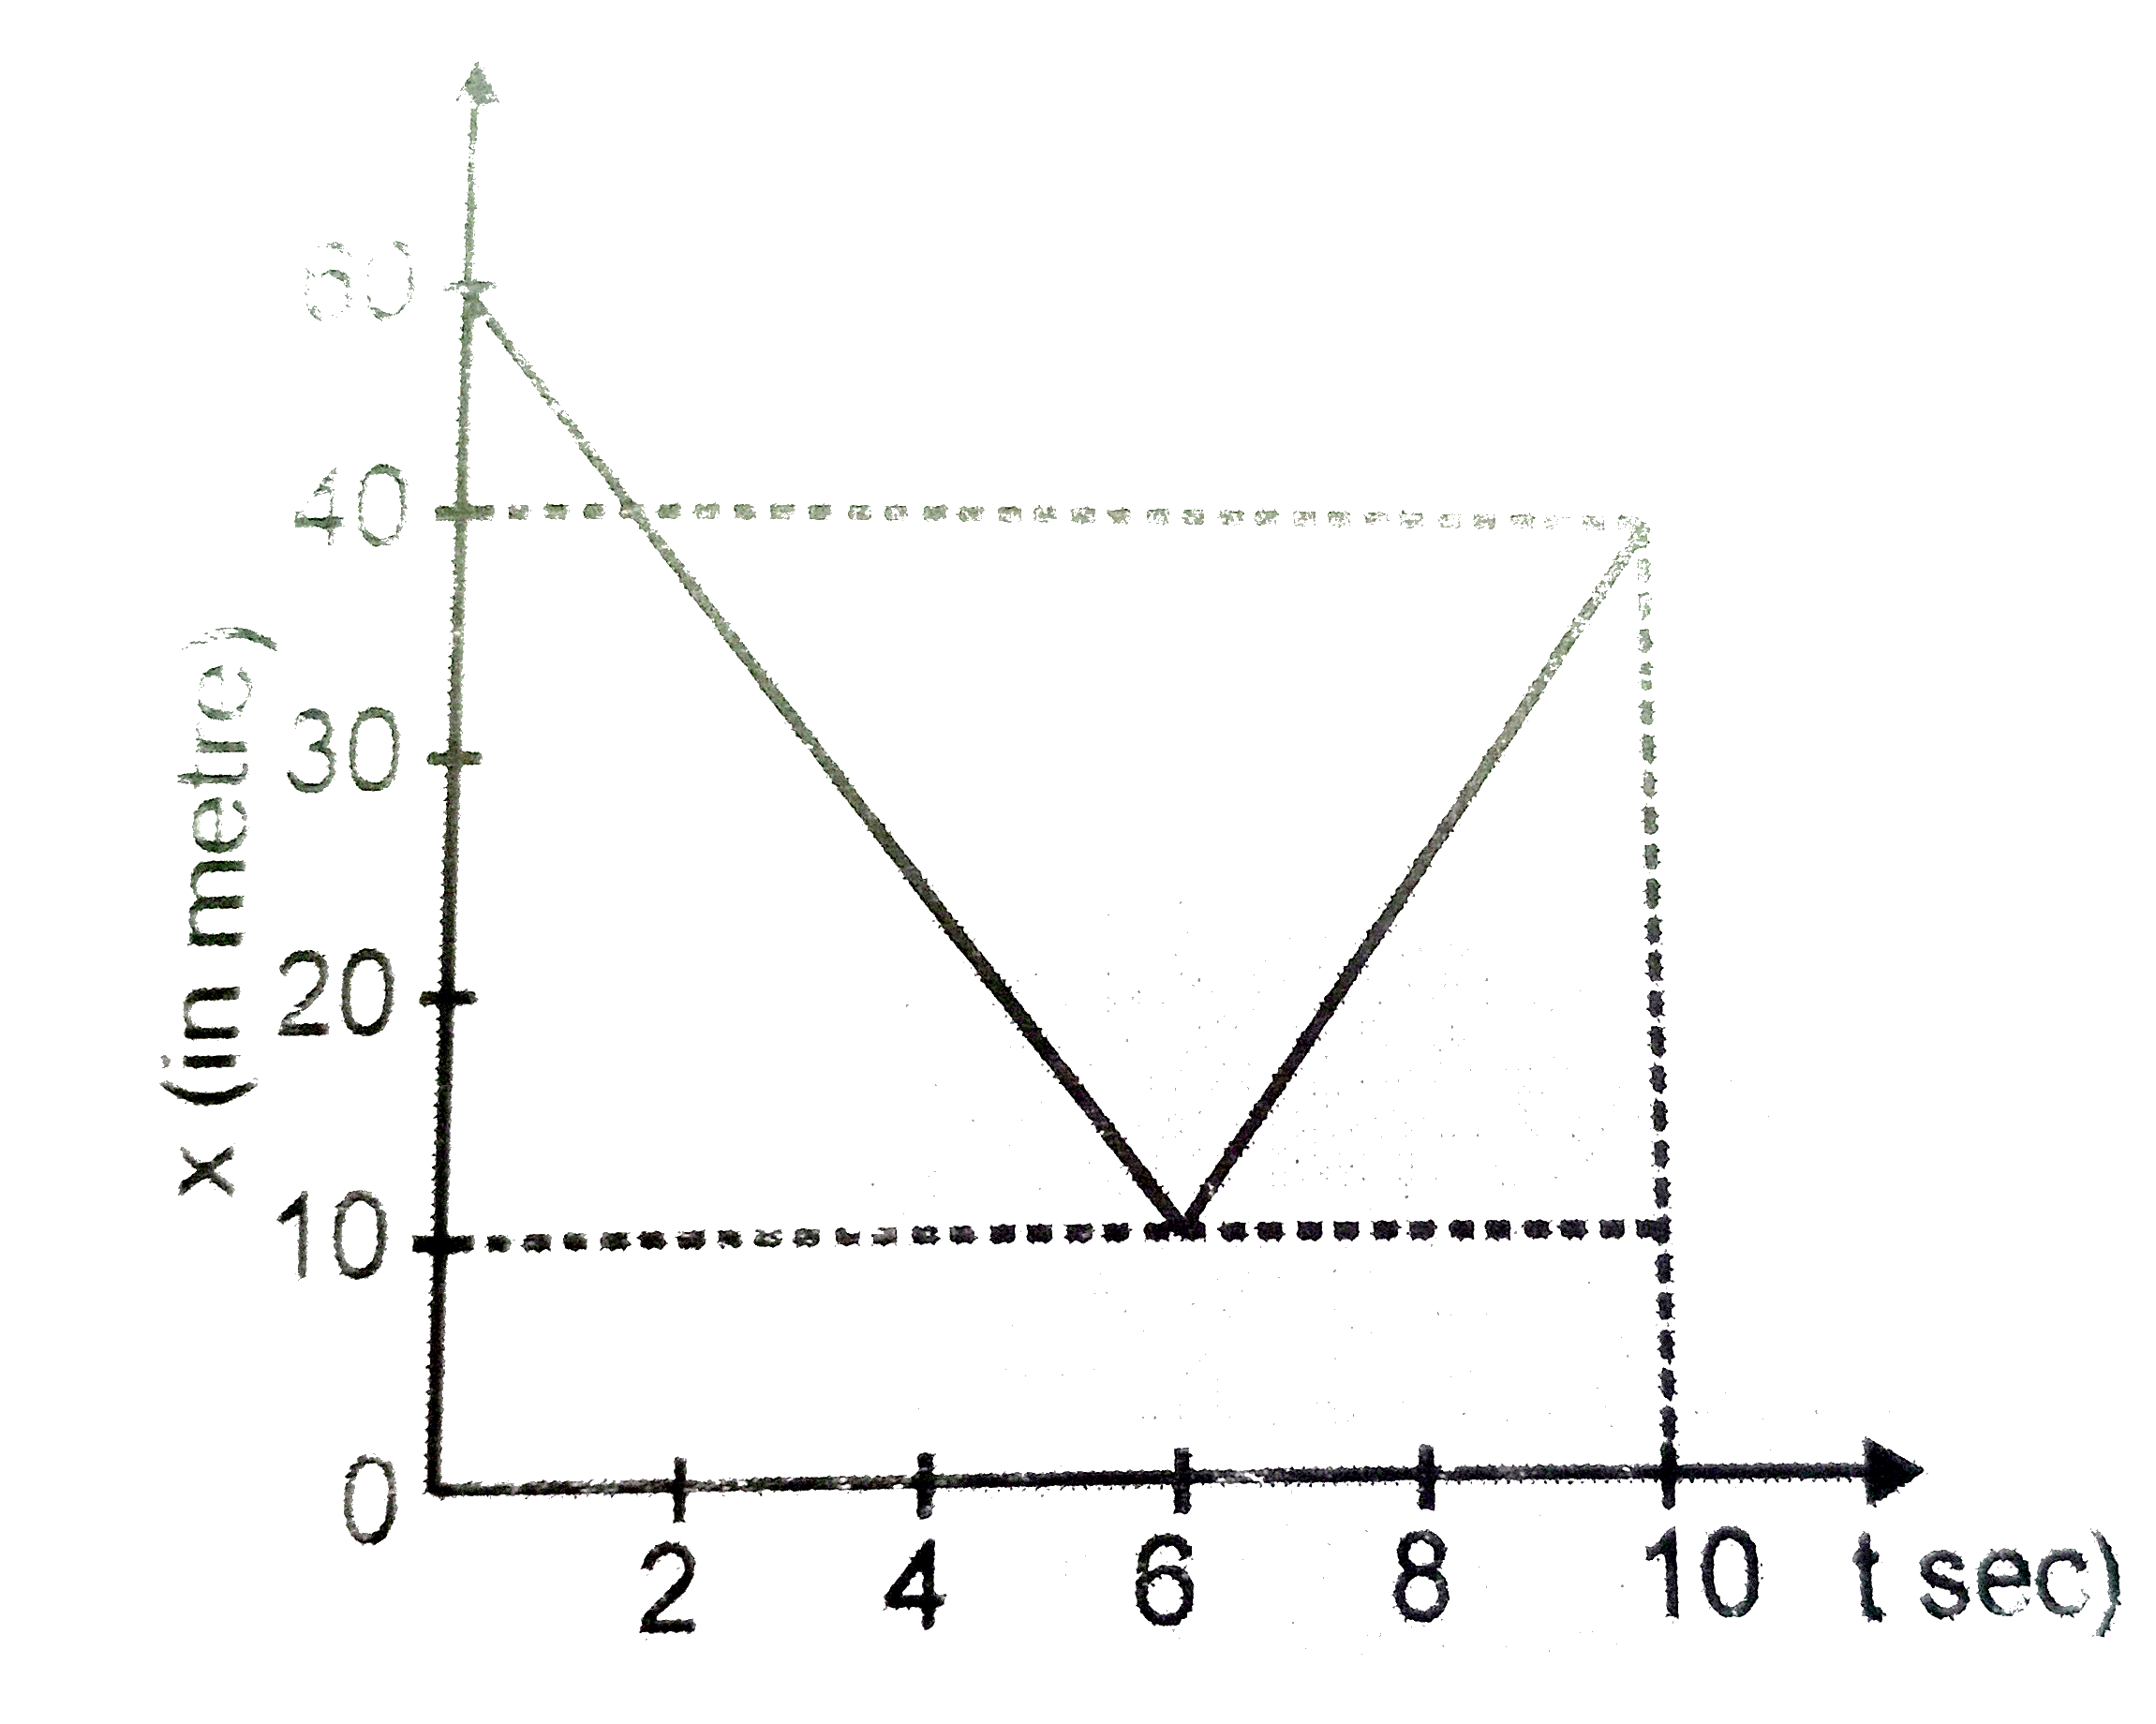 A2ms−1B4ms−1C6ms−1D8ms−1
The diagram shows the velocity-time graph for a particle moving in a straight line. The sum of the two shaded areas represents :
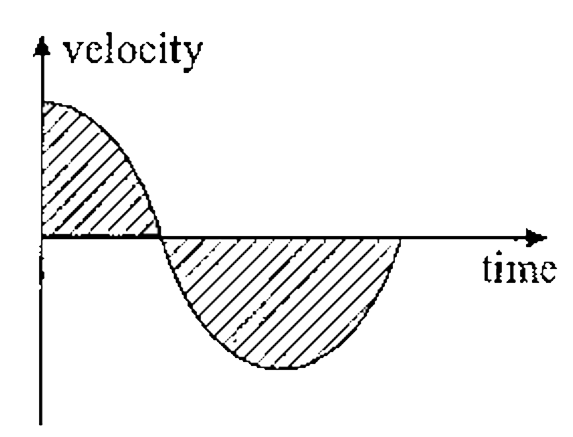 AThe increase in displacement of the particleBThe average velocity of the particleCThe average acceleration ofthe particleDThe distance moved by the particle
Velocity-time graph of a particle moving in a straight line is shown in figure. In the time interval from t = 0 to t = 14 s, find:
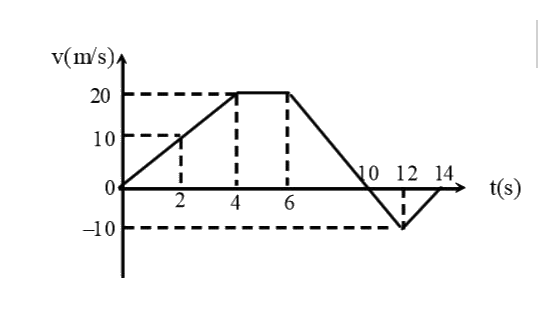
Q. average velocity andA(507)m/sB(257)m/sC(207)m/sD(157)m/s
Figure shows the displacement-time graph of a particle moving in a straight line. Find the signs of velocity and acceleration of particle at time t=t1andt=t2.
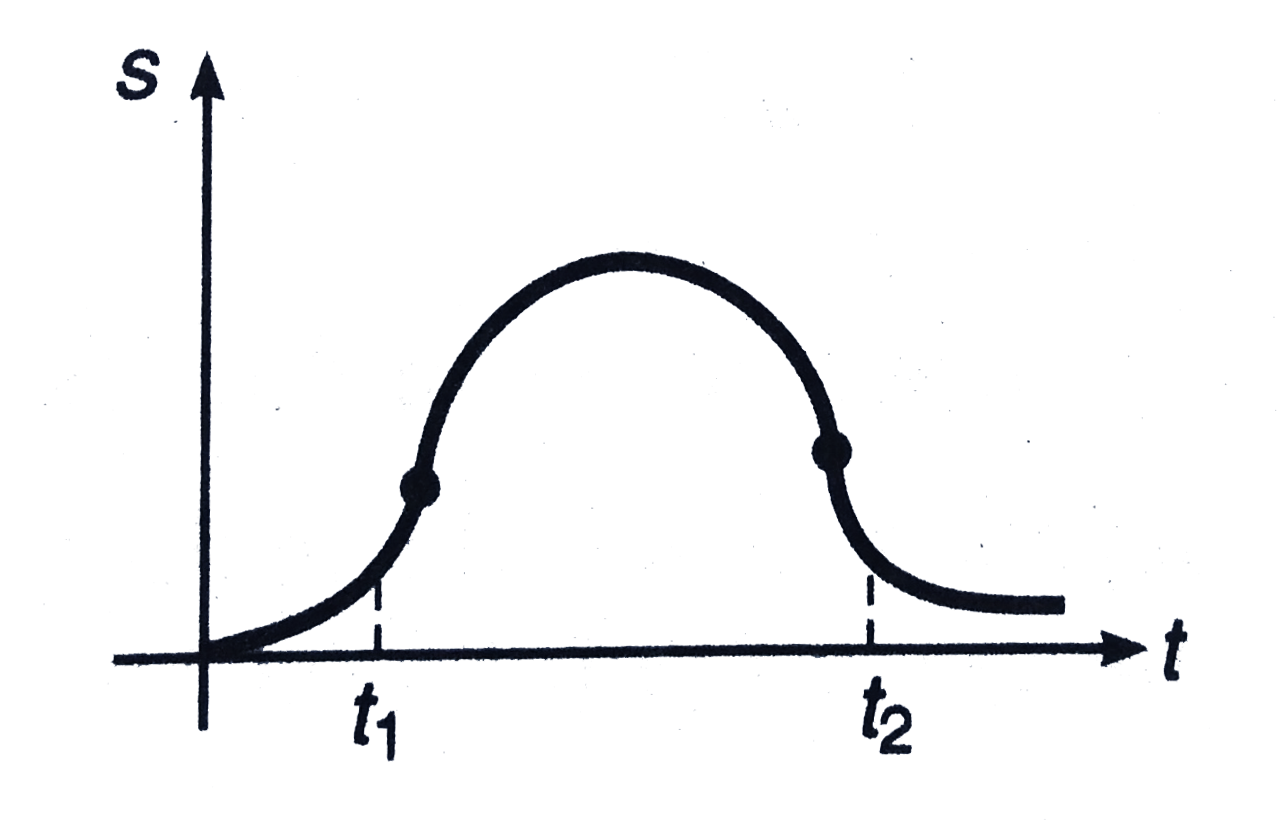
View SolutionThe fig. shows the v−t graph of a particle moving in straight line. Find the time when particle returns to the starting point.
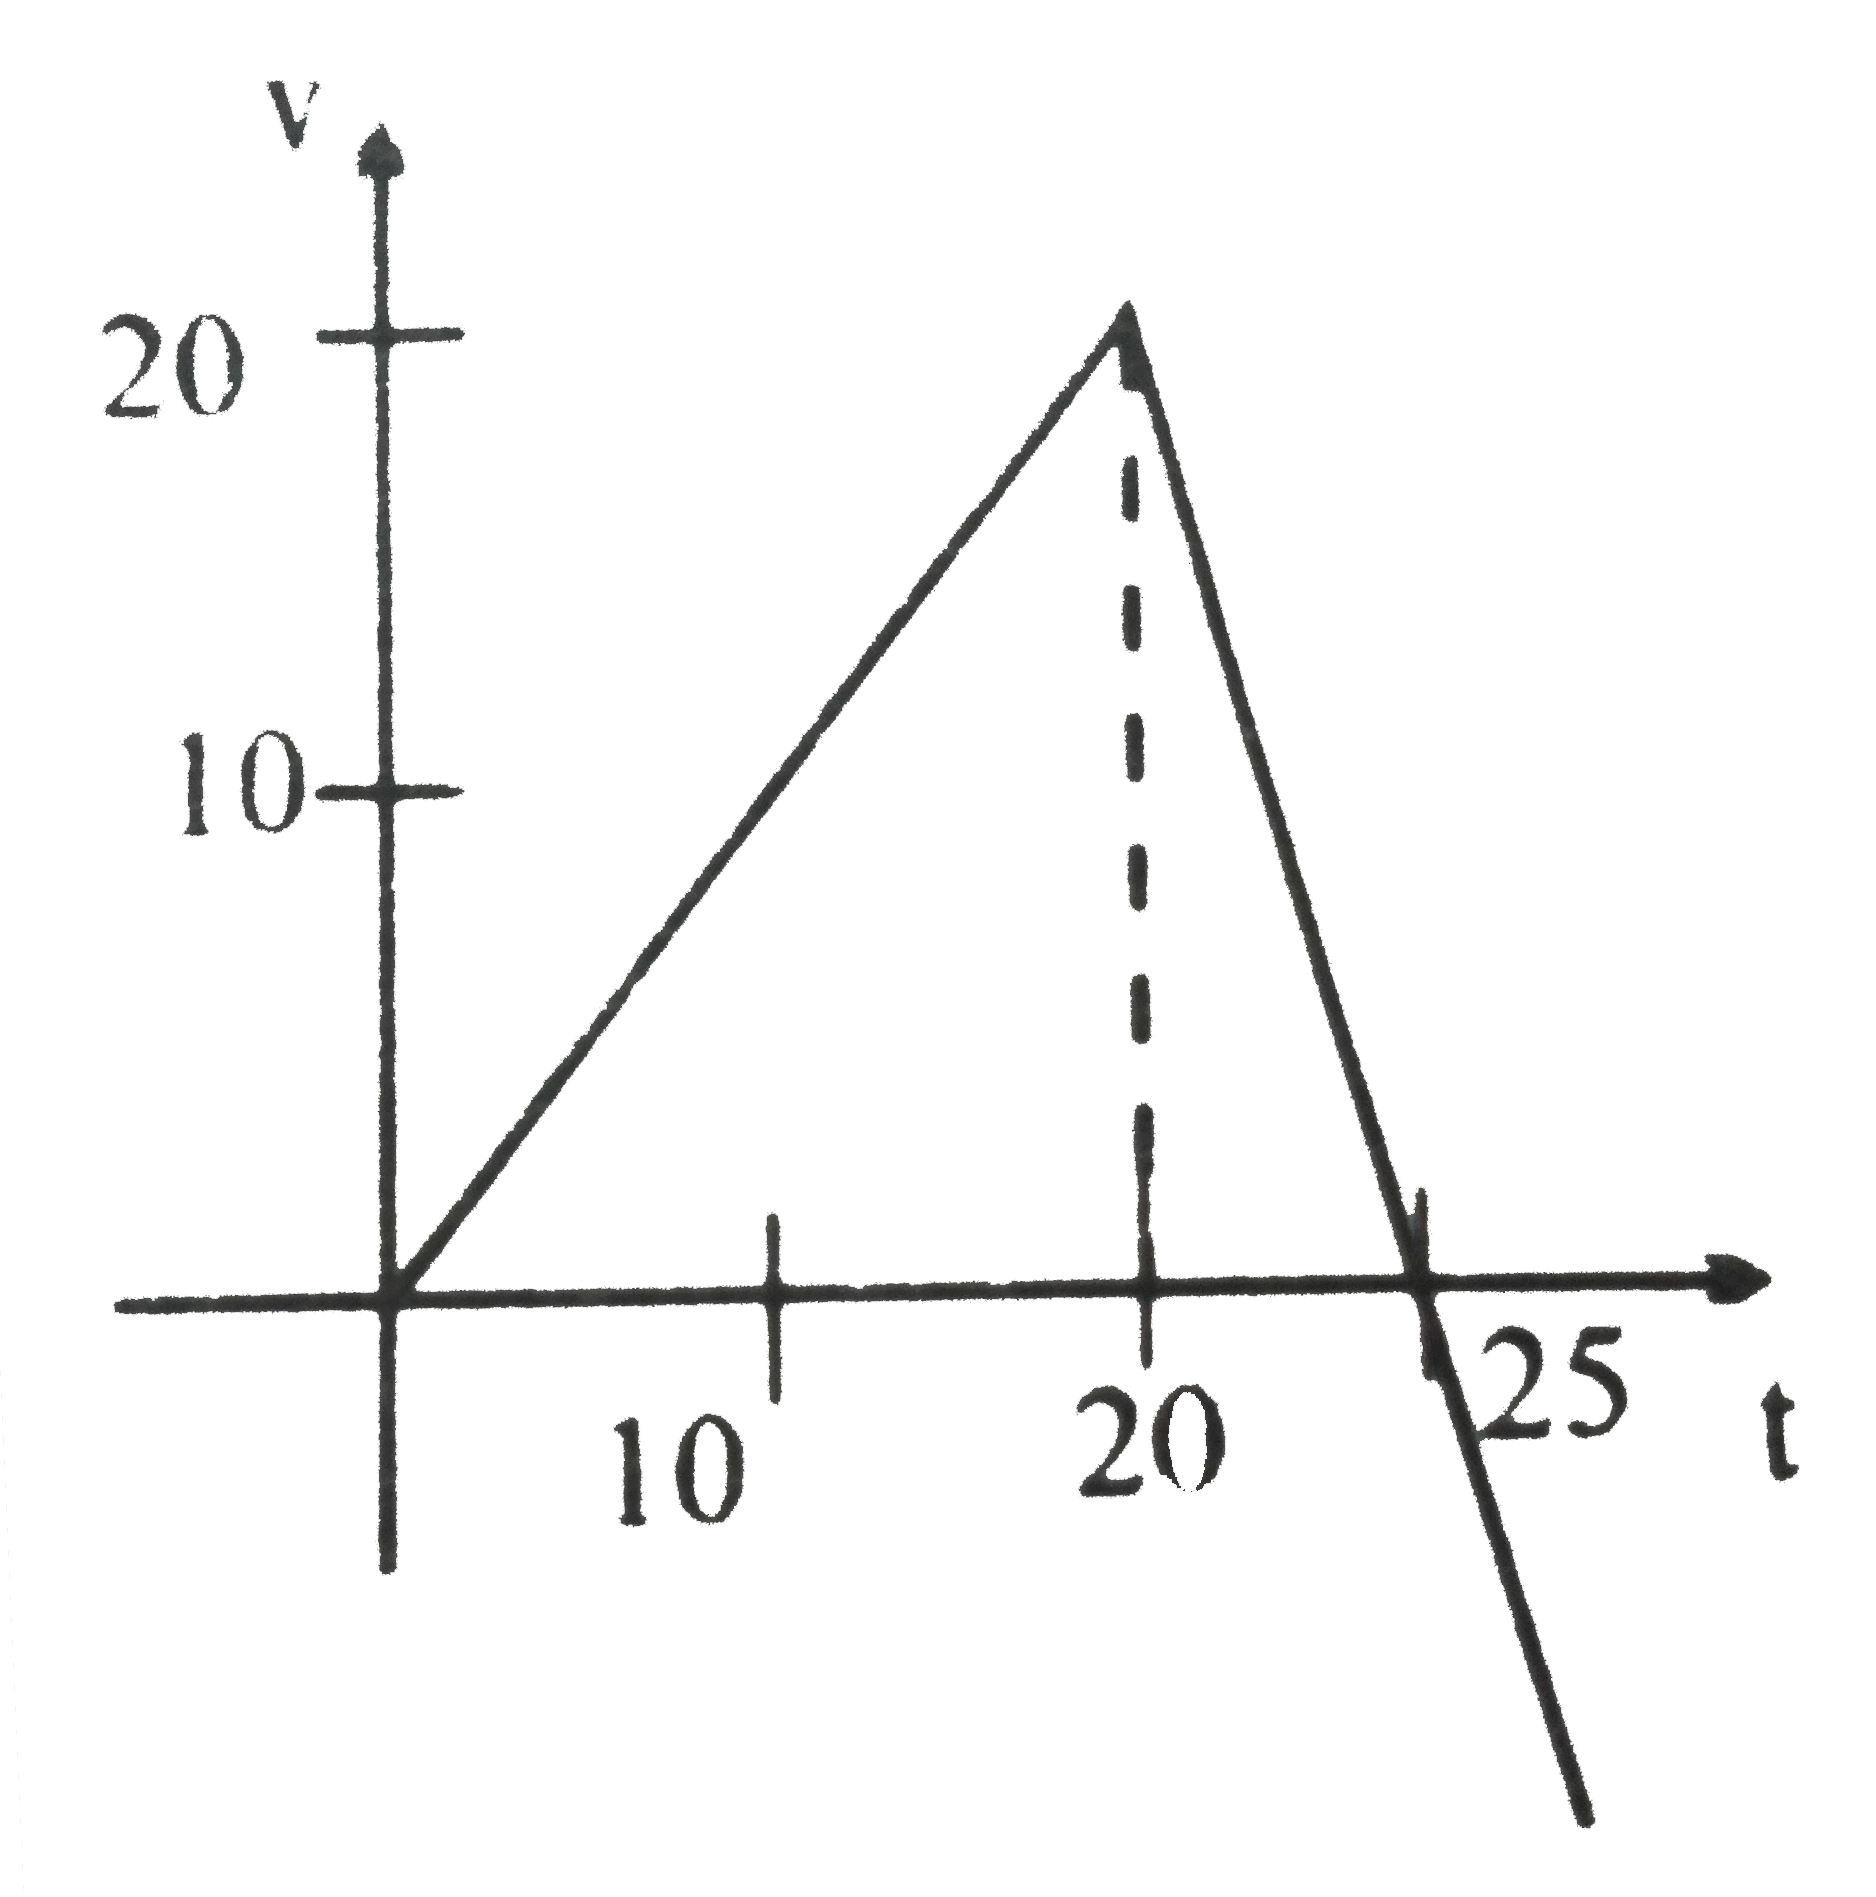
View SolutionThe displacement-time graph for a particle moving in a straight line is as shown in the figure. Determine the velocity of the particle at t=1s,3s and 6s. Sketch the velocity-time graph.
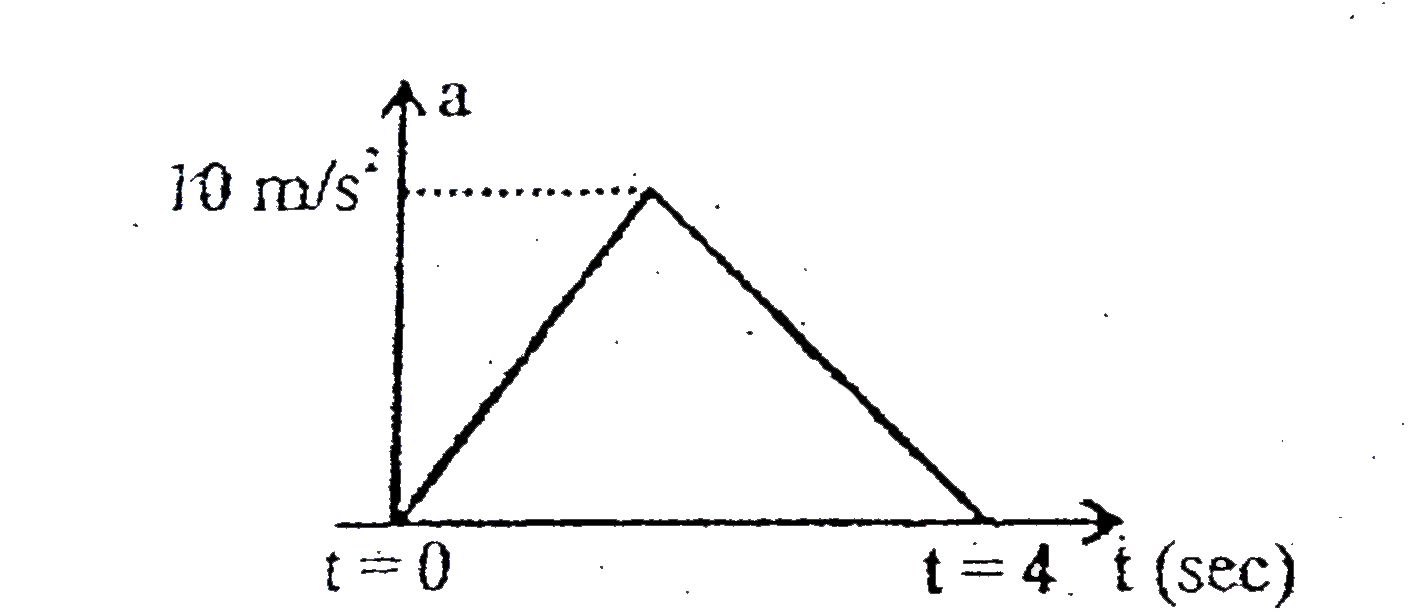
View SolutionAcceleration time graph of a particle moving along a straight line is given. Then average acceleration between t=0 & t=4 is :−
View SolutionThe figure shows a velocity-time graph of a particle moving along a straight line
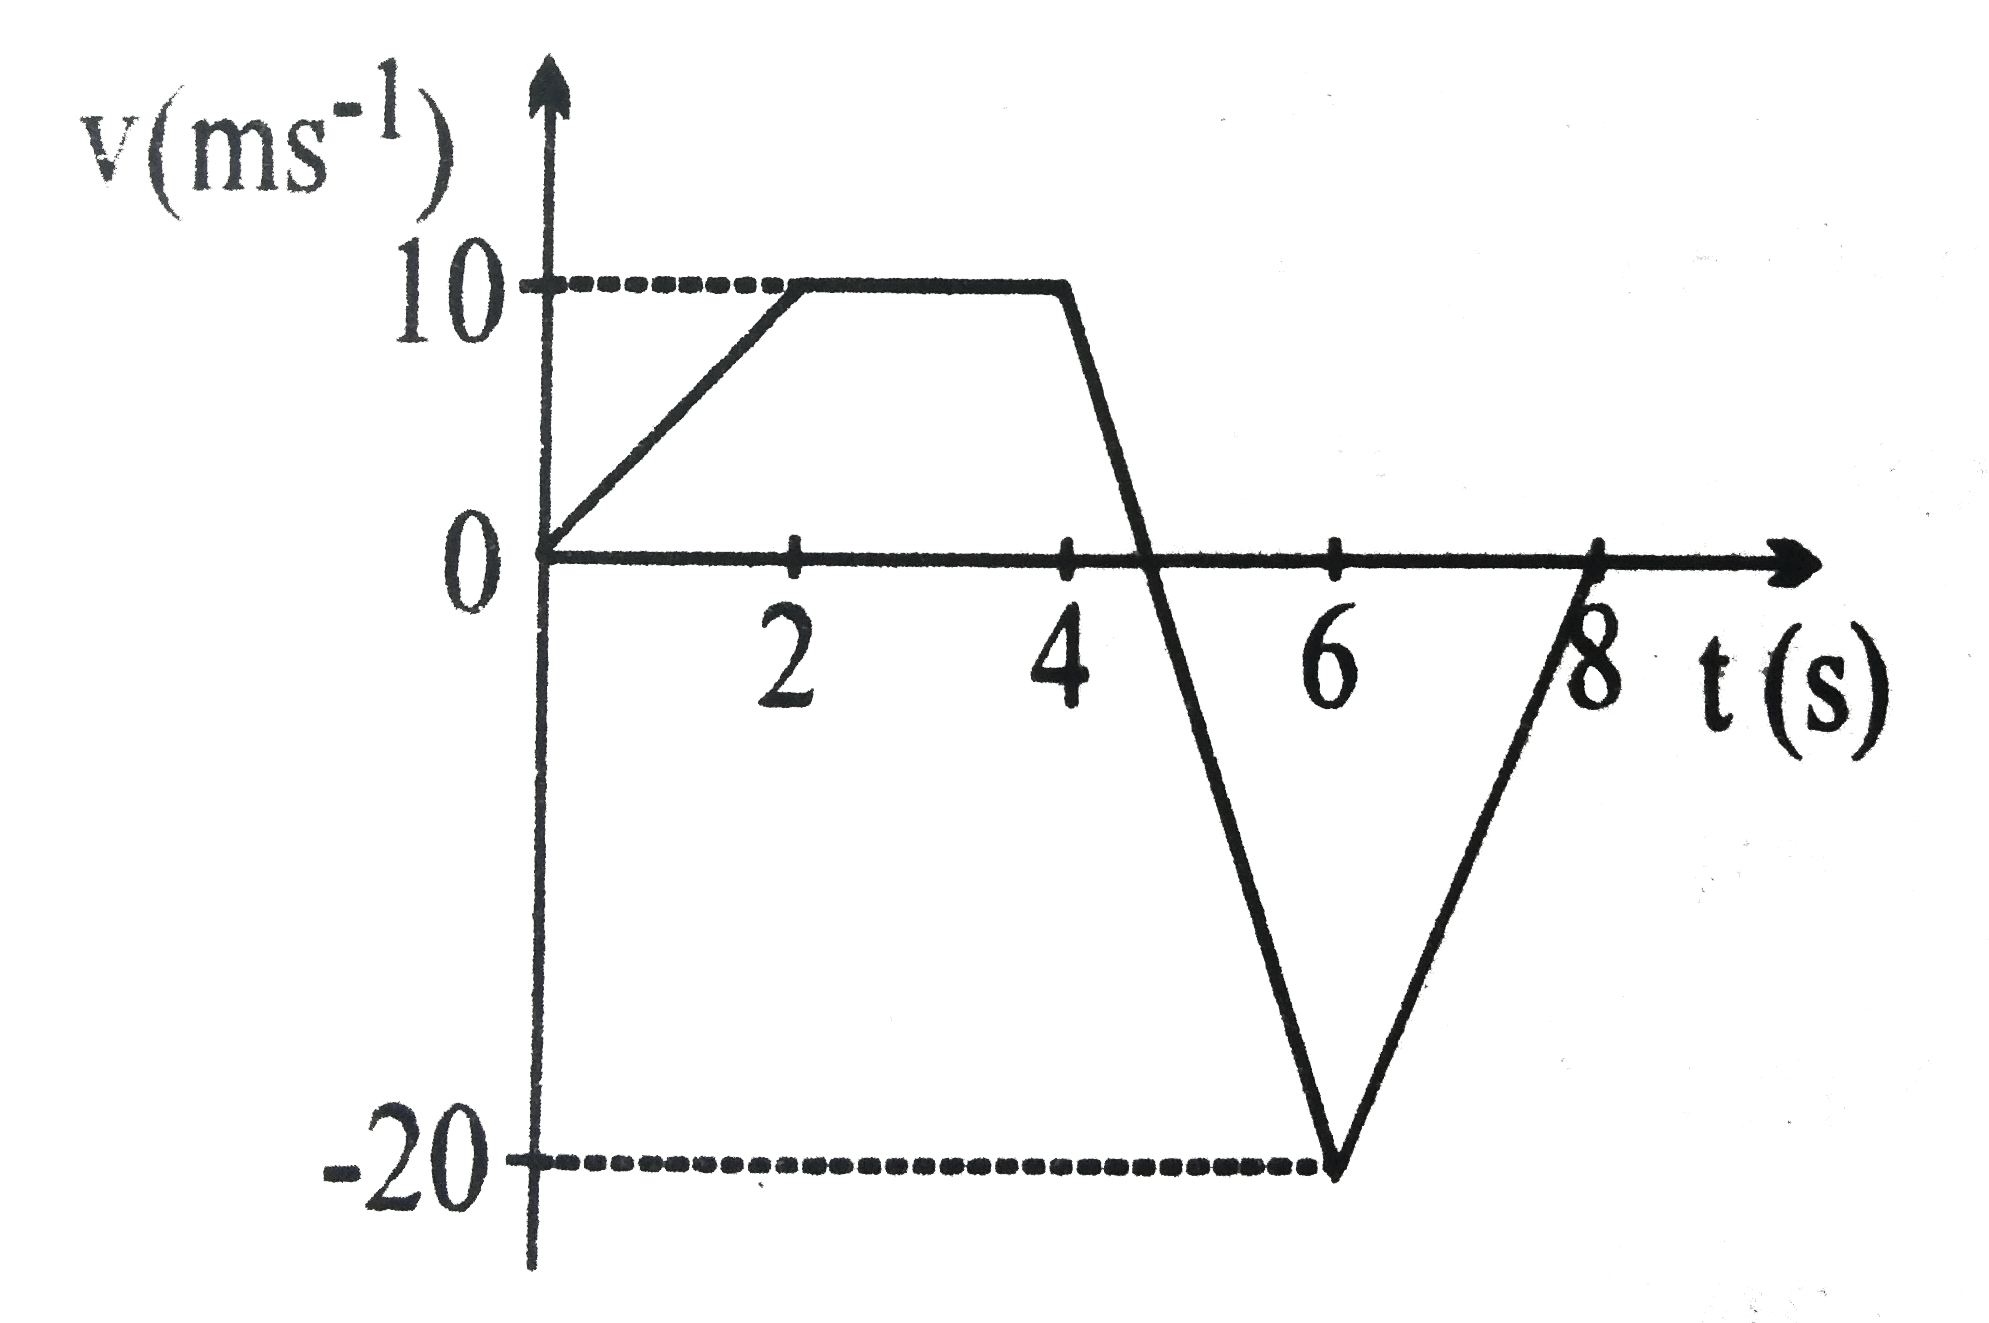
The maximum displacement of the particle is
View Solution

