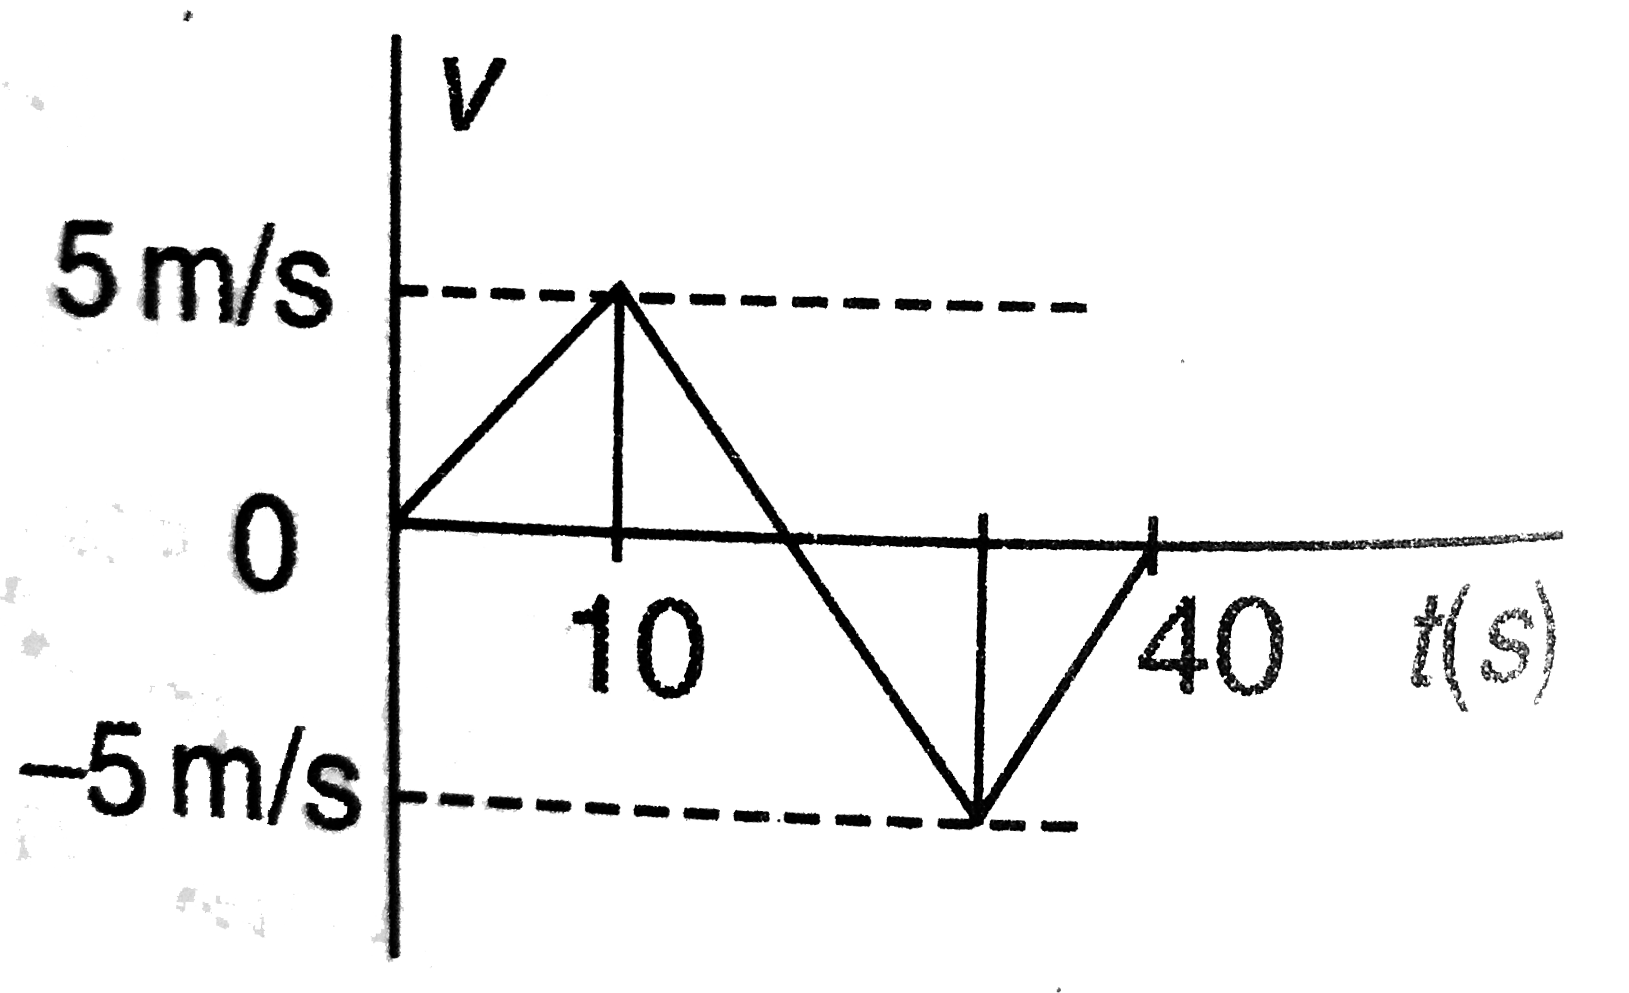
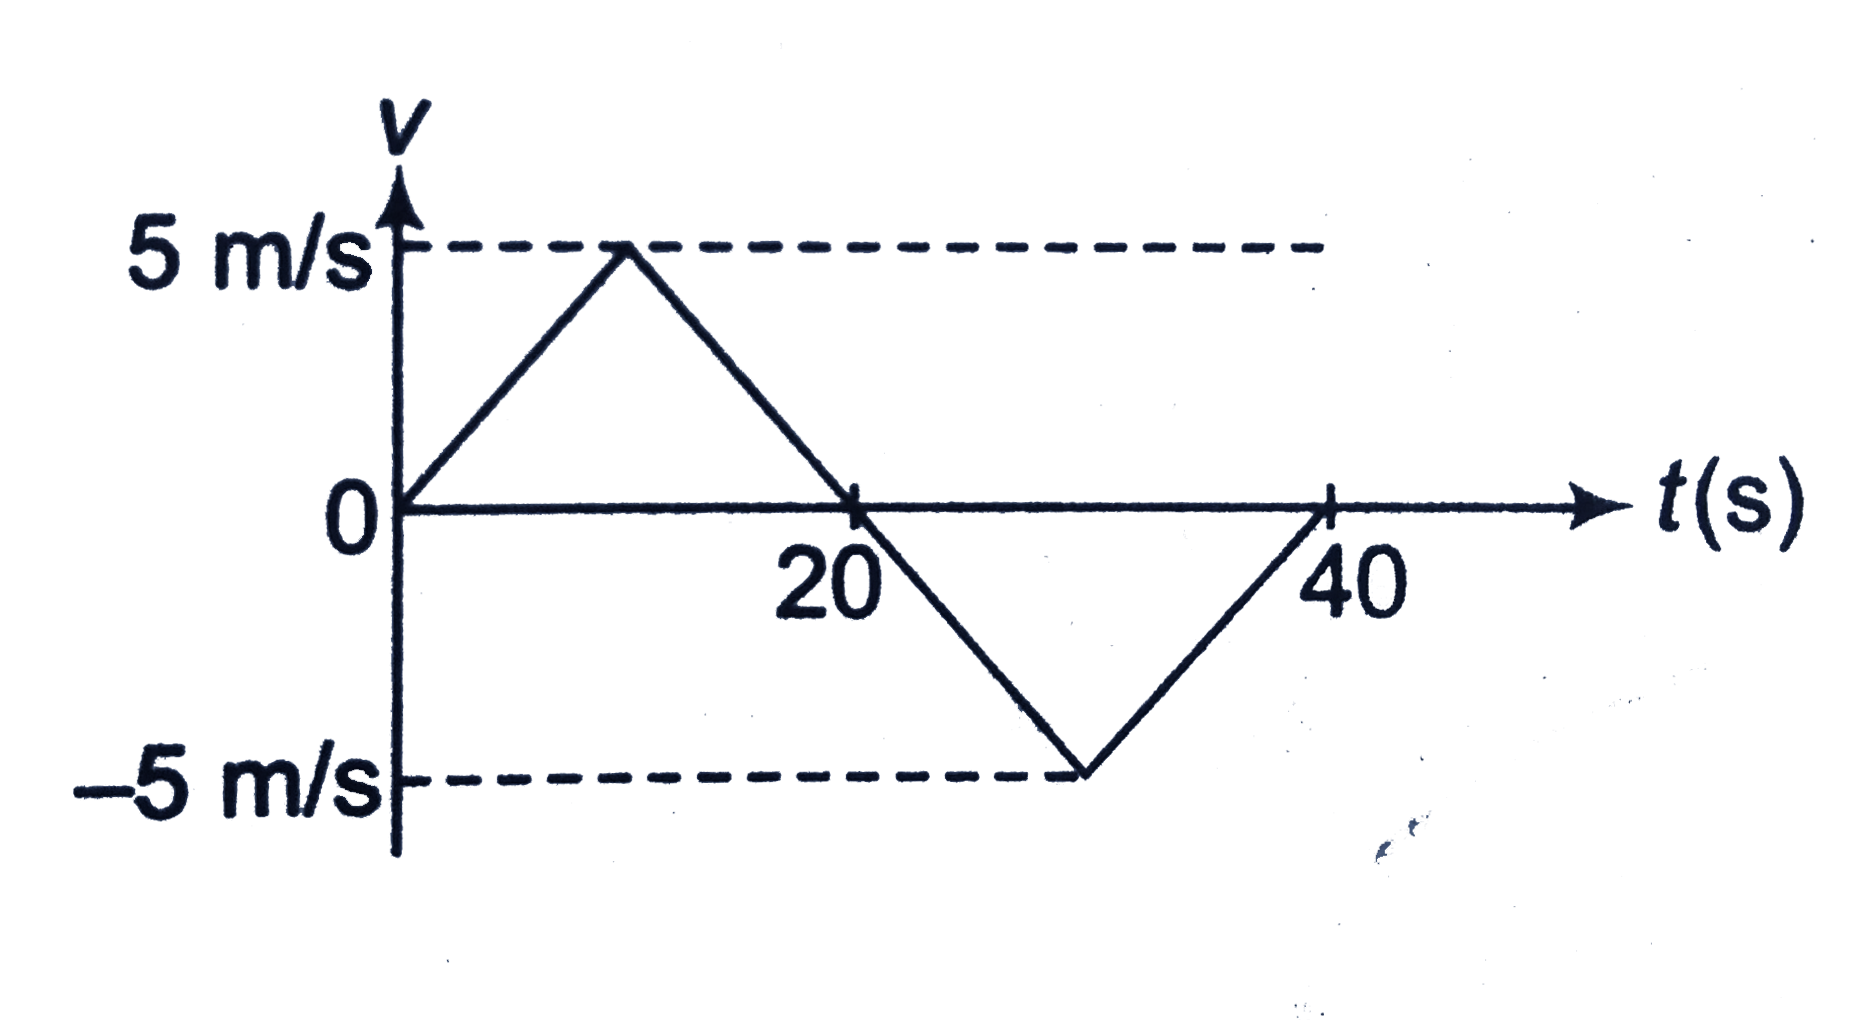
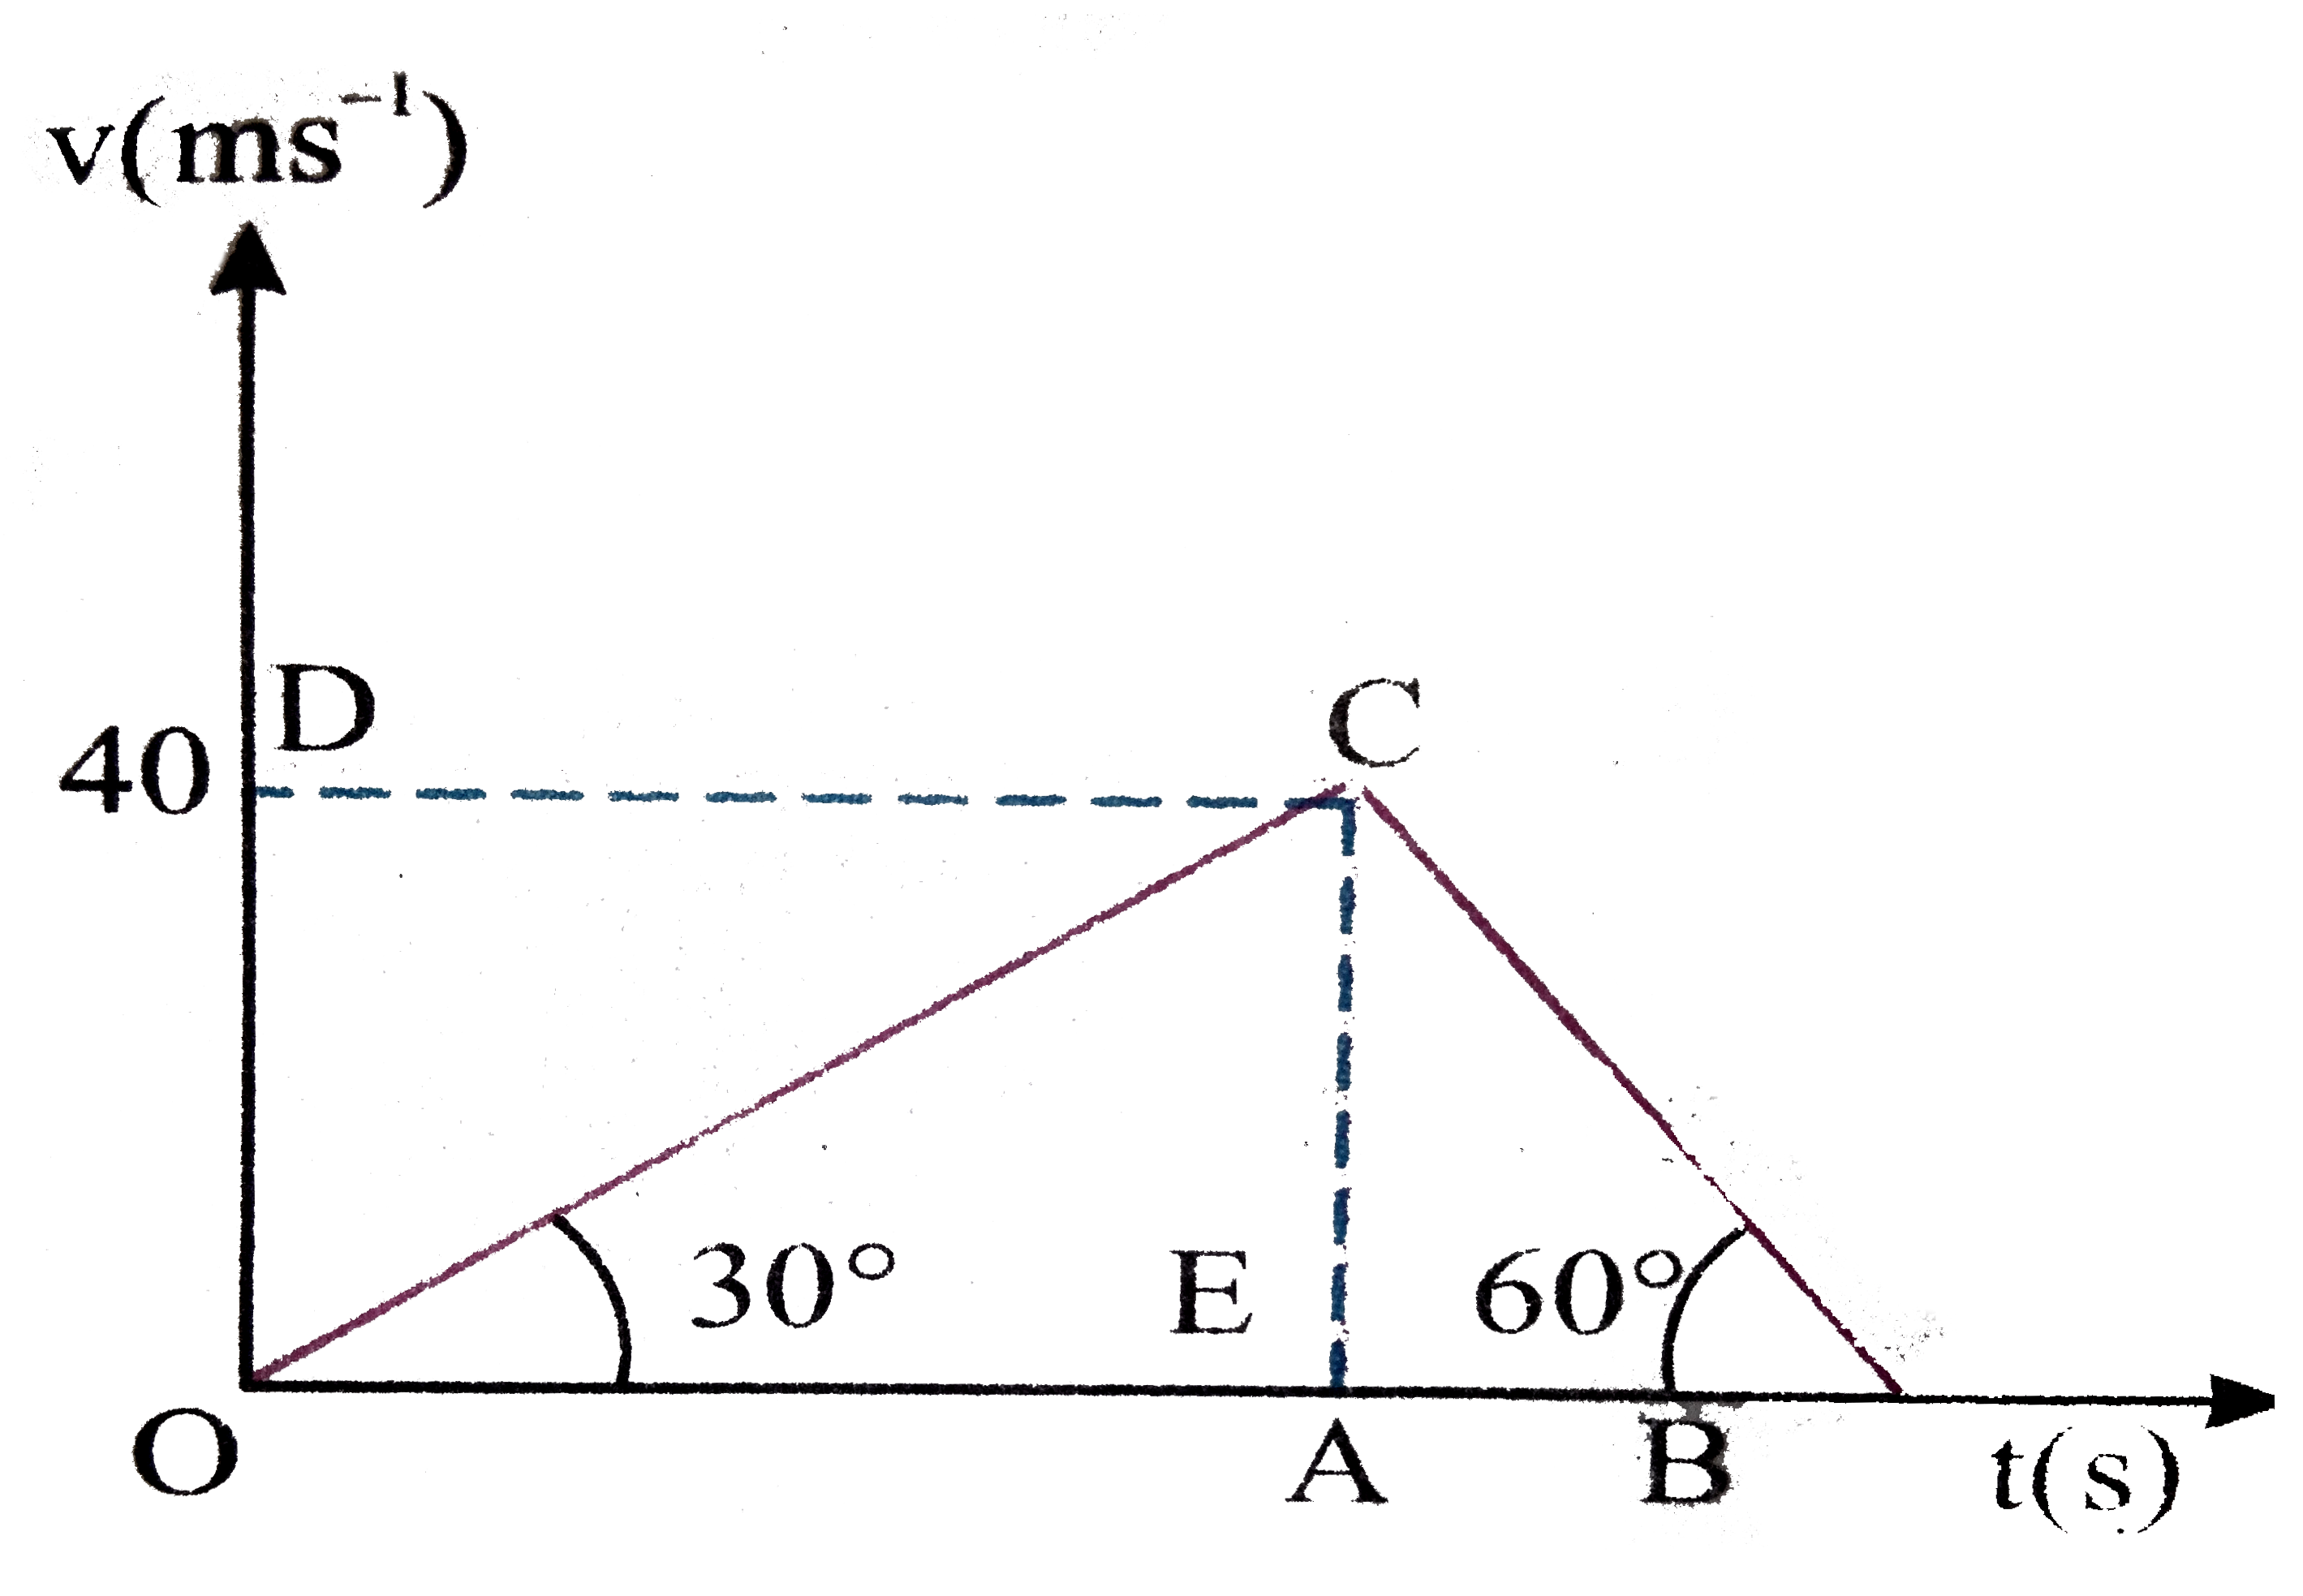
The velocity-time plot is shown in figure. Find the average speed in time interval t=0 to t=40s during the period.
zero
2.5m/s
5m/s
none
The correct Answer is:B
Distance covered D=2[12×20×5]=100m
Average speed =D40=10040=2.5m/s.
Topper's Solved these Questions
- GENERAL KINEMATICS AND MOTION IN ONE DIMENSIONBook:A2ZChapter:GENERAL KINEMATICS AND MOTION IN ONE DIMENSIONExercise:Problem Based On Mixed Concepts
Explore 30 Videos
- GENERAL KINEMATICS AND MOTION IN ONE DIMENSIONBook:A2ZChapter:GENERAL KINEMATICS AND MOTION IN ONE DIMENSIONExercise:Assertion Reasoning
Explore 20 Videos
- GENERAL KINEMATICS AND MOTION IN ONE DIMENSIONBook:A2ZChapter:GENERAL KINEMATICS AND MOTION IN ONE DIMENSIONExercise:Relative Motion In One Dimension
Explore 20 Videos
- FLUID MECHANICSBook:A2ZChapter:FLUID MECHANICSExercise:Chapter Test
Explore 29 Videos
- GRAVITATIONBook:A2ZChapter:GRAVITATIONExercise:Chapter Test
Explore 29 Videos
Similar Questions
Knowledge Check
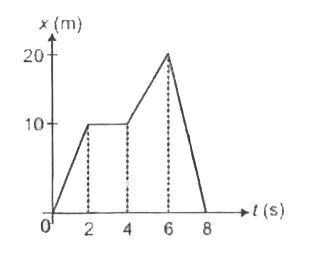
The position (x) - time (t) graph for a particle moving along a straight line is shown in figure. The average speed of particle in time interval t = 0 to t = 8 s is
 AZeroB5 m/sC7.5 m/sD9.7 m/s
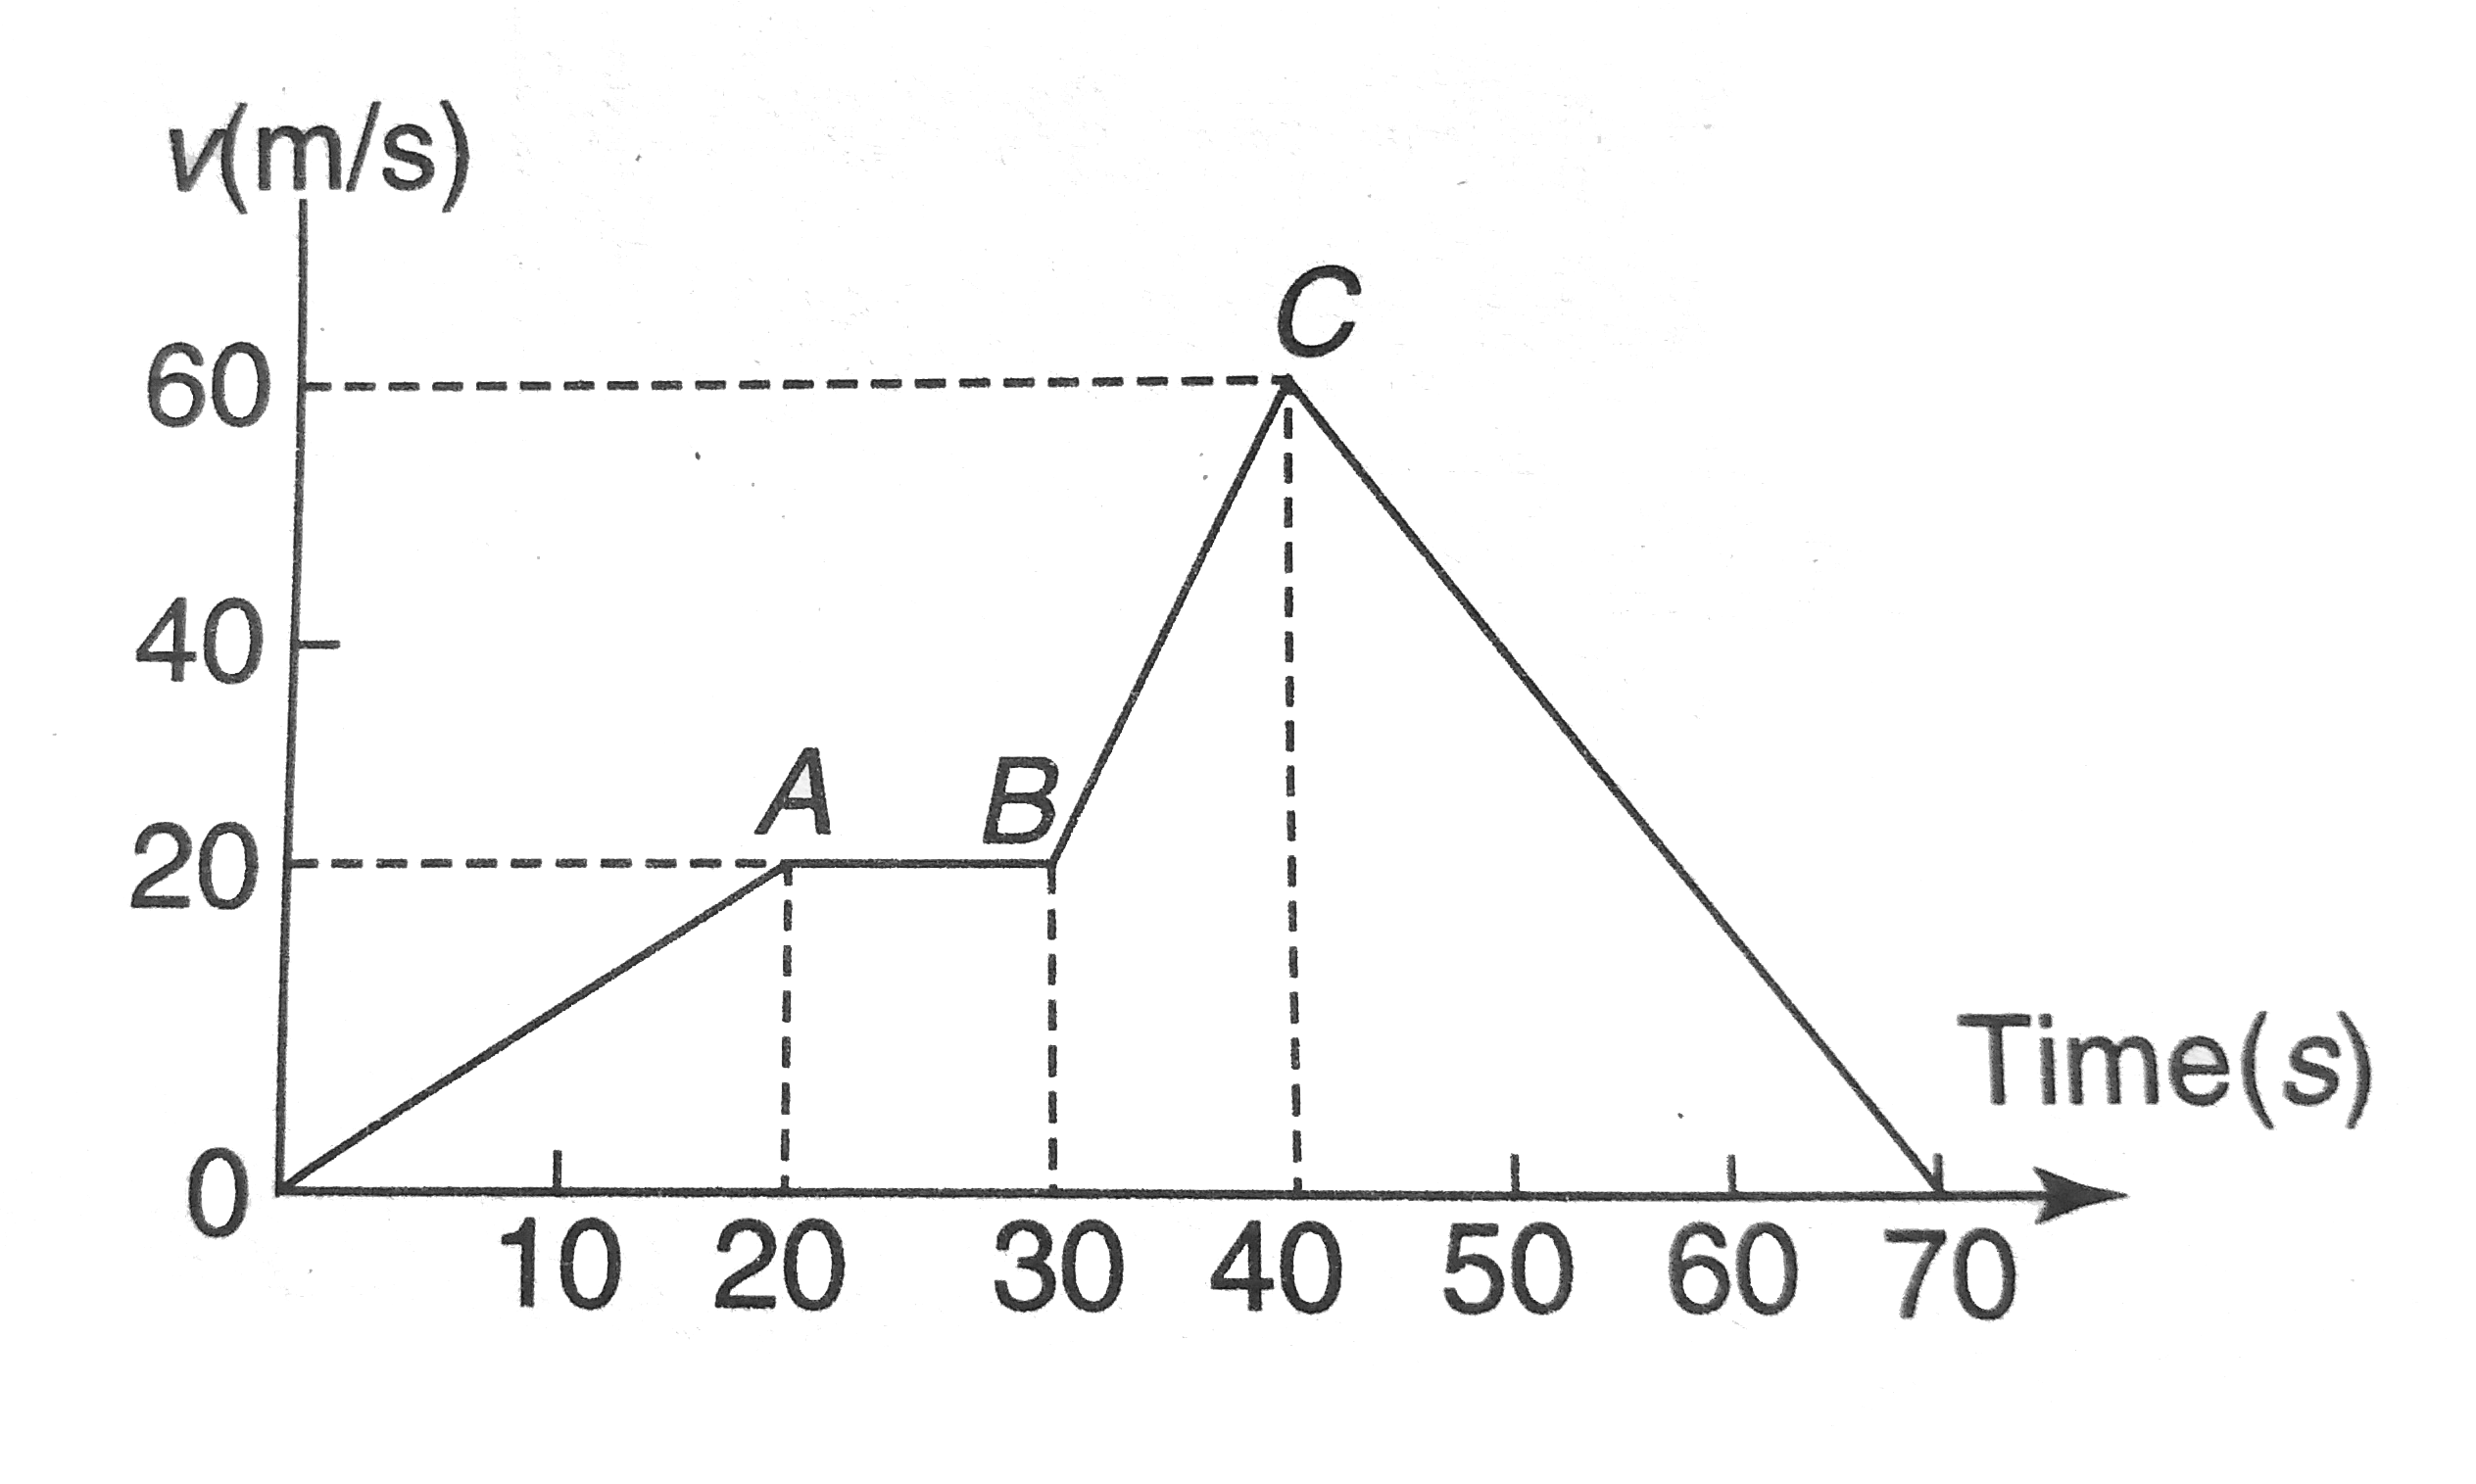
The velocity-time graph of a body is given below. Find the average velocity from t=0 to t=40s.
 A20m/sB40m/sC50m/sD60m/s
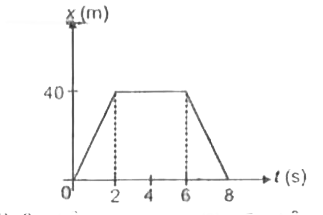
The position (x) of a particle moving along x - axis veries with time (t) as shown in figure. The average acceleration of particle in time interval t = 0 to t = 8 s is
 A3m/s2B−5m/s2C−4m/s2D2.5m/s2
From the velocity-time plot shown in Fig. find the distance travelled by the particle during the first 40s. Also find the average velocity during this period.
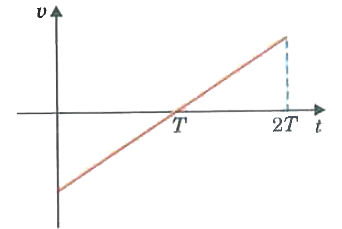
View SolutionVelocity-time graph for a particle is shown in following figure for time interval 0 to 2T.
View SolutionVelocity-time graph of a particle moving in a straight line is shown in figure. In the time interval from t = 0 to t = 14 s, find:
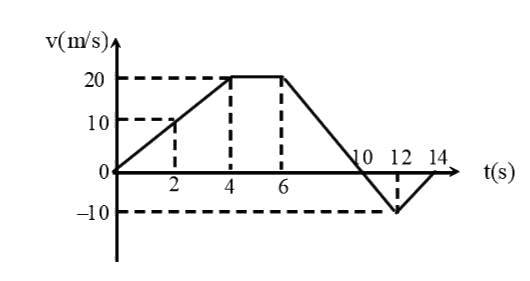
Q. average speed of the particle
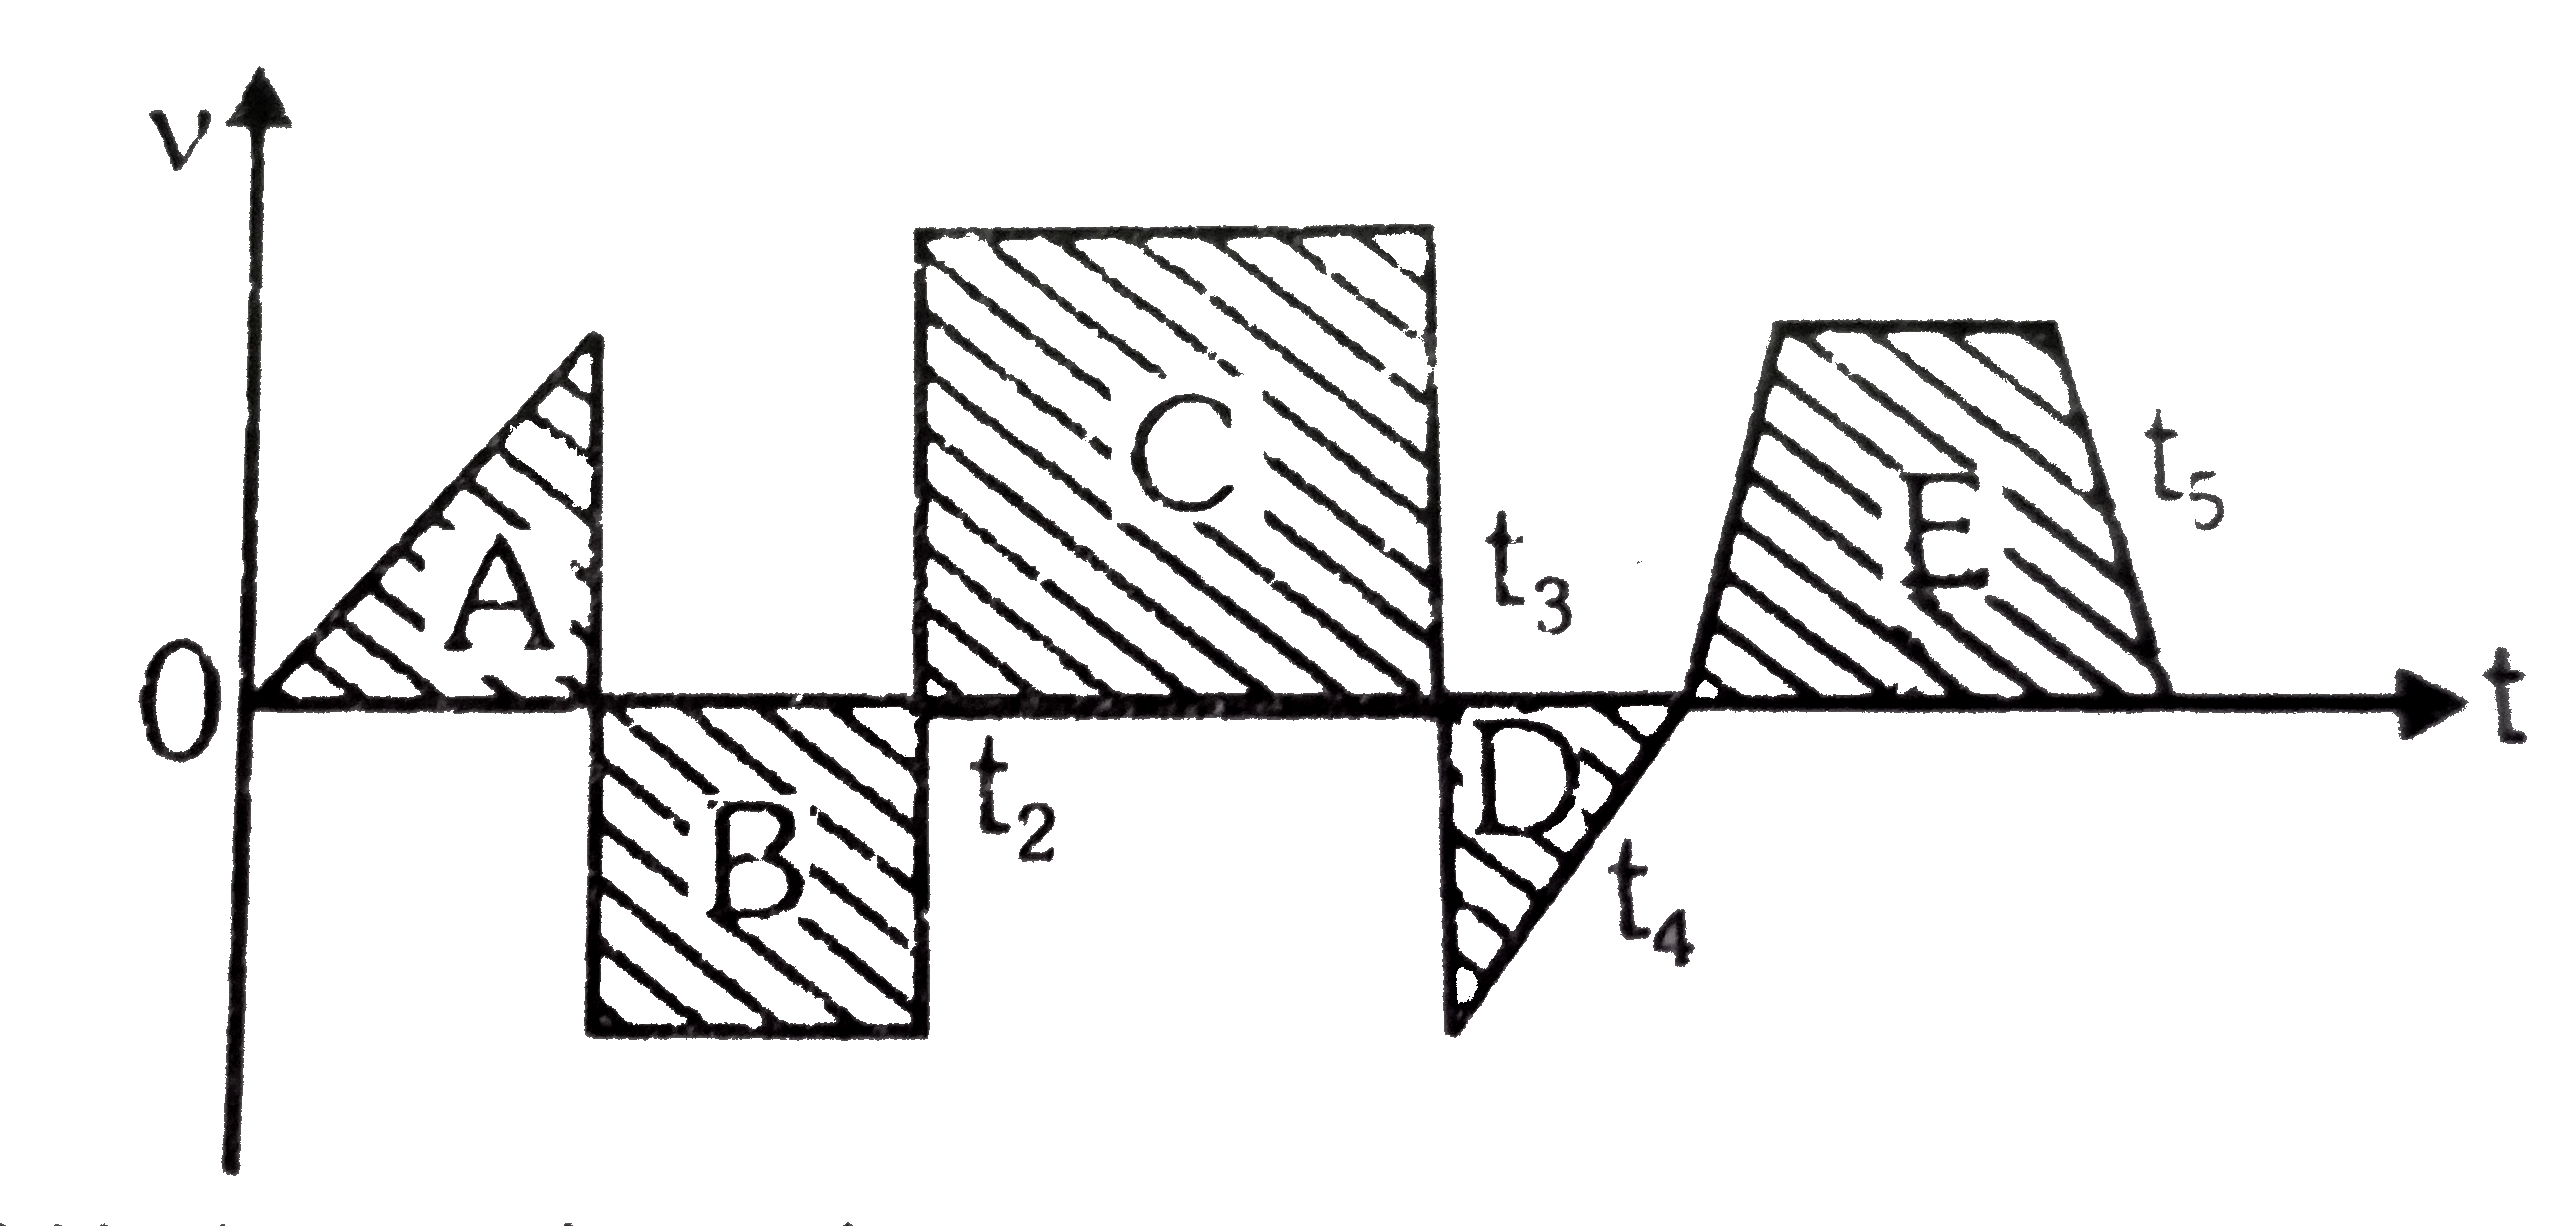
View SolutionThe velocity-time graph of an objects is as shown. The displacement during the interval 0 to t4 is
View SolutionThe velocity-time graph of a body is shown in figure. The ratio of magnitude of average acceleration during the intervals OA and AB is
View Solution


