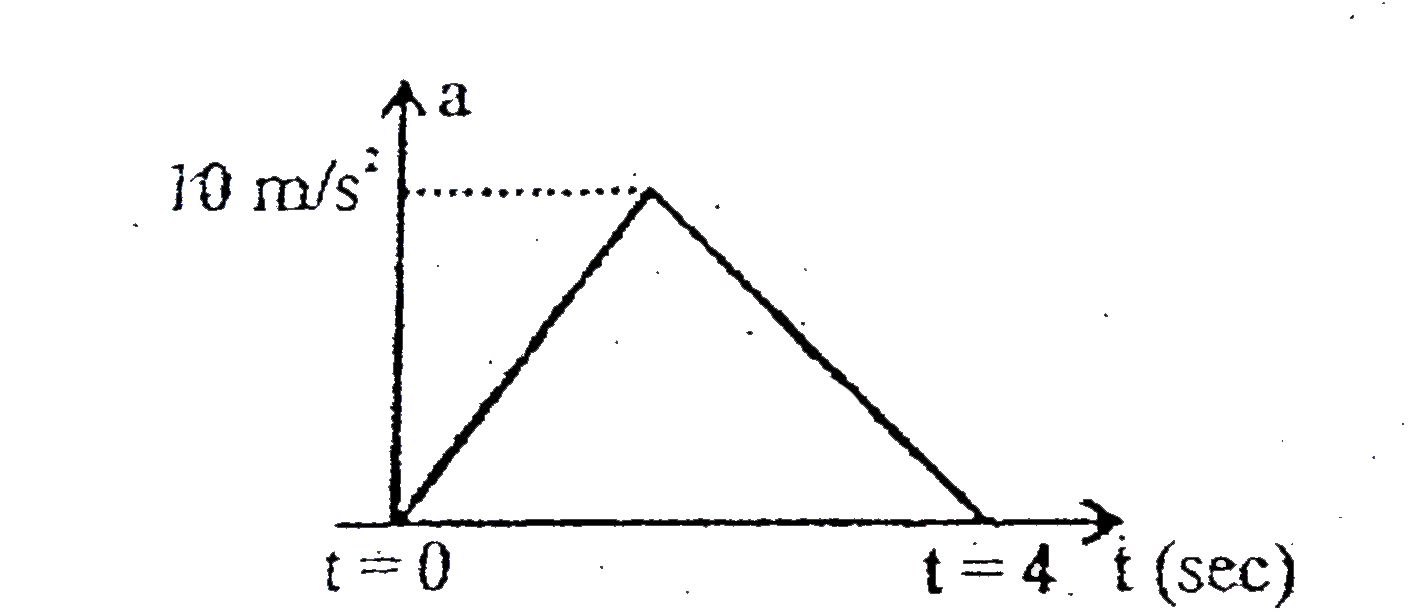
Acceleration time graph of a particle moving along a straight line is given. Then average acceleration between t=0 & t=4 is :−
0m/s2
5m/s2
10m/s2
7.5m/s2
The correct Answer is:B
Average acceleration =ΔvΔt
Δv=area=12×4×10=20
Average acceleration=204=5m/s2
Topper's Solved these Questions
- TEST PAPERBook:ALLENChapter:TEST PAPERExercise:PHYSICS
Explore 4 Videos
- TEST PAPERBook:ALLENChapter:TEST PAPERExercise:PHYSICS
Explore 4 Videos
- SIMPLE HARMONIC MOTIONBook:ALLENChapter:SIMPLE HARMONIC MOTIONExercise:Example
Explore 1 Video
- TEST PAPER 1Book:ALLENChapter:TEST PAPER 1Exercise:PHYSICS
Explore 11 Videos
Similar Questions
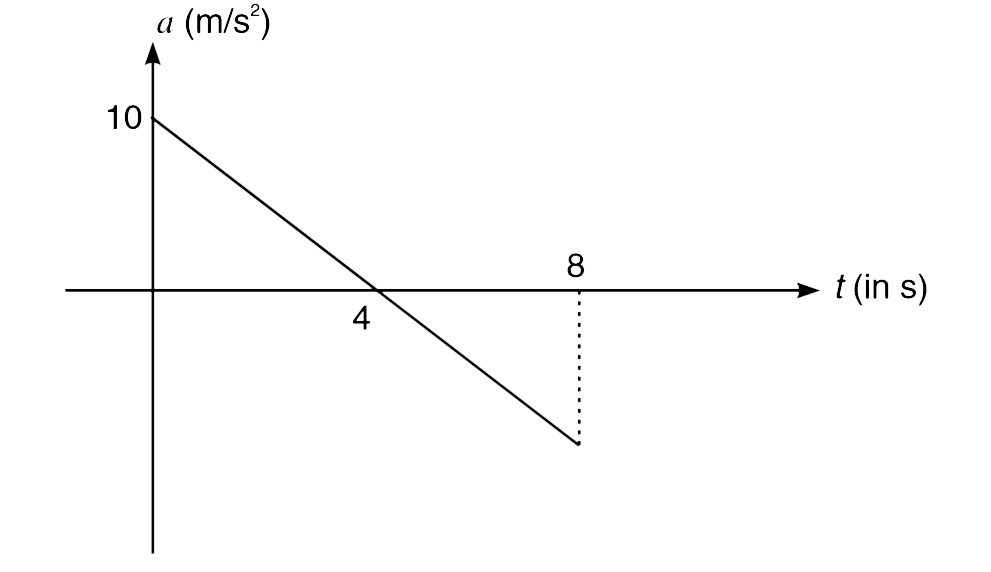
Acceleration vs time graph for a particle moving along a straight line is as shown. If the initial velocity of the particle is u=10m/s, draw a plot of its velocity vs time for 0<t<8.
View SolutionThe acceleration time graph of a particle moving along a straight line is as shown. The time at which the particle will have the velocity same as initial velocity (in s) is?
View Solution
Knowledge Check
The displacement time graph of a particle moving along a straight line is shown. The accelerations of the particle during the regions OP, PQ and QR are
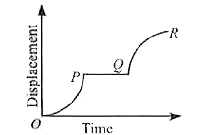 AOPPQQP−0+B+0+C+0−D−0−
The velocity- time graph of the particle moving along a straight line is shown. The rate of acceleration and deceleration is constant and it is equal to 5ms−2. If the average velocity during the motion is 20ms−1, then the value of t is
 A3 secB5 secC10 secD12 sec
The velocity –position graph of a particle moving along a straight line is shown. Then acceleration of the particle at s = 15 m is :
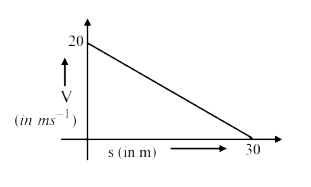 A23ms−2B−23ms−2C203ms−2D−203ms−2
The acceleration time graph of a particle moving along a straight line is as shown in Fig.At what time the particle acquires its initial velocity?
View SolutionThe velocity-time graph of a particle moving along a straight line is shown is . The rate of acceleration and deceleration is constant and it is equal to 5ms−2. If the a average velocity during the motion is 20ms−1, Then
 .
.
The value of t is.
View SolutionThe velovity-time graph of a particle moving in a straitht line is shown in . The acceleration of the particle at t=9s is.
 .
.
View Solution
The velocity displacement graph of a particle moving along a straight line is shown in figure.
Then the acceleration displacement graph is.
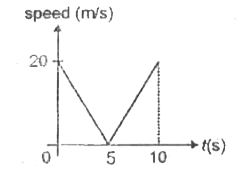
View SolutionThe speed - time graph for a body moving along a straight line is shown in figure. The average acceleration of body may be
View Solution

