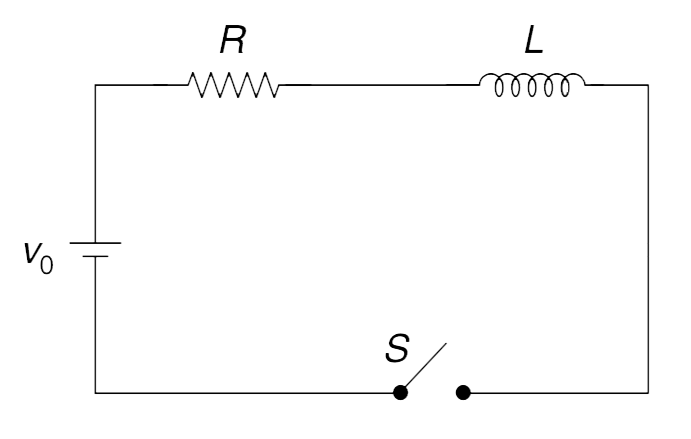
A pure inductor coil having inductance L is connected to a resistance R and a cell of emf as shown in the figure. Switch ‘S’ is closed at t = 0.
(a) Plot the variation of voltage across the resistance and the inductance as a function of time
(b) Find the time when the two curves, obtained in (a) intersect.
(c) A student decides to start counting time from the instant the current becomes half its maximum value. Show the graphical plot of current vs time as obtained by this student.
The correct Answer is:
(b)
(c)
Related Playlists
- BOOK - ARIHANTCHAPTER - ELECTROMAGNETIC INDUCTIONEXERCISE - Level 312videos
ELECTROMAGNETIC INDUCTION
- BOOK - ARIHANTCHAPTER - ELECTROMAGNETIC INDUCTIONEXERCISE - Level 312videos
ELECTROMAGNETIC INDUCTION
- BOOK - ARIHANTCHAPTER - CURRENT ELECTRICITYEXERCISE - Current Electricity105videos
CURRENT ELECTRICITY
- BOOK - ARIHANTCHAPTER - ELECTROSTATICSEXERCISE - Level 359videos
ELECTROSTATICS
Similar Questions
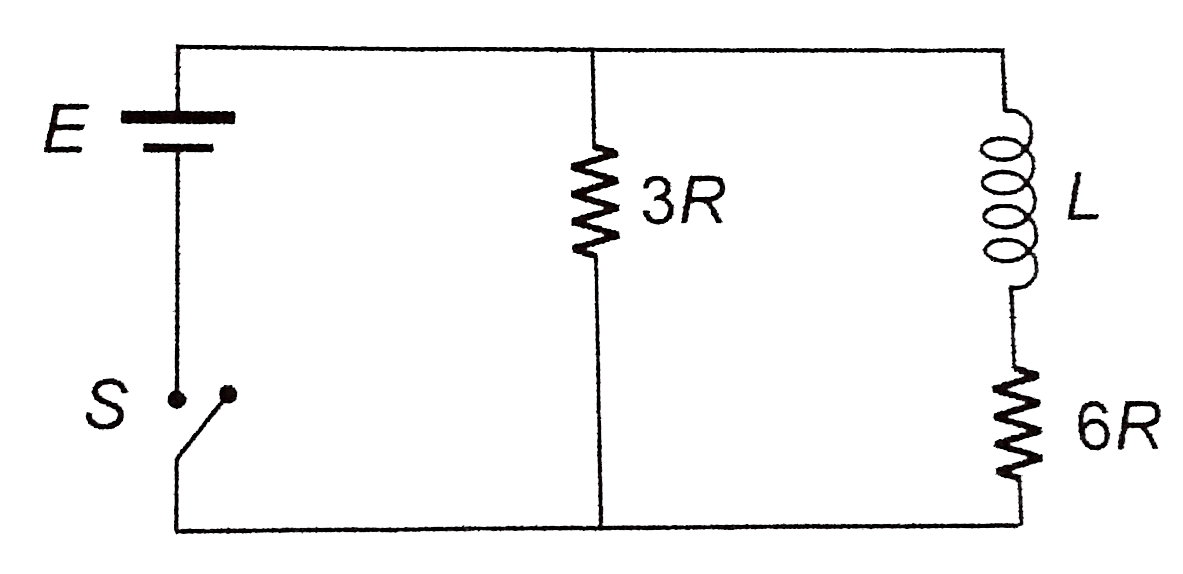
In the circuit shown in figure switch S is closed at time t=0
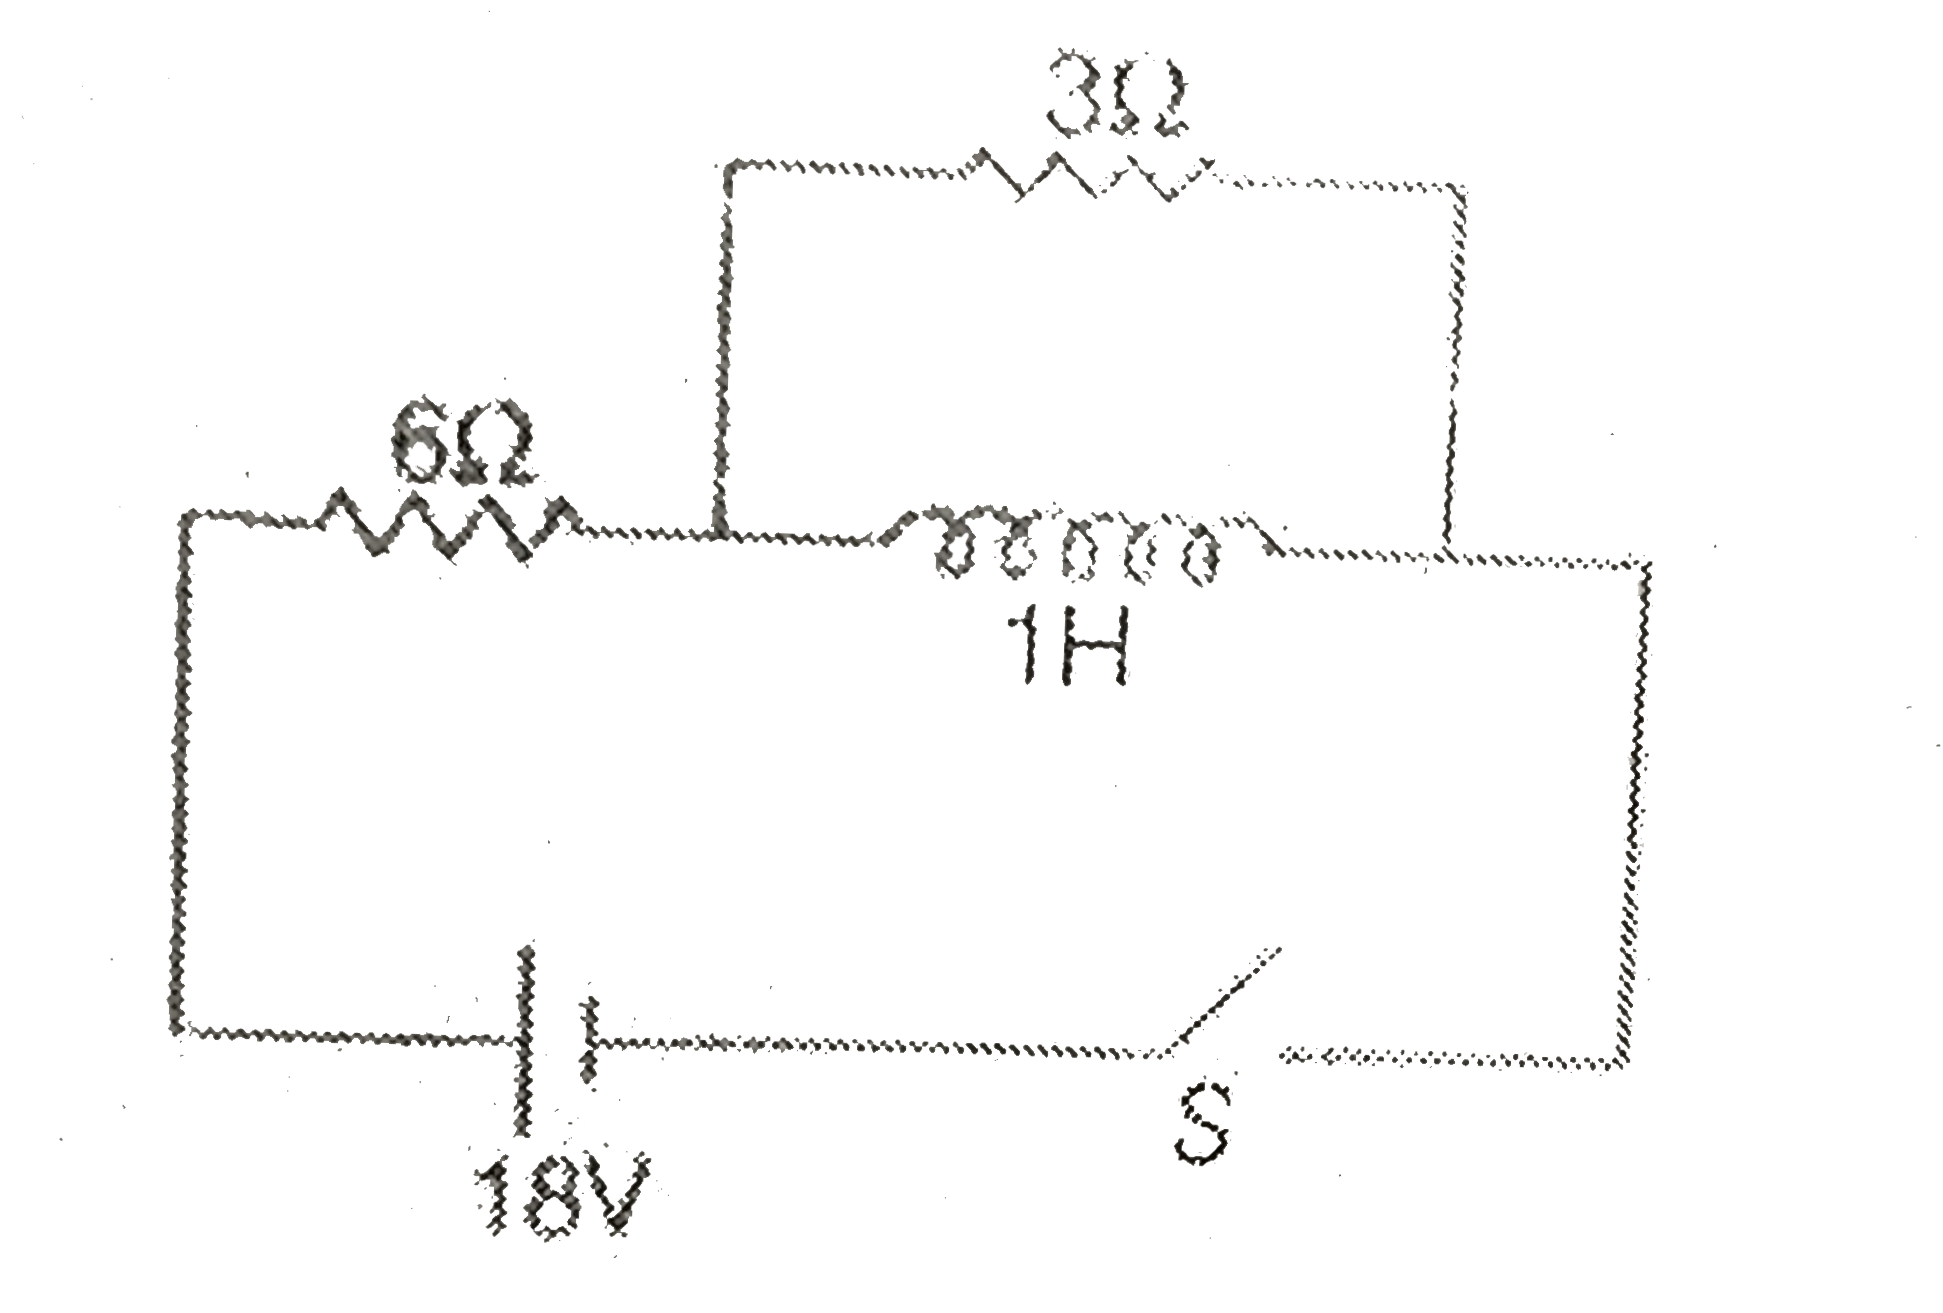
Potential difference across 3Ω resistance at time t is given byView SolutionIn the circuit shown in figure switch S is closed at time t=0

Potential difference across 3Ω resistance at time t is given byView Solution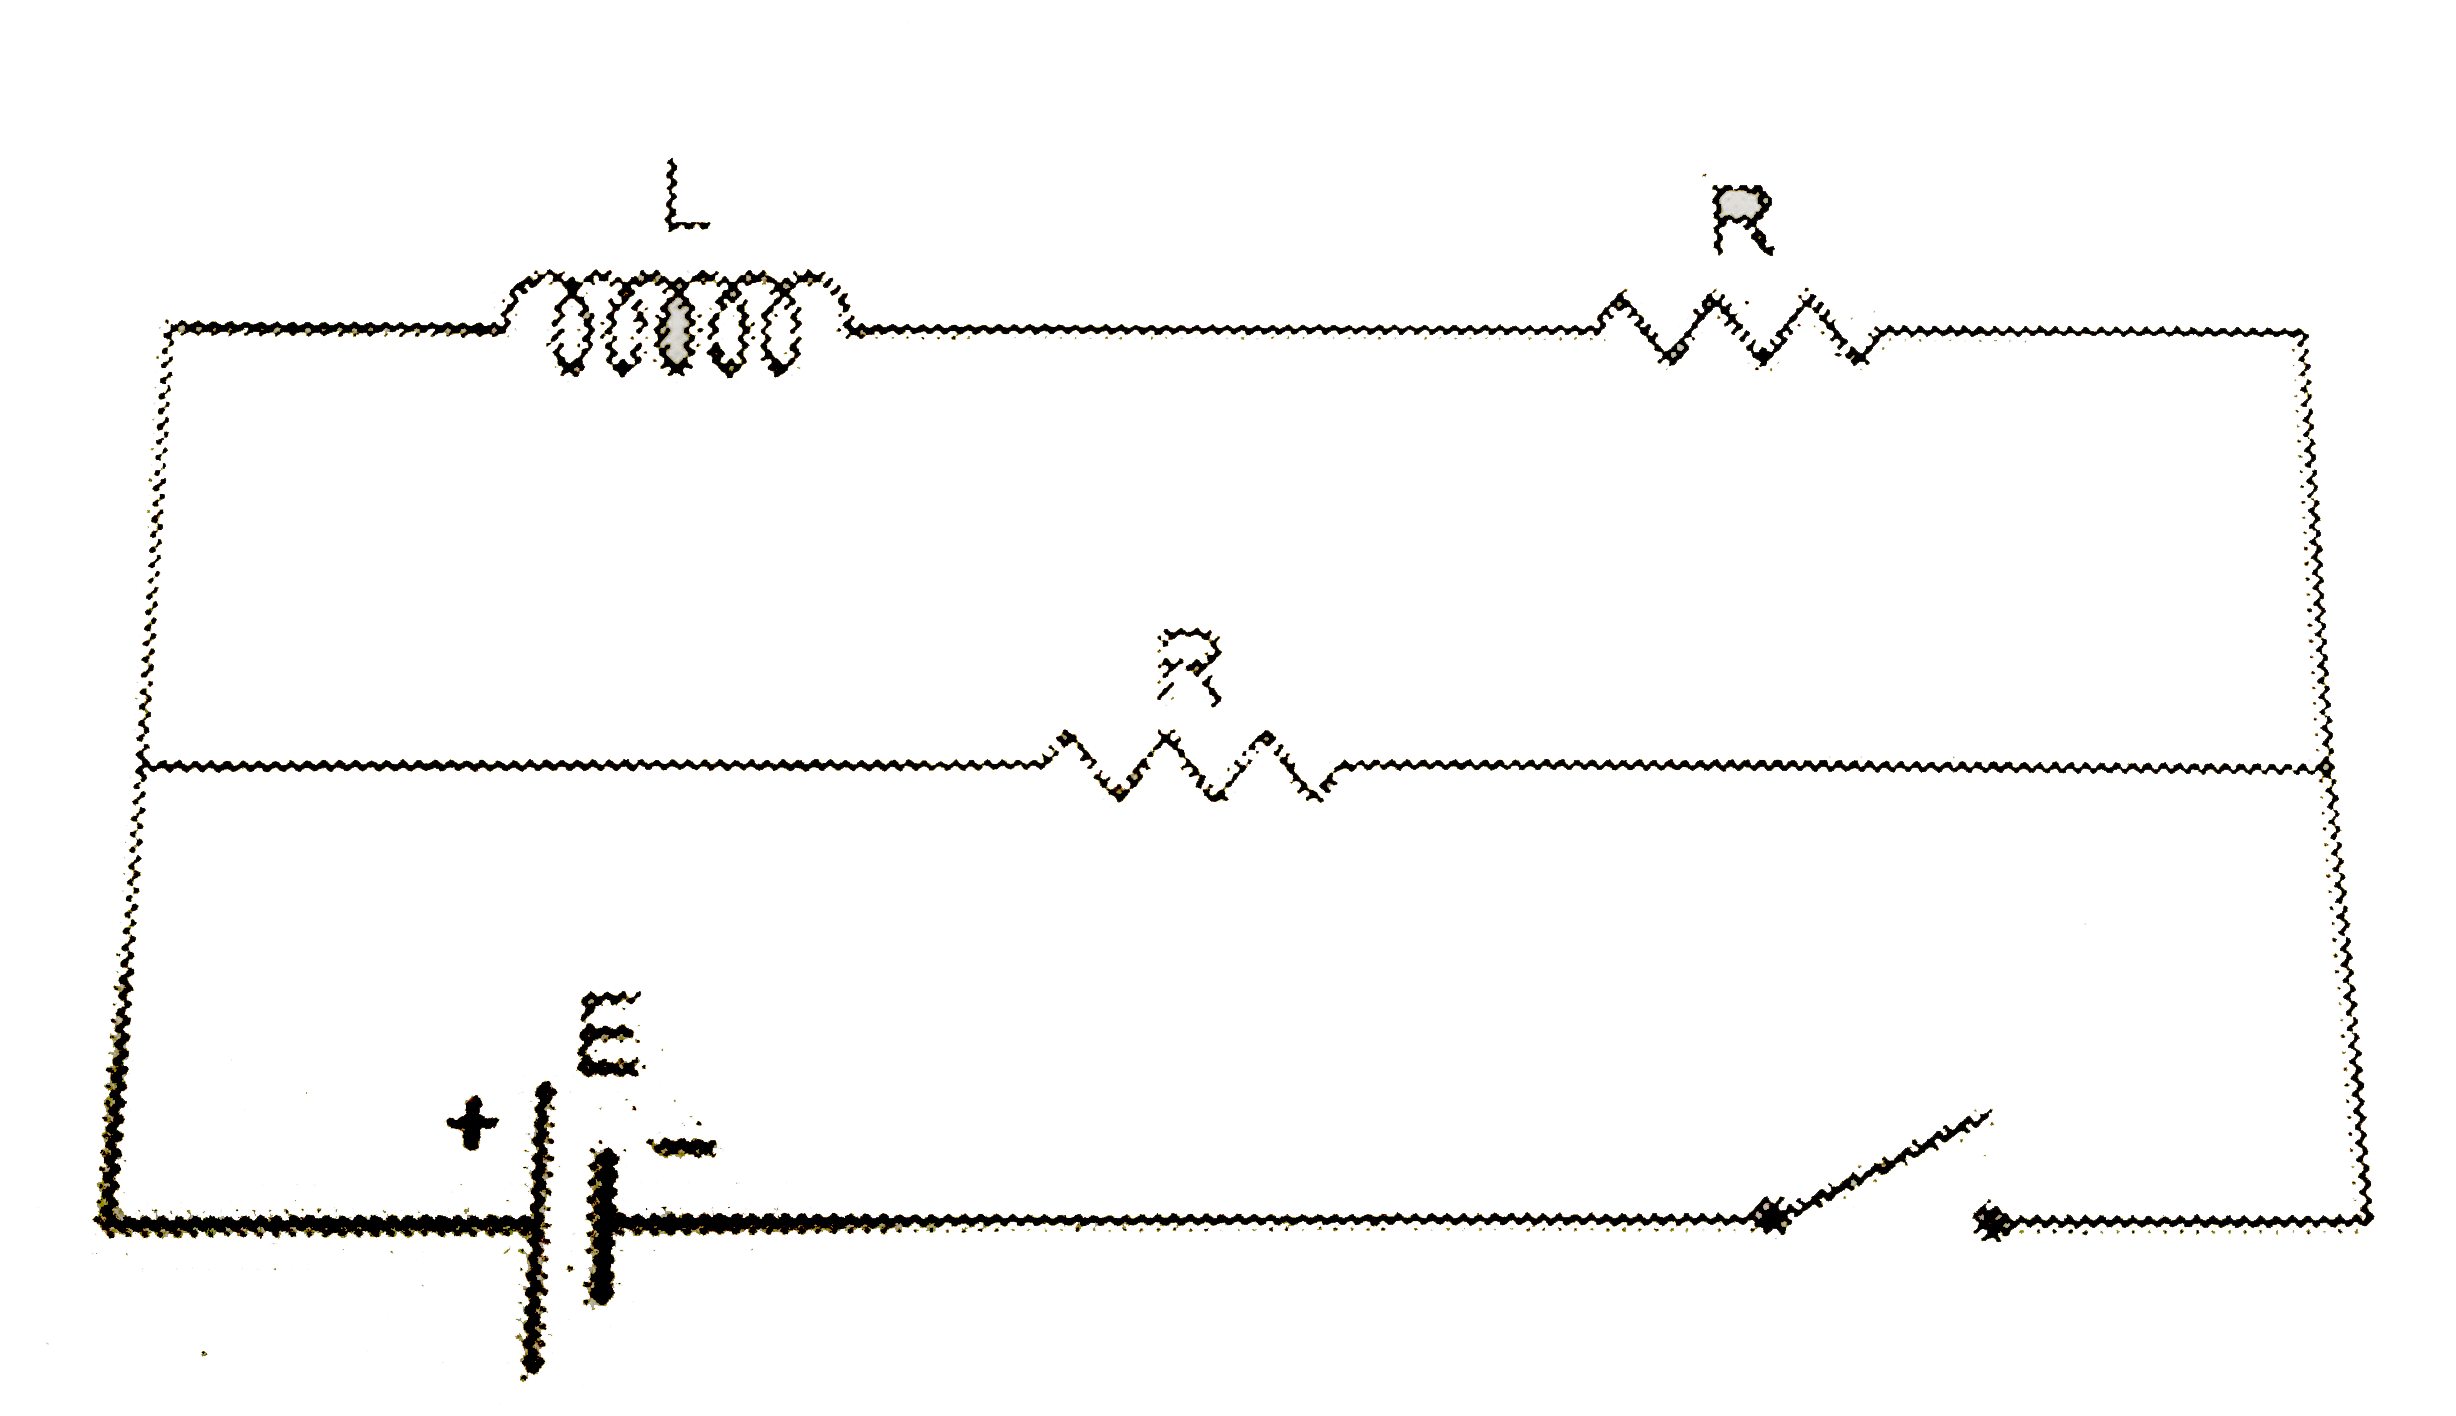
A coil of self -inductance L and resistance R is connected to a resistance R and a cell of emf E as shown. The switch is kept closed for a long time and then opened. The heat produced in the coil, after opening the switch isView SolutionIn the circuit shown in figure switch S is closed at time t=0
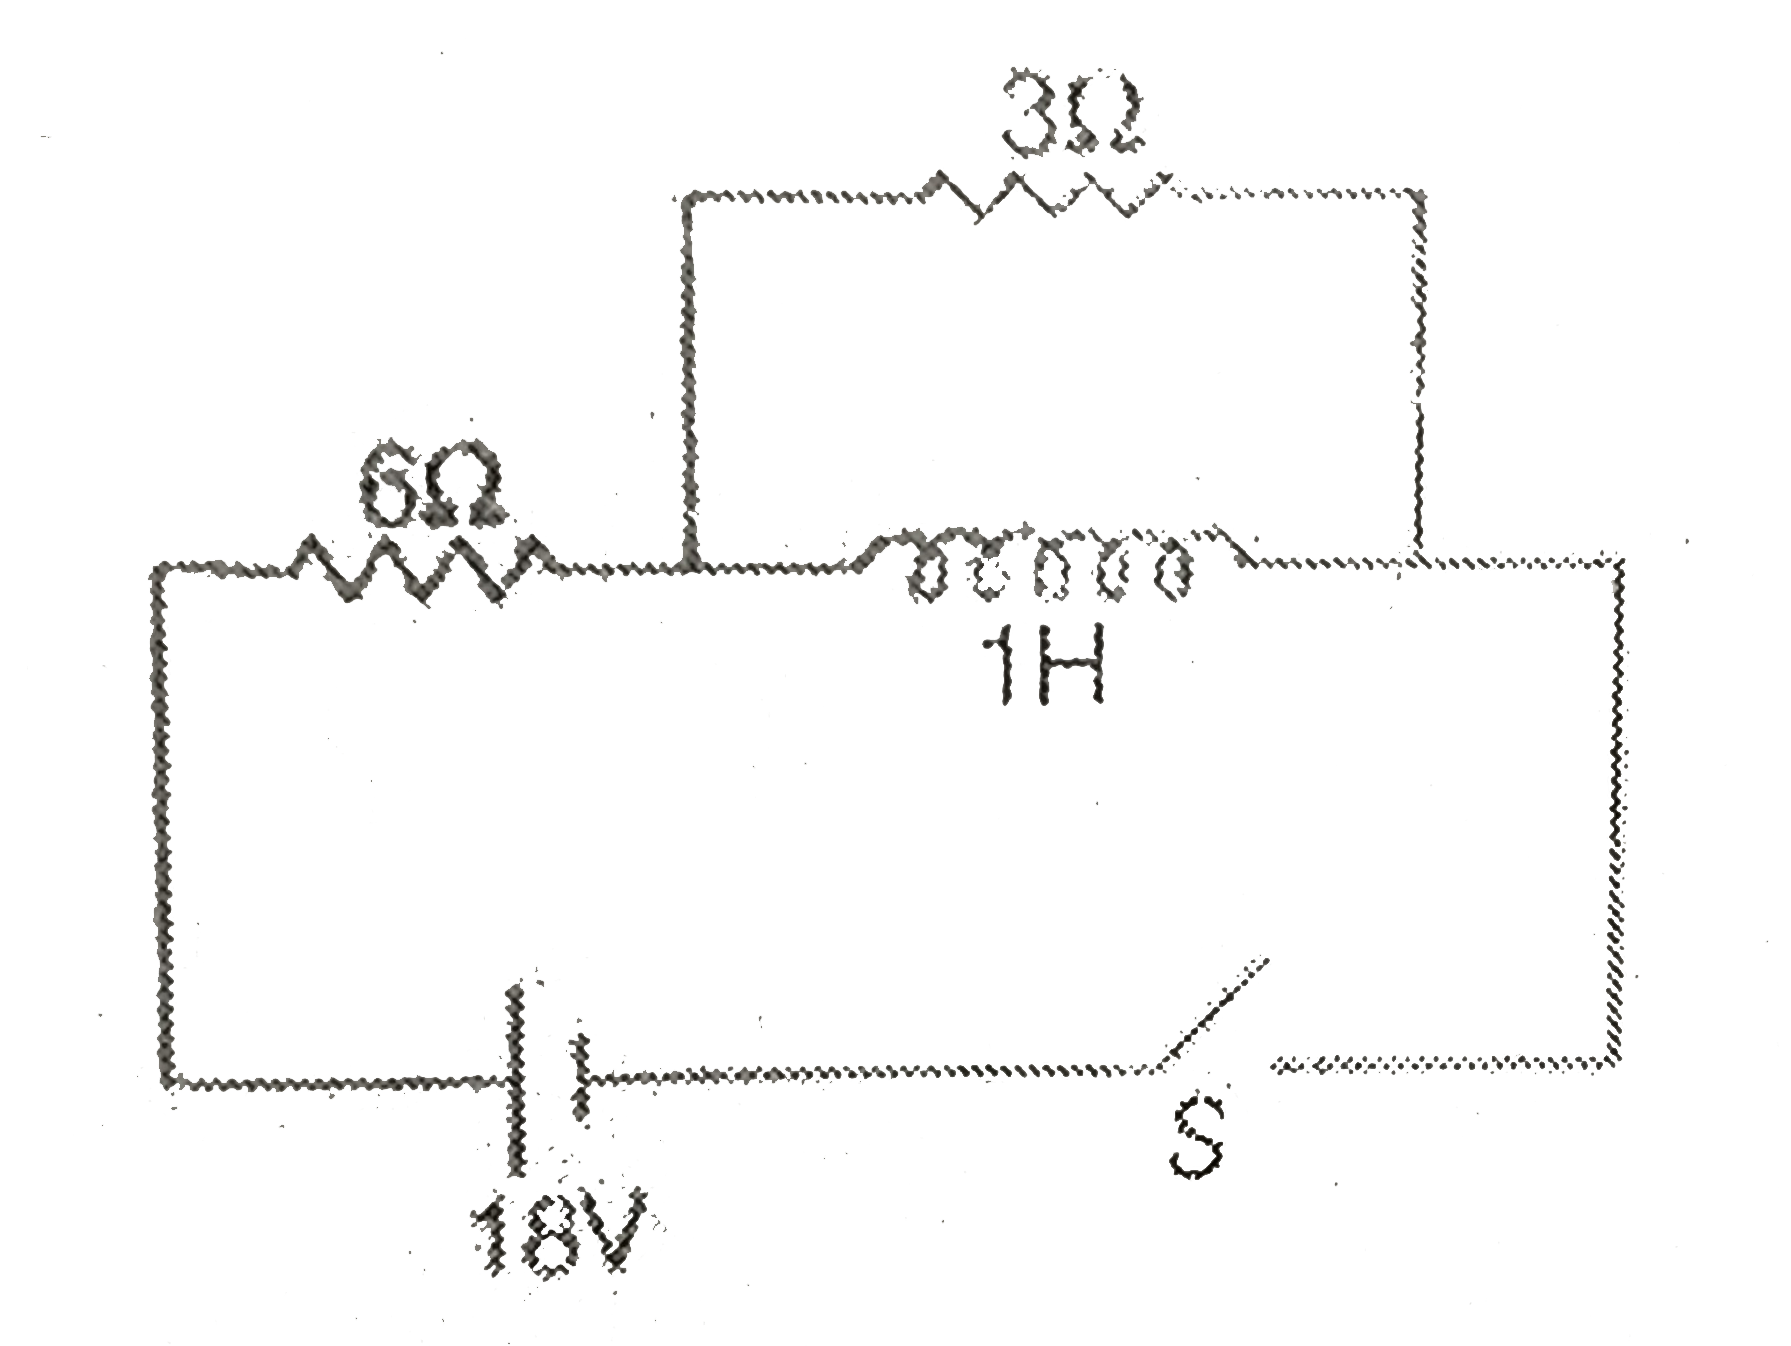
At what time current through 3Ω resistance and 1H inductor are equal?View SolutionIn the circuit shown in figure switch S is closed at time t=0

At what time current through 3Ω resistance and 1H inductor are equal?View SolutionAn inductor of inductance L = 8 H and a resistor of resistance R = 2Ω are connected in series with a battery of emf E = 10 V as shown in the figure. If the switch is closed at t = 0, then the voltage drop across the inductor at t = 1 s will be in volts)
View SolutionConsider an ideal inductor (having no resistance) of inductance L which is connected to an ideal cell (no resistance) of emf E by closing the switch S at time t=0. Plot the variation of current through the inductor versus time.
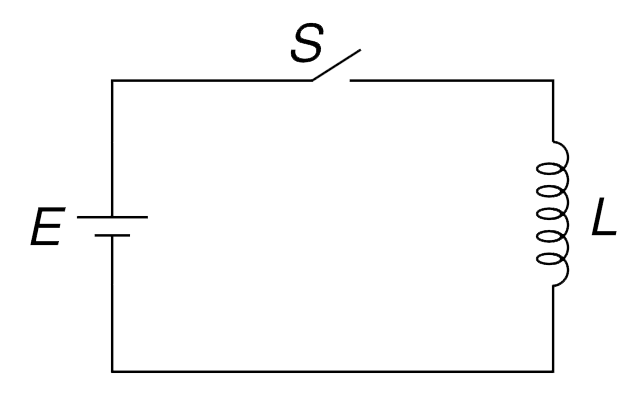 View Solution
A pure inductor L, a capactior C and a resistance R are connected across a battery of emf E and internal resistance r as shows in Fig. Switch SW is closed at t=0, select the correct altermative (S).
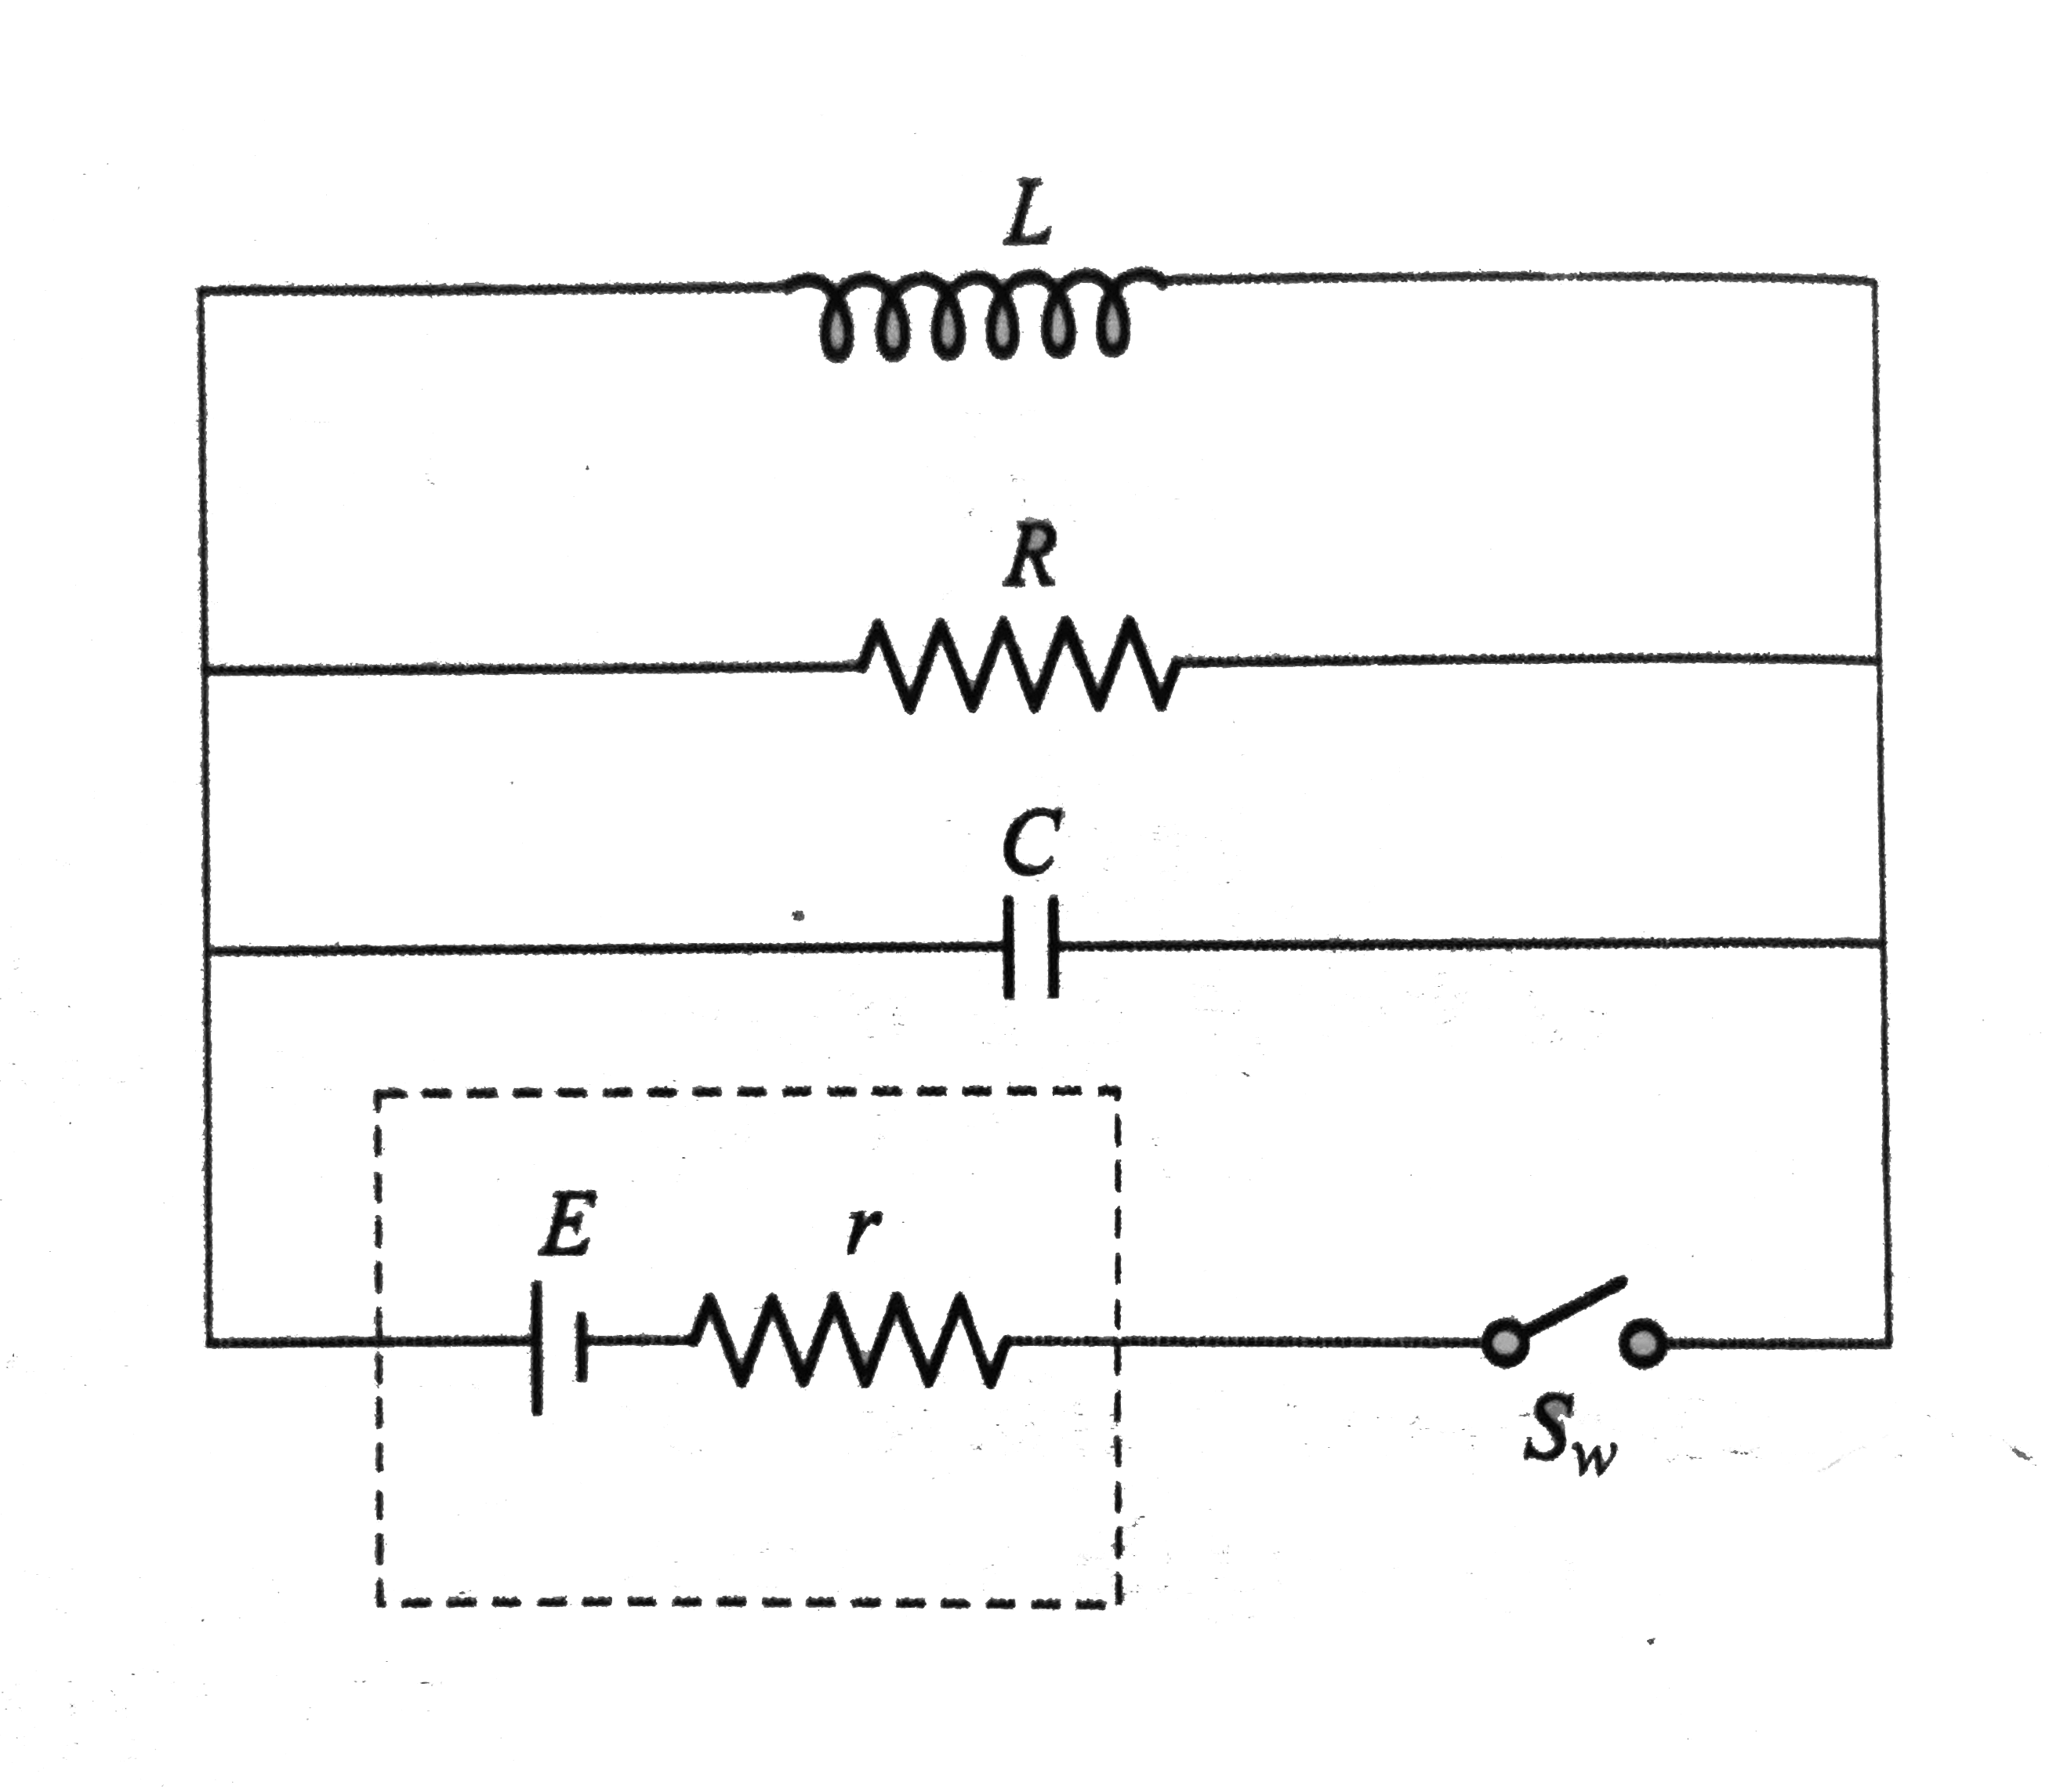 View Solution
A pure inductor L, a capactior C and a resistance R are connected across a battery of emf E and internal resistance r as shows in Fig. Switch SW is closed at t=0, select the correct altermative (S).
 View Solution
At t=0 , switch S is closed. Find time constant of the circuit and current through inductor as a function of time t .
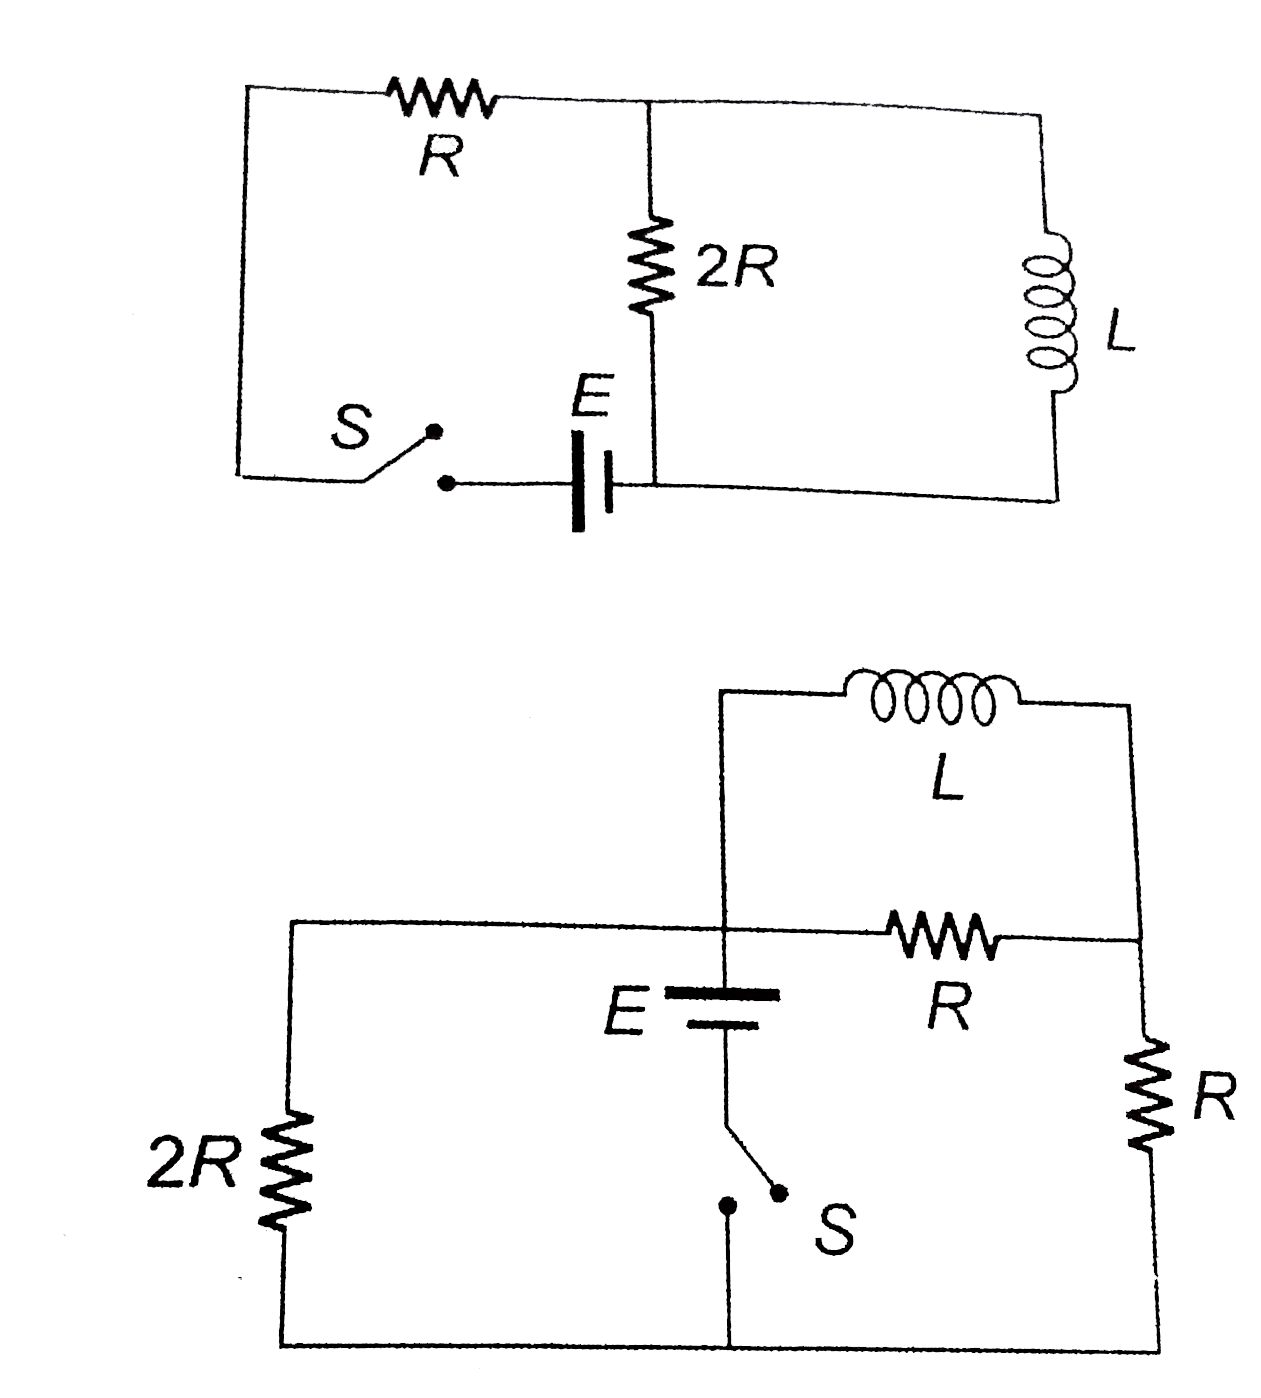
 View Solution

