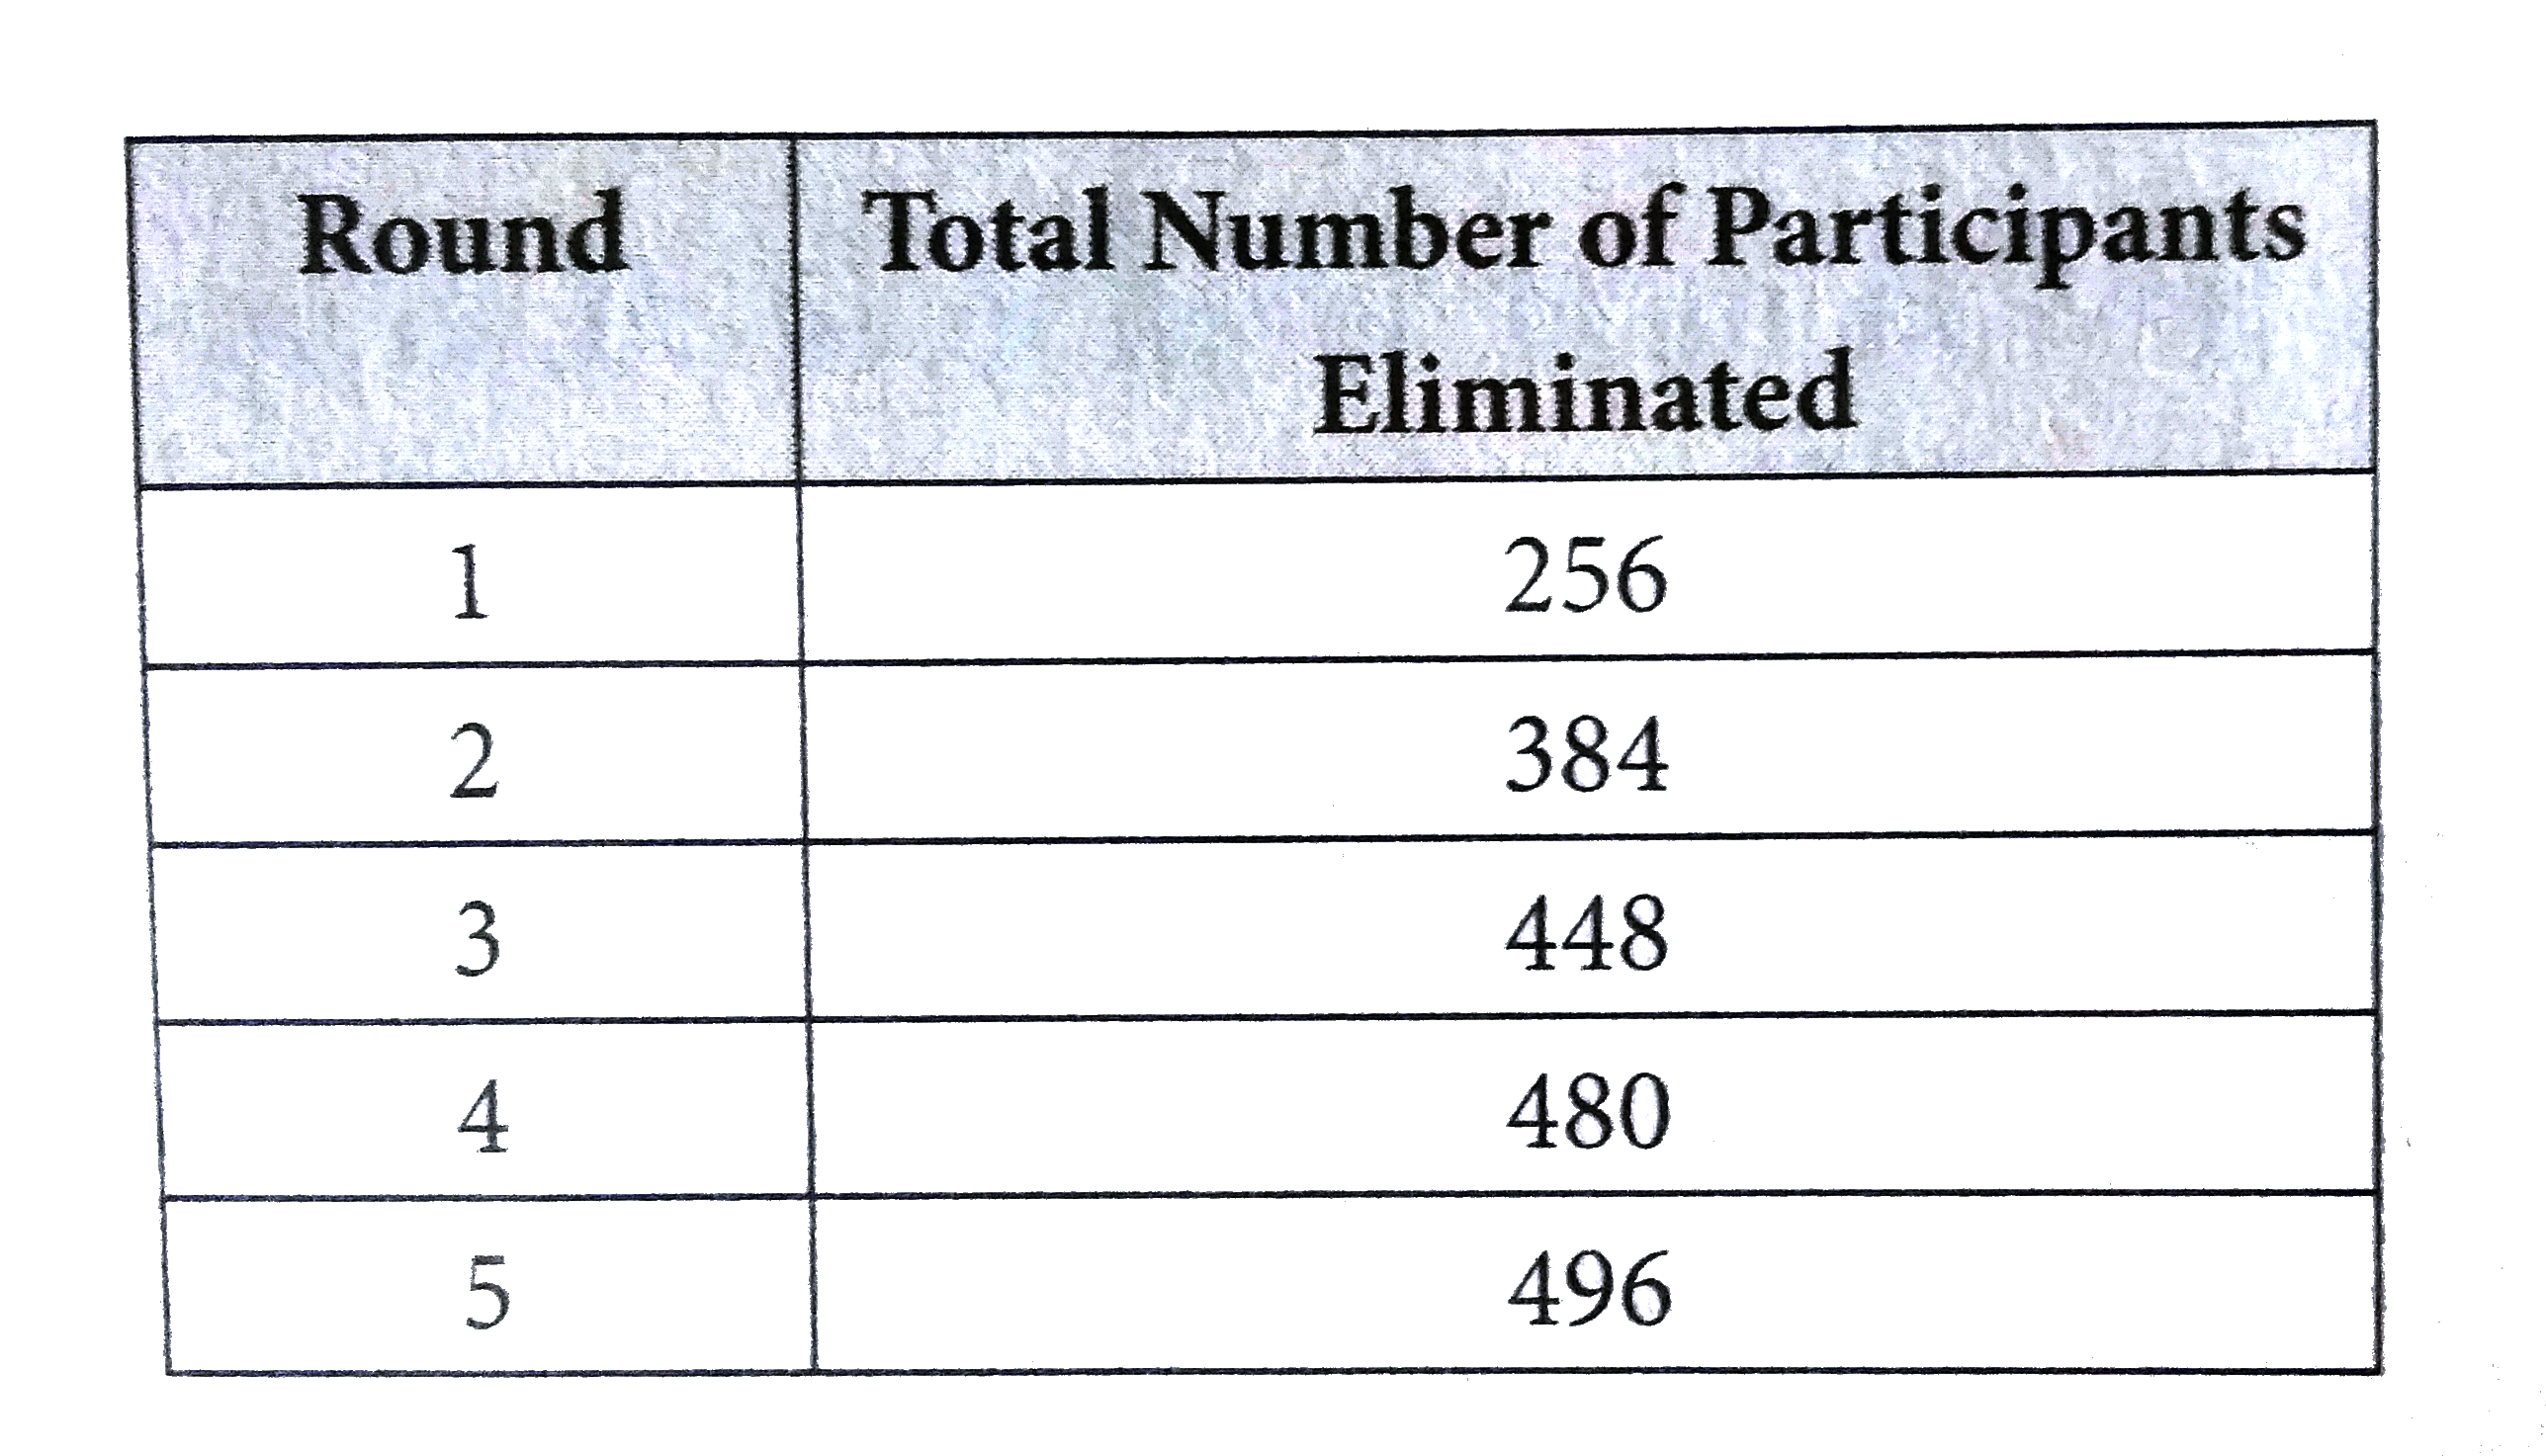
The table above shows the cummulative number of participants eliminated in a national miniature golf tournament by the end of each round. Which of the following best describes the relationship between the round and the number of participants remaining in the tournament?
Exponential gowth
Exponential decay
Linear growth
Linear decay
The correct Answer is:B
Difficult: Easy
Category: Problem Solving and Data Analysis/ Scatterplots
Strategic Advice: Skim the answer choices- they involve the shape of the data (linear or exponential) and athe direction of the data (growth/increasing or decay/decreasing). Read the question carefully and then examine the data to determine which is a match.
Getting to the Answer: Read the data carefully- asd the number of participants eliminated increase, the number of the participants remaining decrease, which means as the rounds go up, the number of participants goes down. Eliminated A and C. According to the table, the total number of participants eliminated increase at varing rates (very fast at first, and then more remaining decrease at verying rates. This indicates an exponential relationship. Choice (B) is the only answer that contains both traits.
Topper's Solved these Questions
Similar Questions
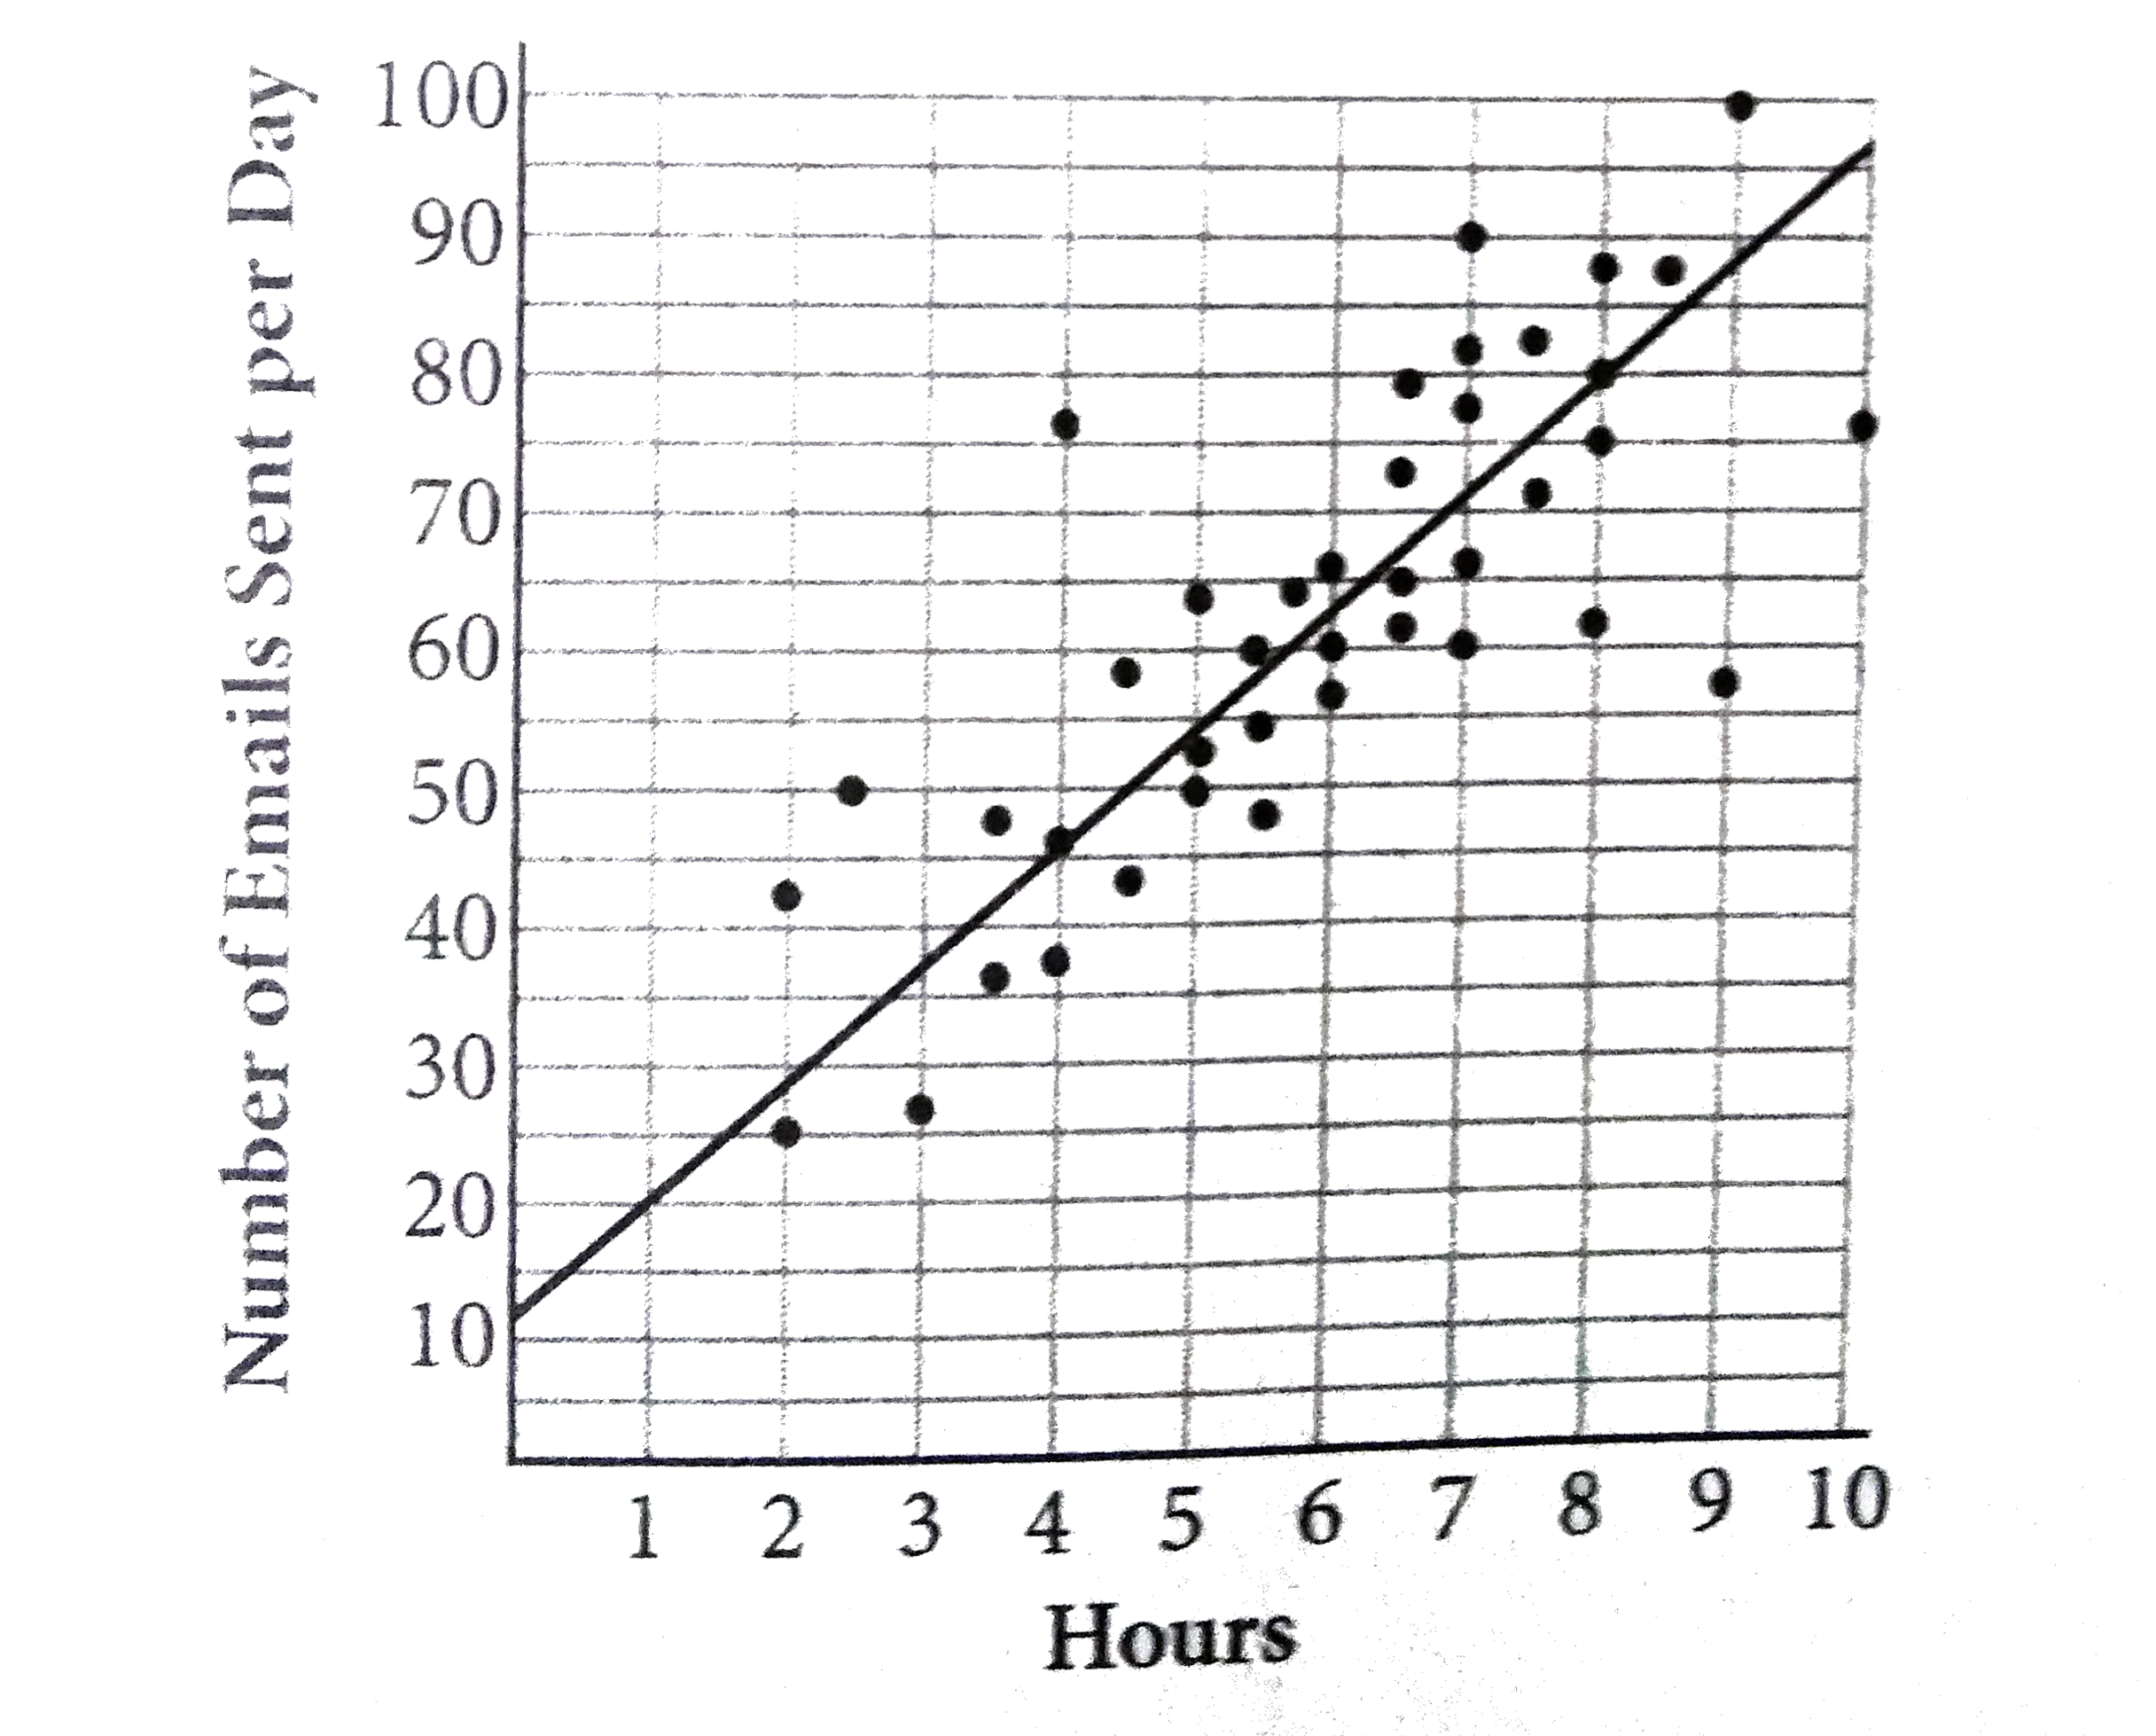
The figure above shows the number of emails sent per day plotted against the number of hours an adult works on a computer per day. Which of the following best estimates the average rate of change in the number of emails sent compared to the number of hours working on a computer?
View Solution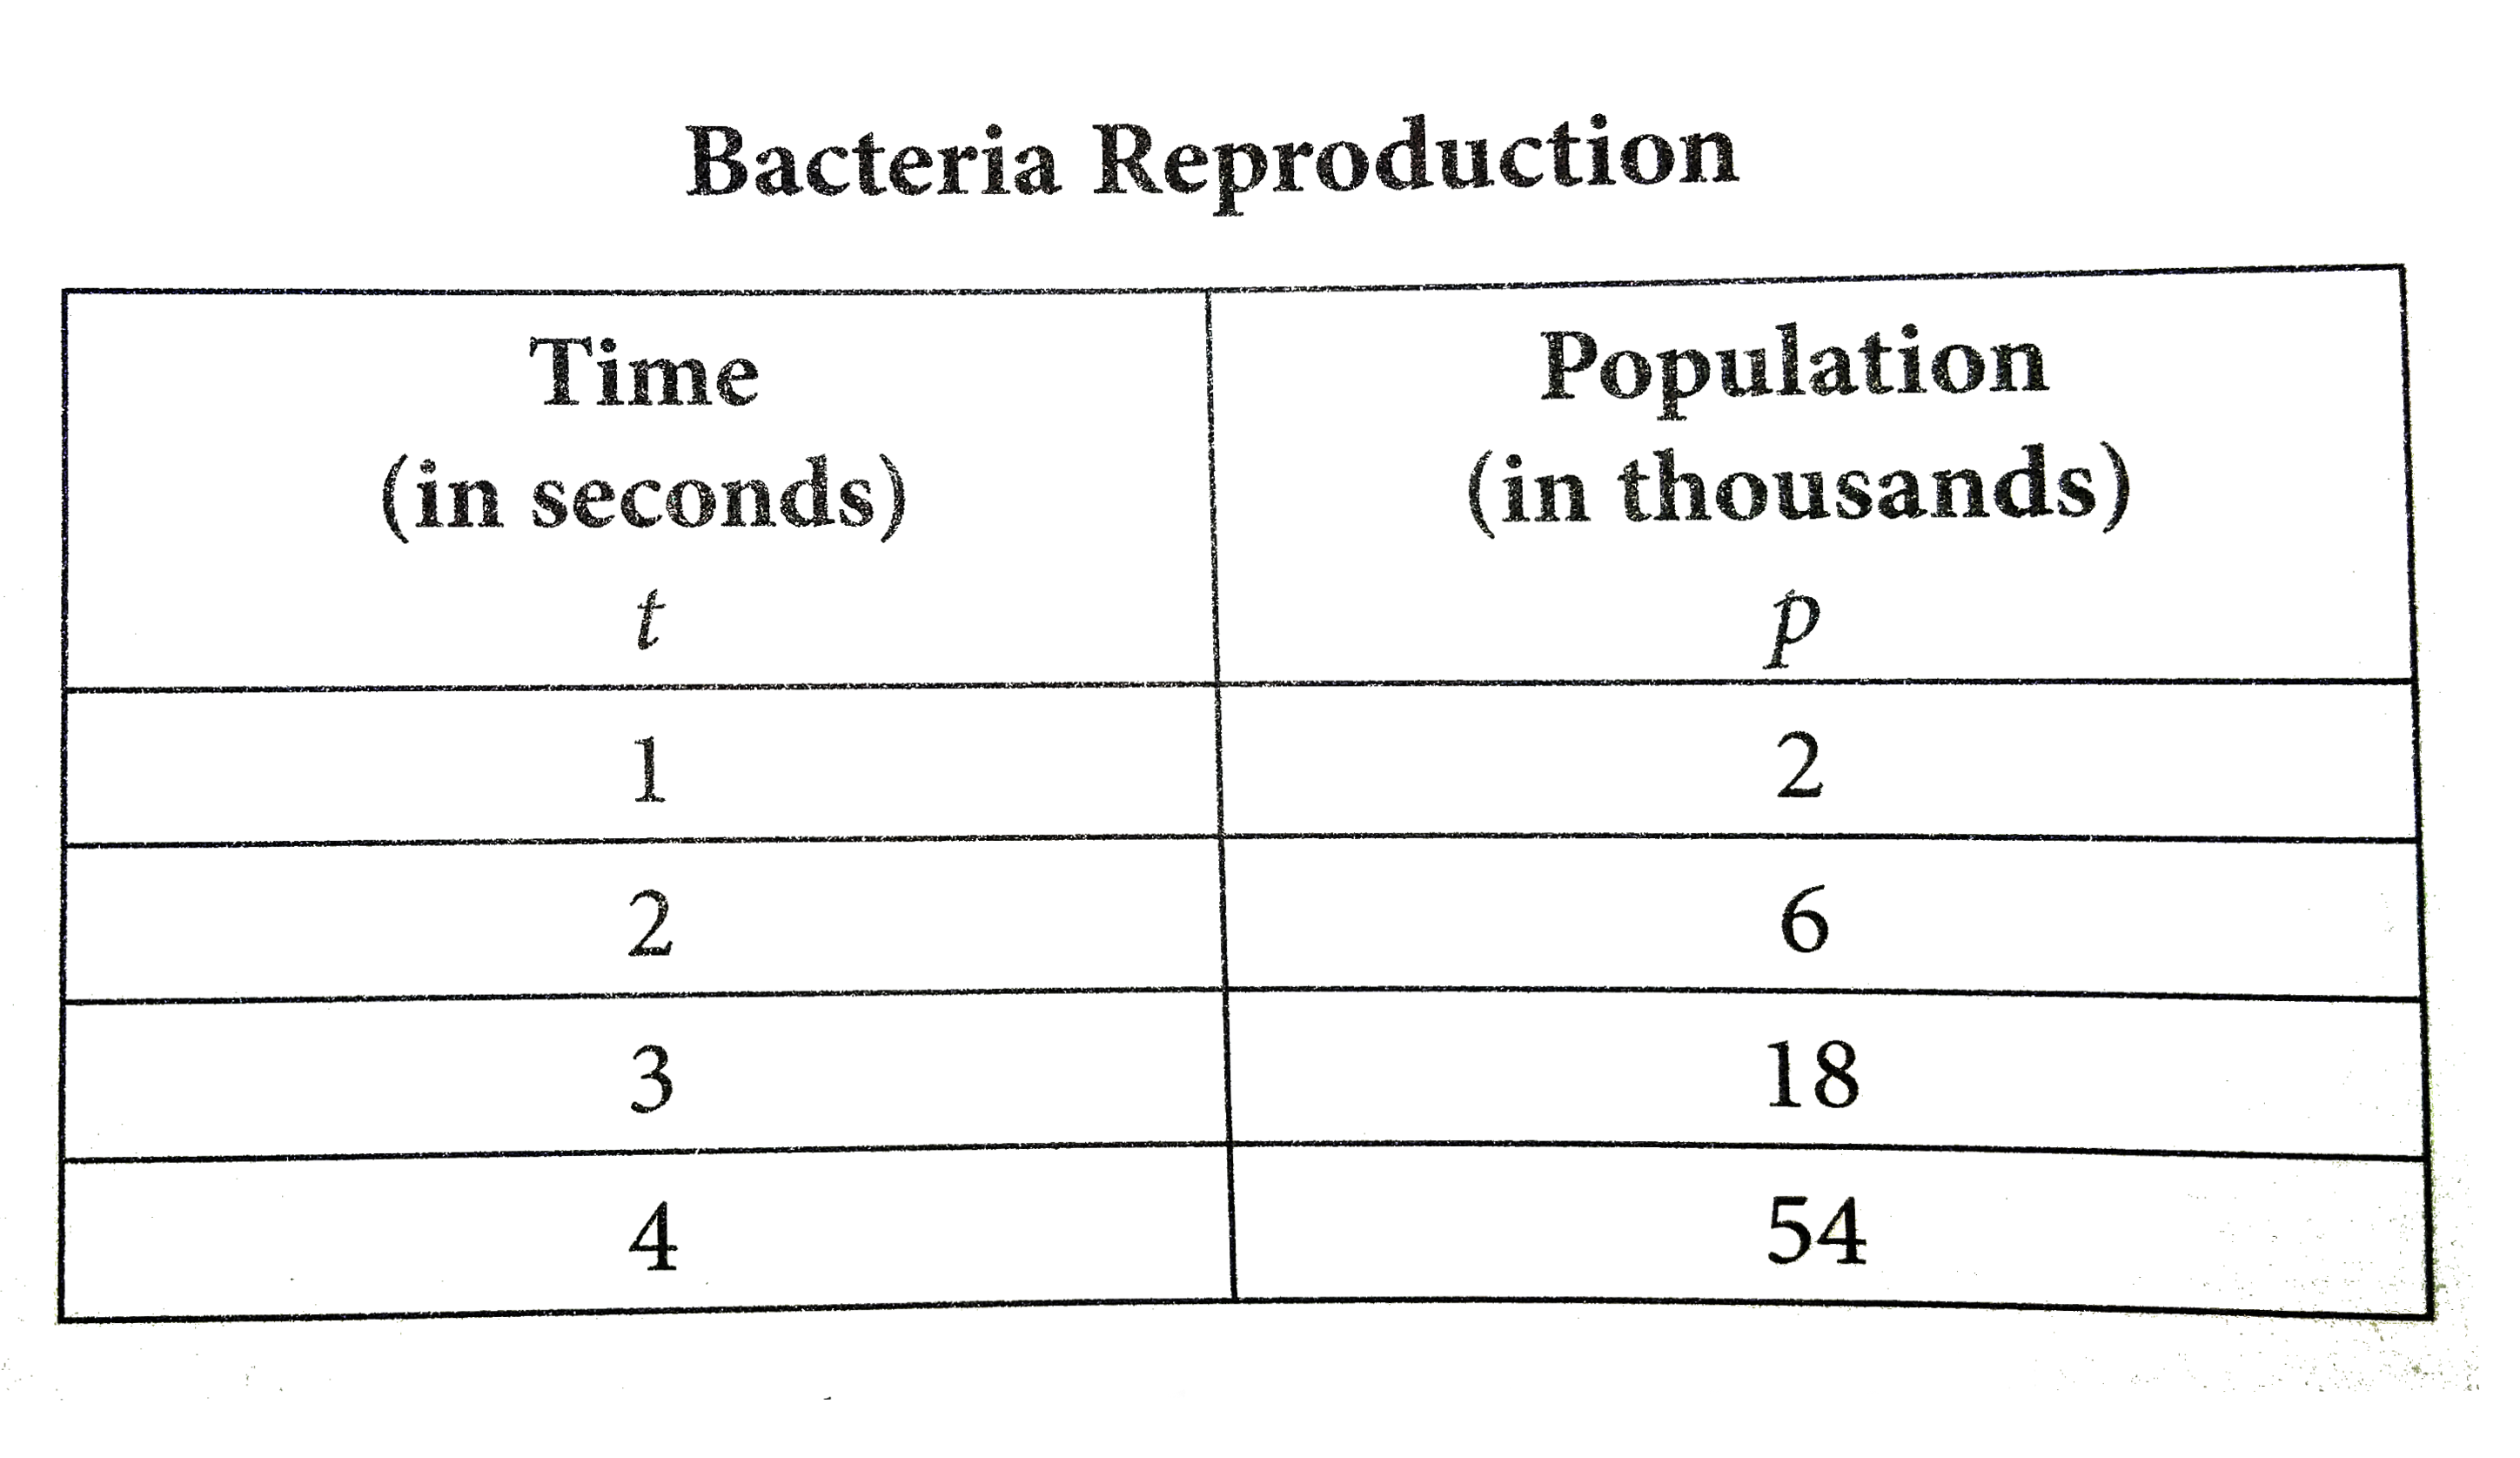
The table above shows the population growth of certain bacteria over four seconds. Which one of the following equations shows the relationship between t and p, according to the table?
View Solution
Knowledge Check
The number of bactria in a colony is estimated over the course of 9 days, as shown in the table below.
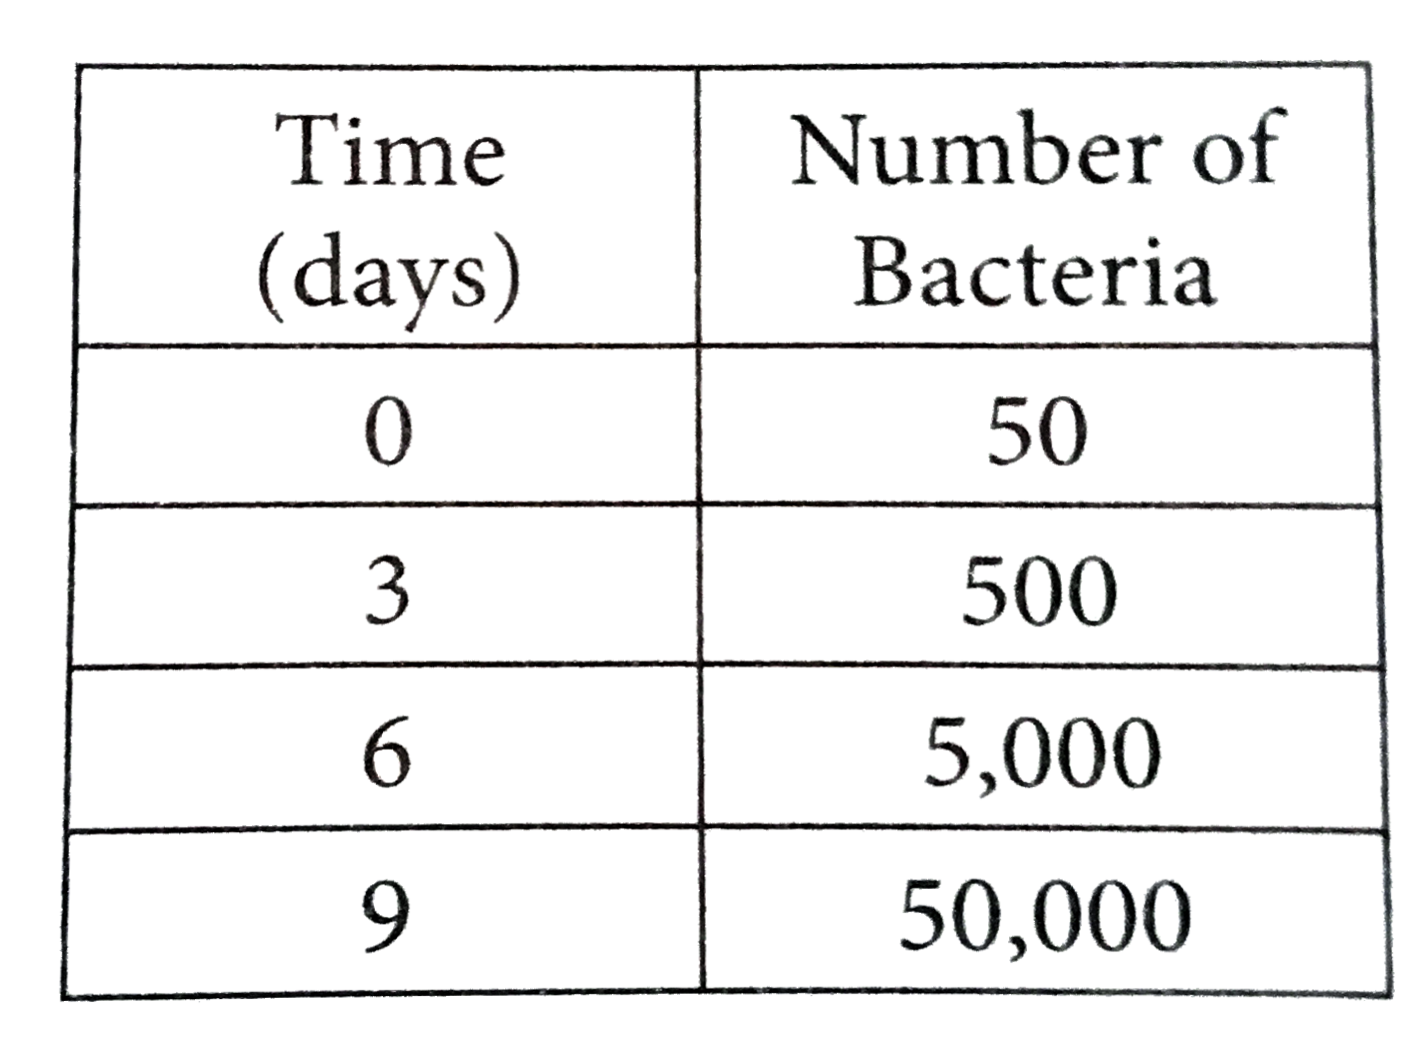
Which of the following best describes the relationship between time and the estimated number of bacteria over these 9 days?ALinear decreaseBLinear increaseCExponential decayDExponential growthThe population of mosquitoes in a swamp is estimated over the course of twenty weeks, as shown in the table.
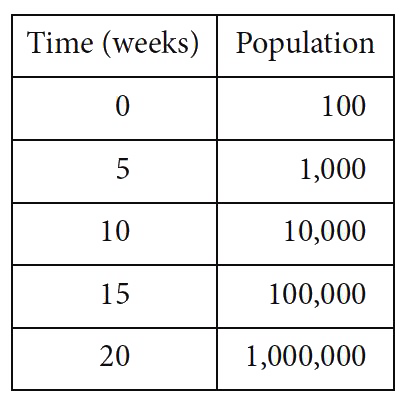
Which of the following best describes the relationship between time and the estimated population of mosquitoes during the twenty weeks?AIncreasing linearBDecreasing linearCExponential growthDExponential decay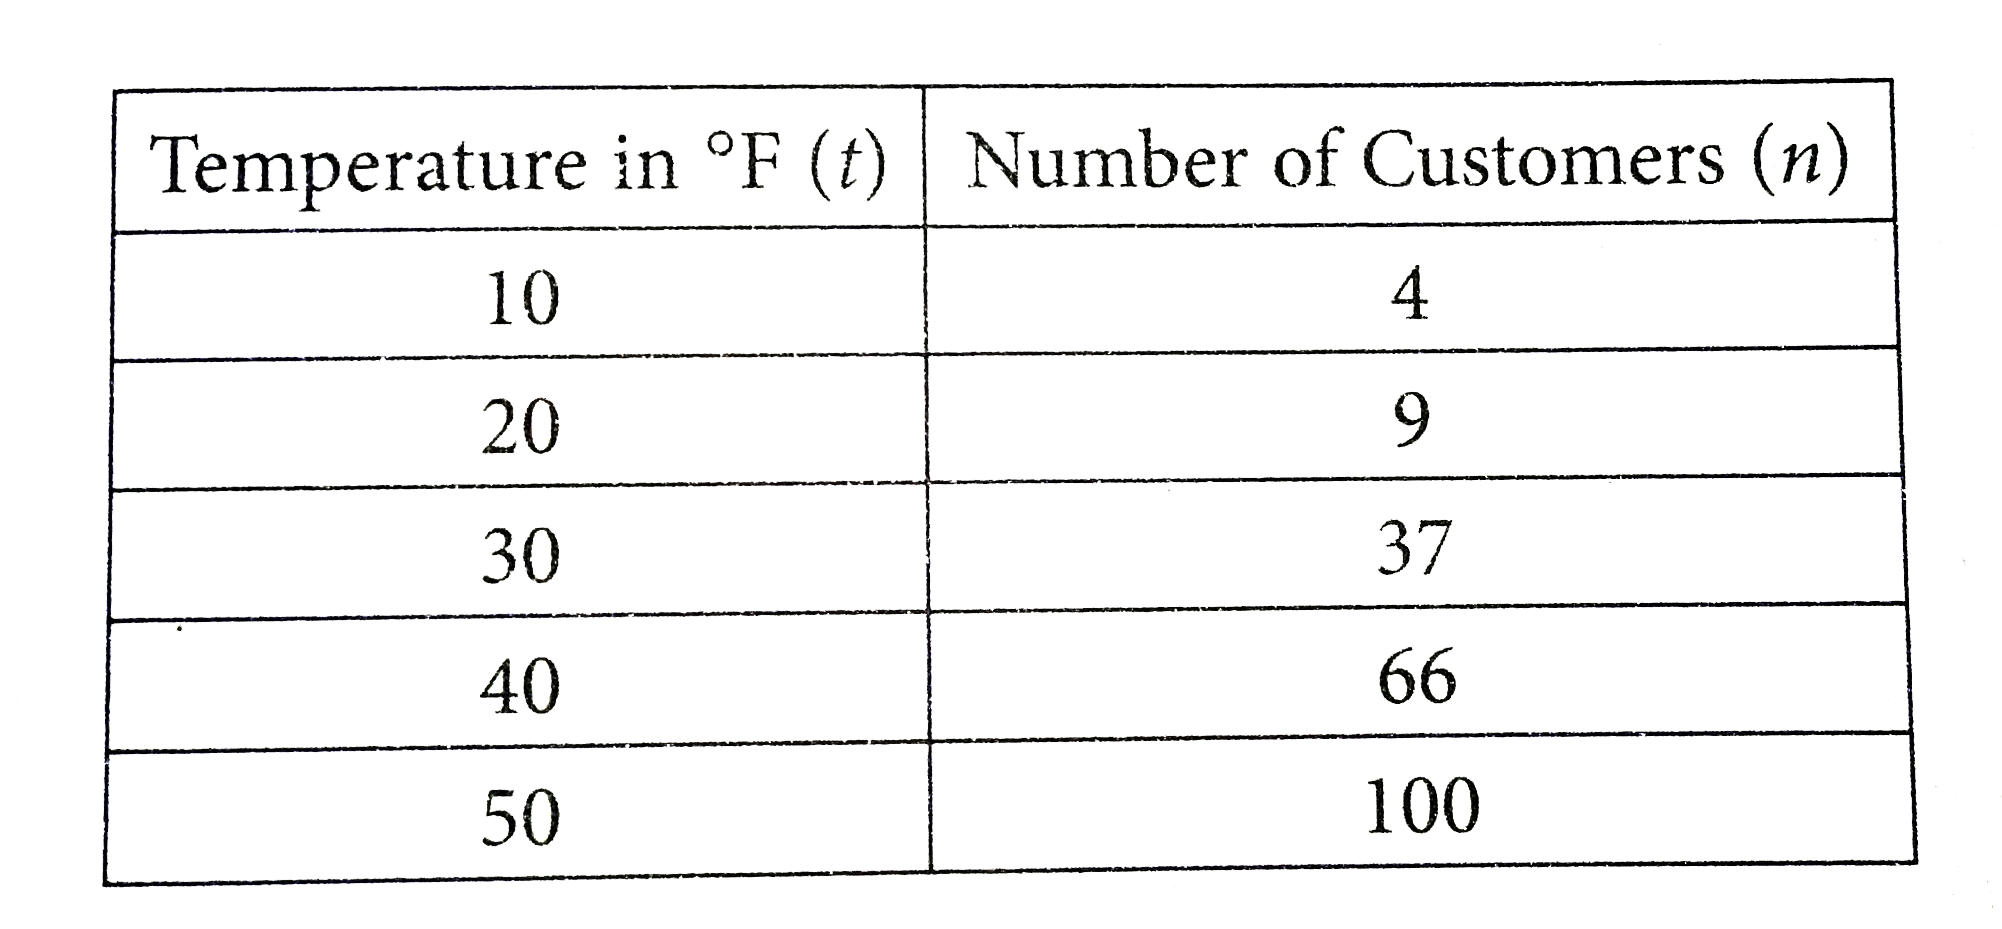
A coffee shop noticed that the outside temperature affected the number of customers who came to the shop that day, as shown in the table above. Which of the following graphs best represents the relationship between the outside temperature t, and the number of customers,n, as indicated by the table?A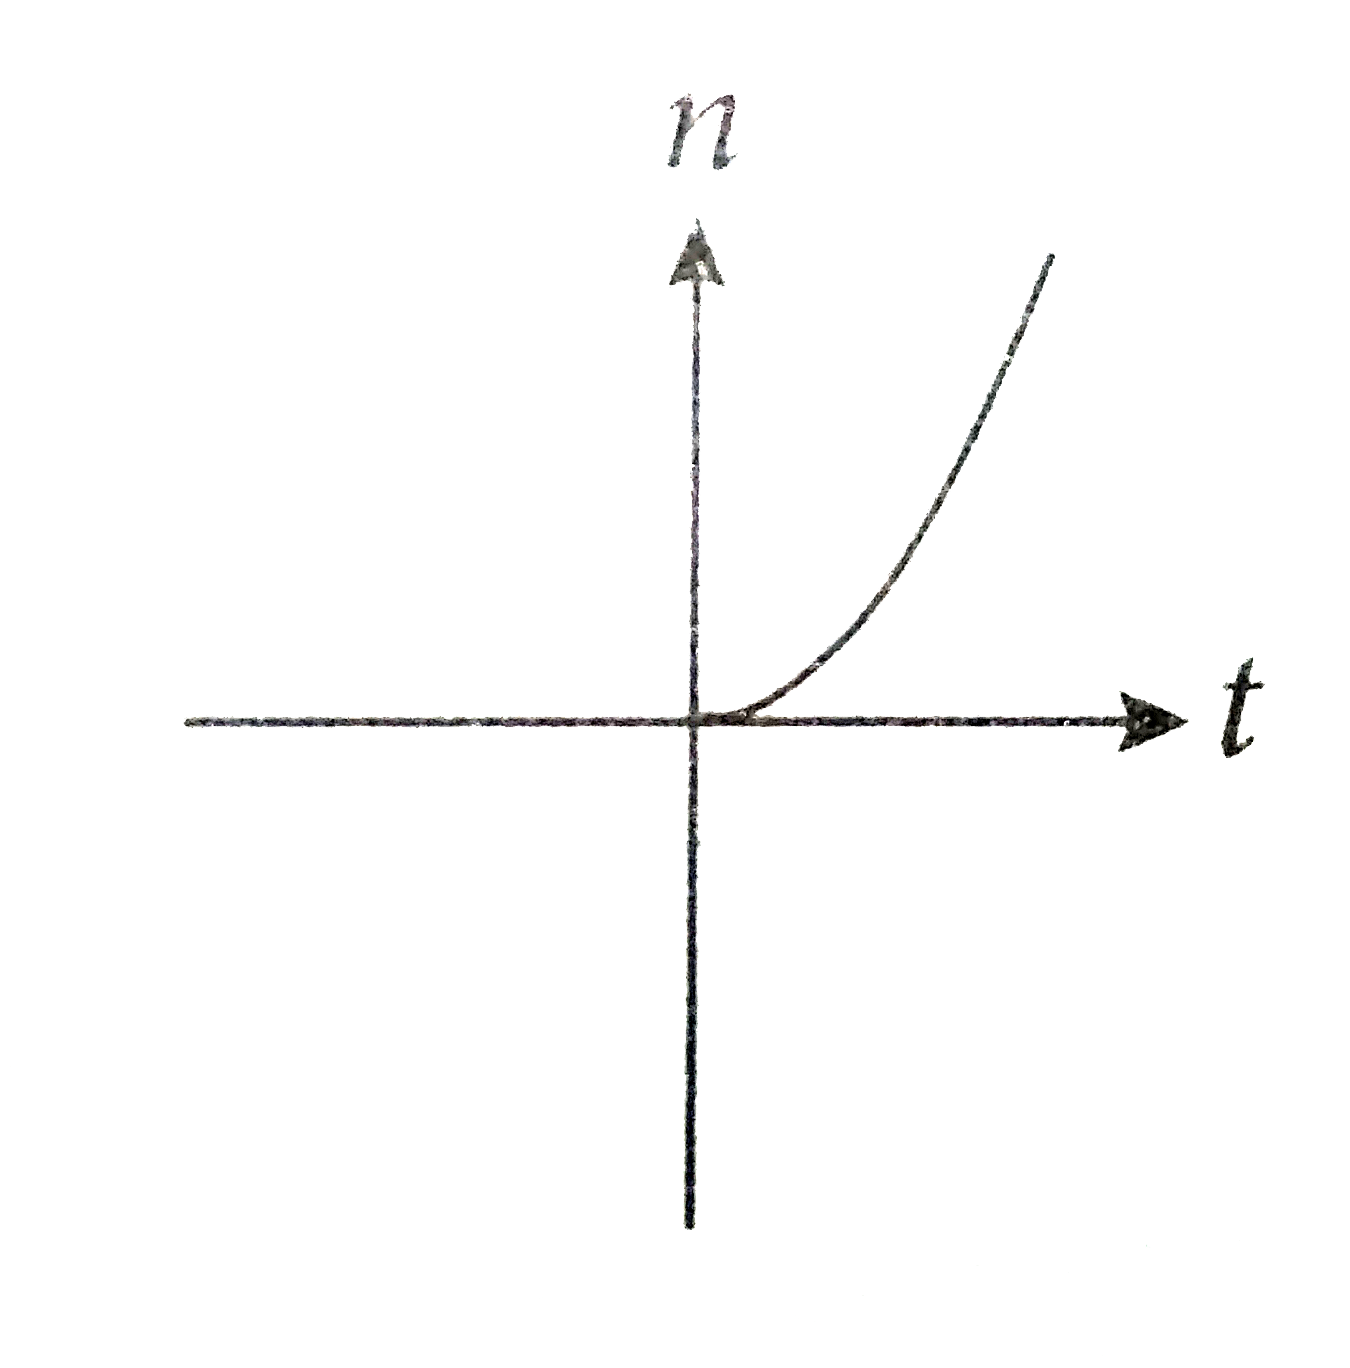 B
B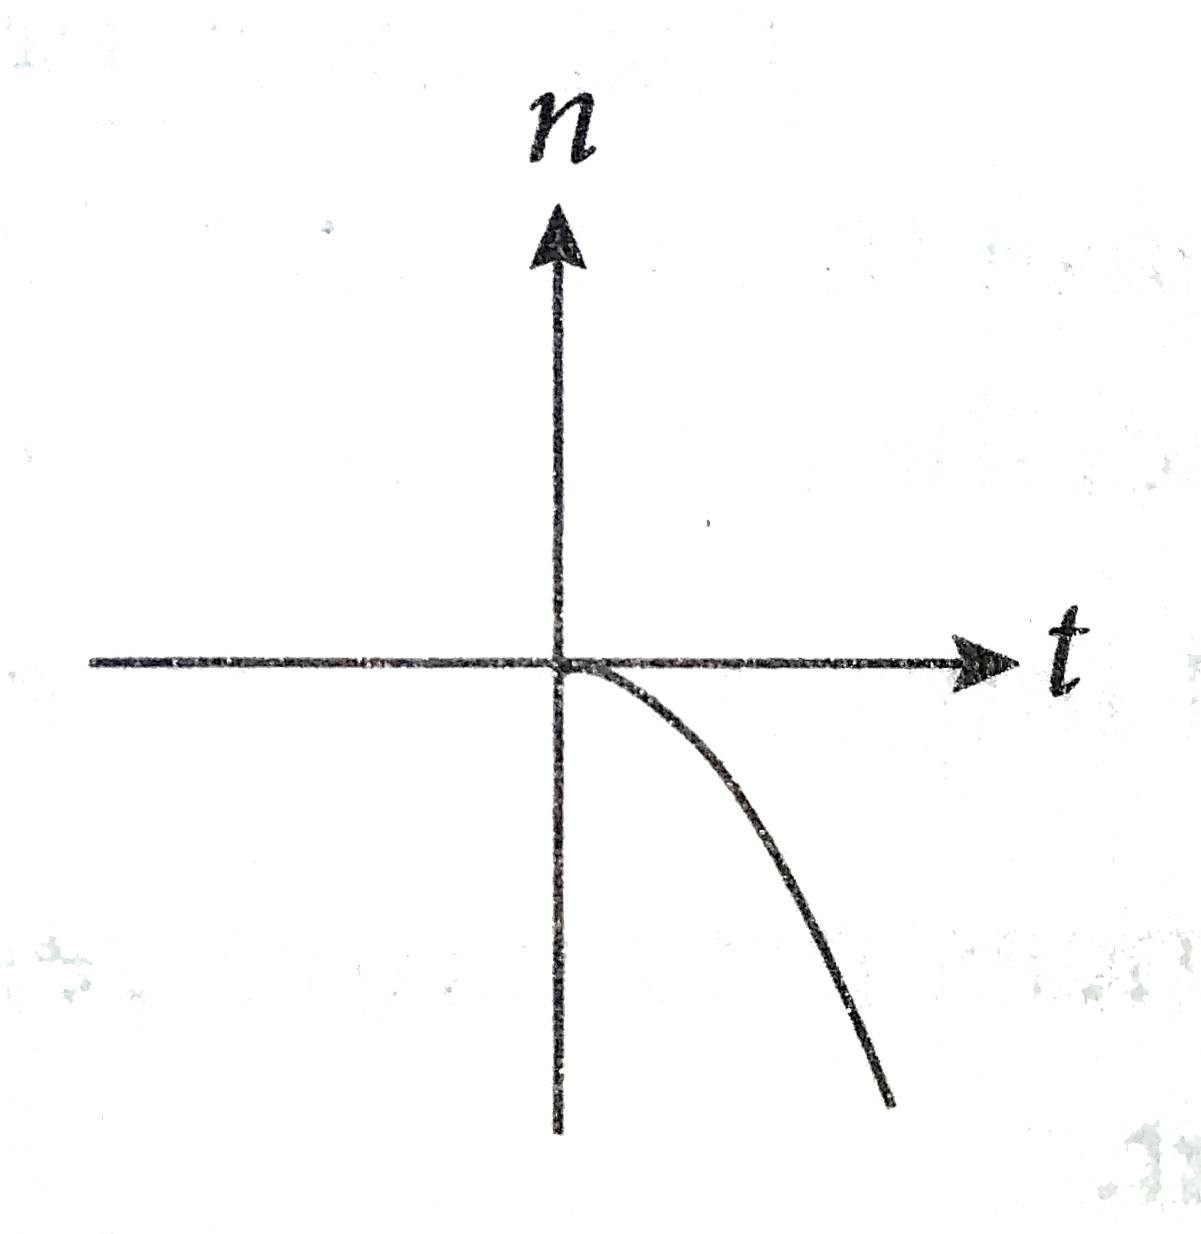 C
C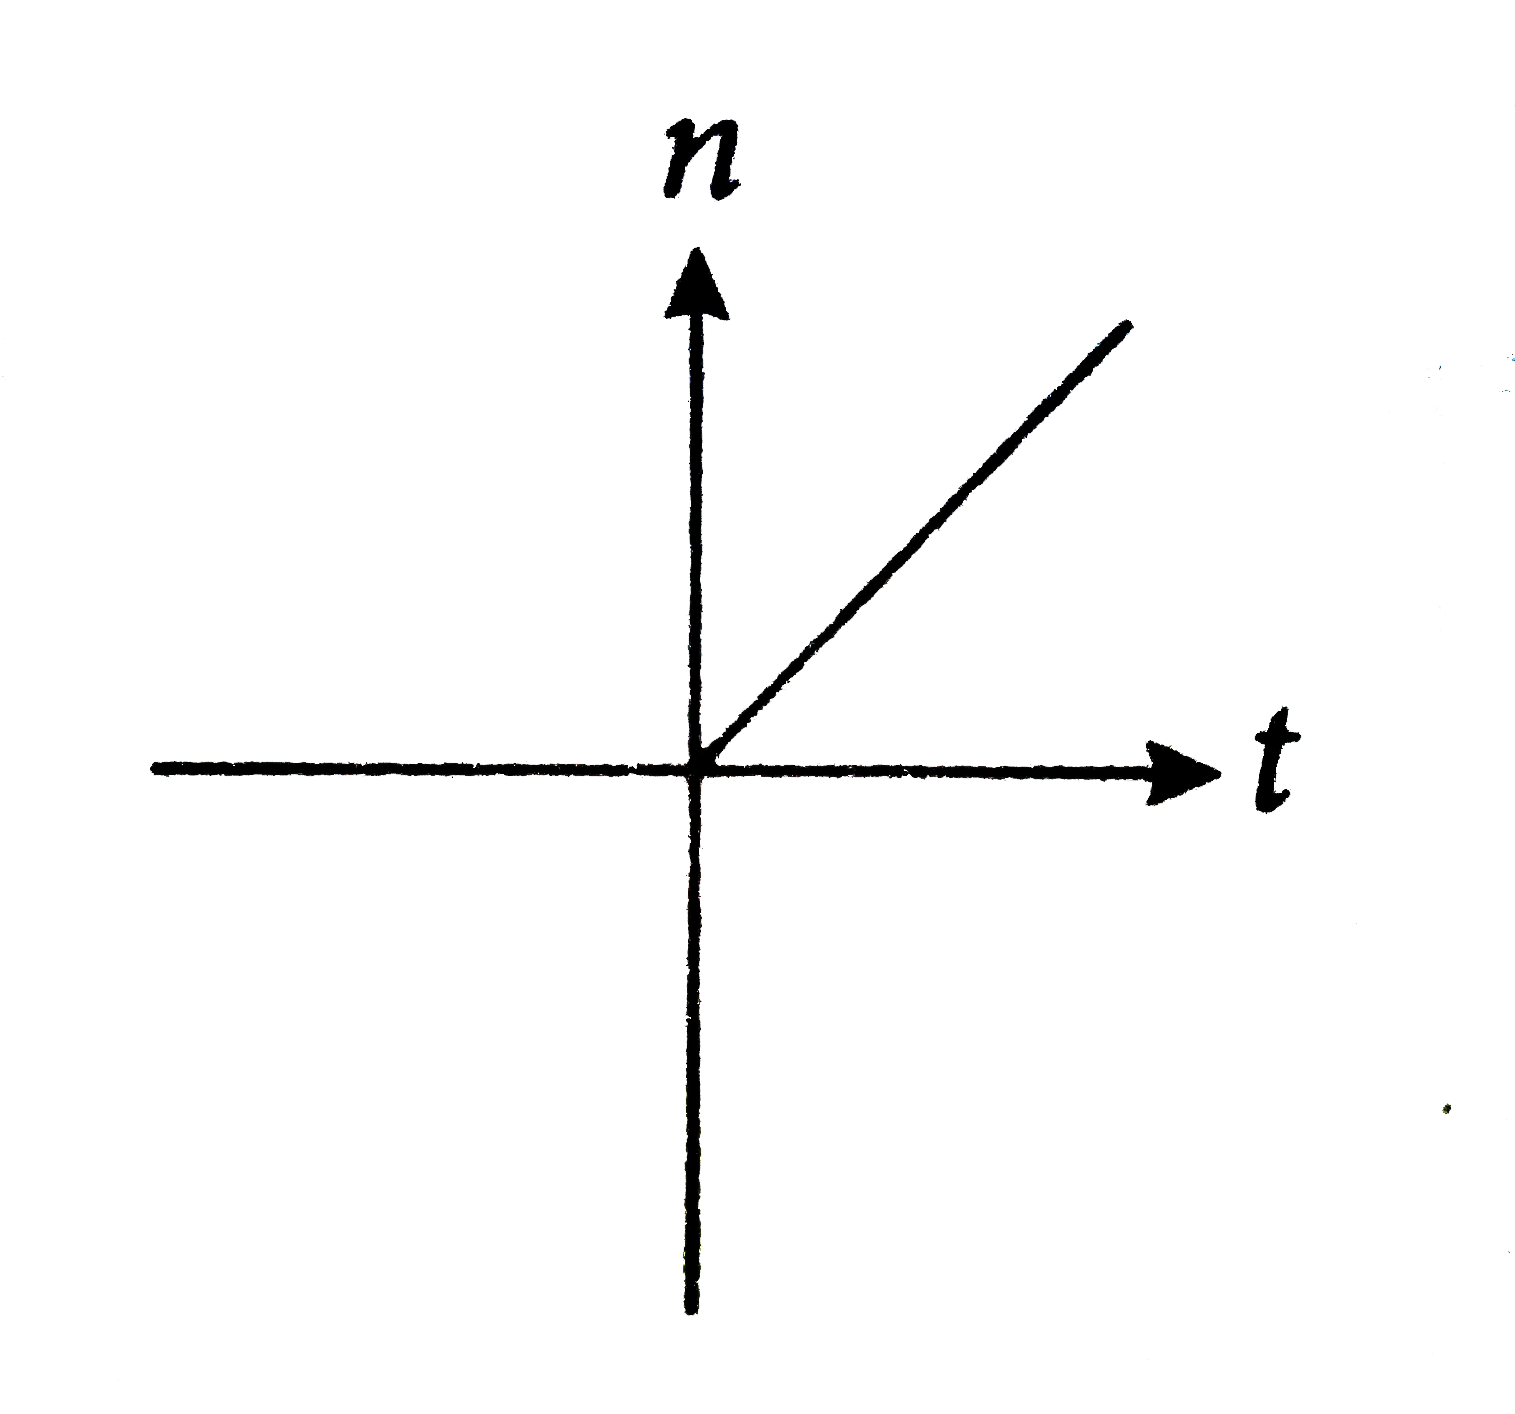 D
D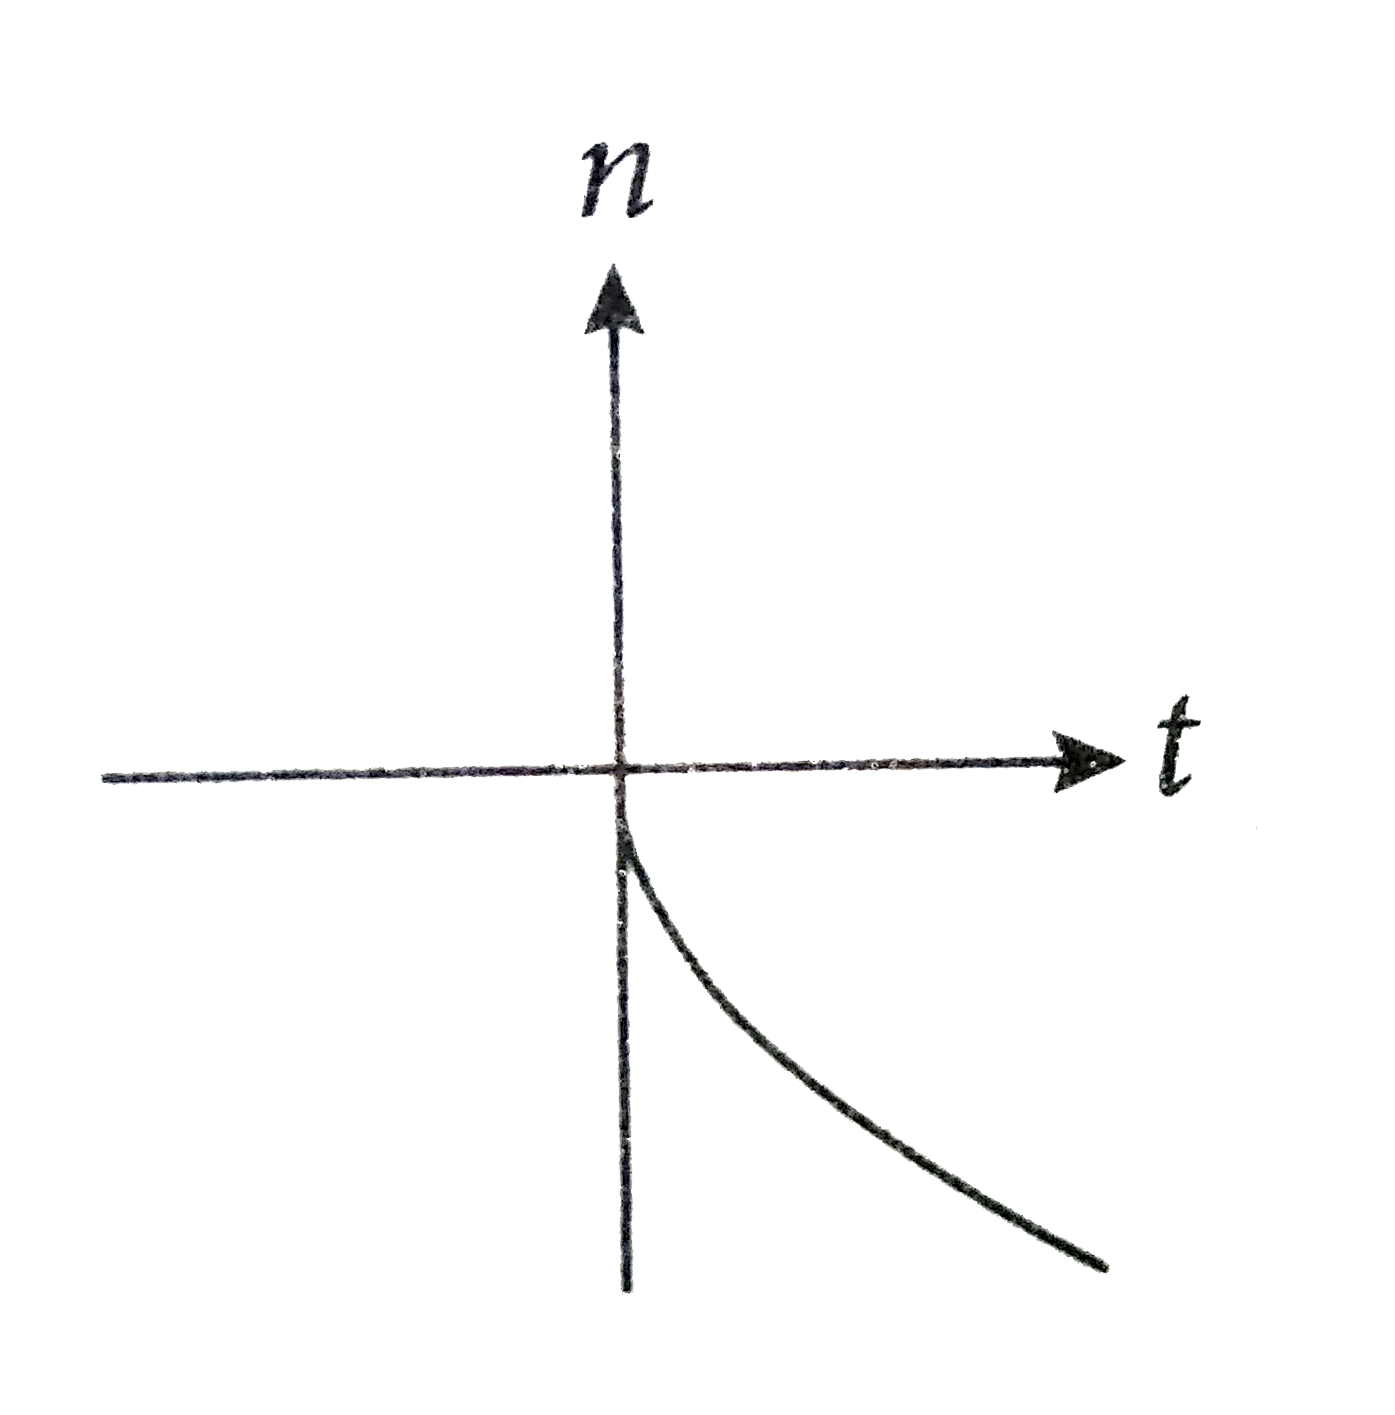
Carrie's Chocolate shop and Tamika's Treat Shop both sell cadny in boxes. The table below lists the price (the total amount the customer pays) of each box of candy sold at the shops. For each shop, there is a linear relationship between the price of a box of candies and the number of candies in the box. These are the only numbers of candies that can be purchased at the shops.
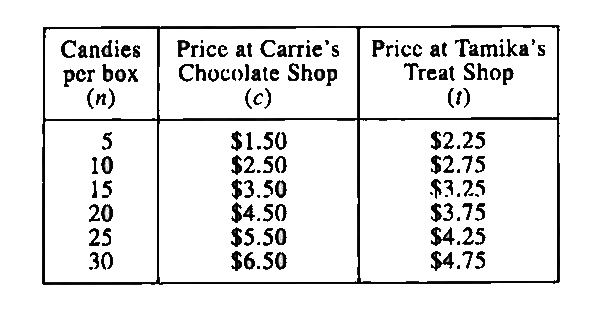
Which of the following equation gives the relationship between the price in dollars , c, and the number of candies ,n, in a box of cadies at carrie's chocolate shop ?
View Solution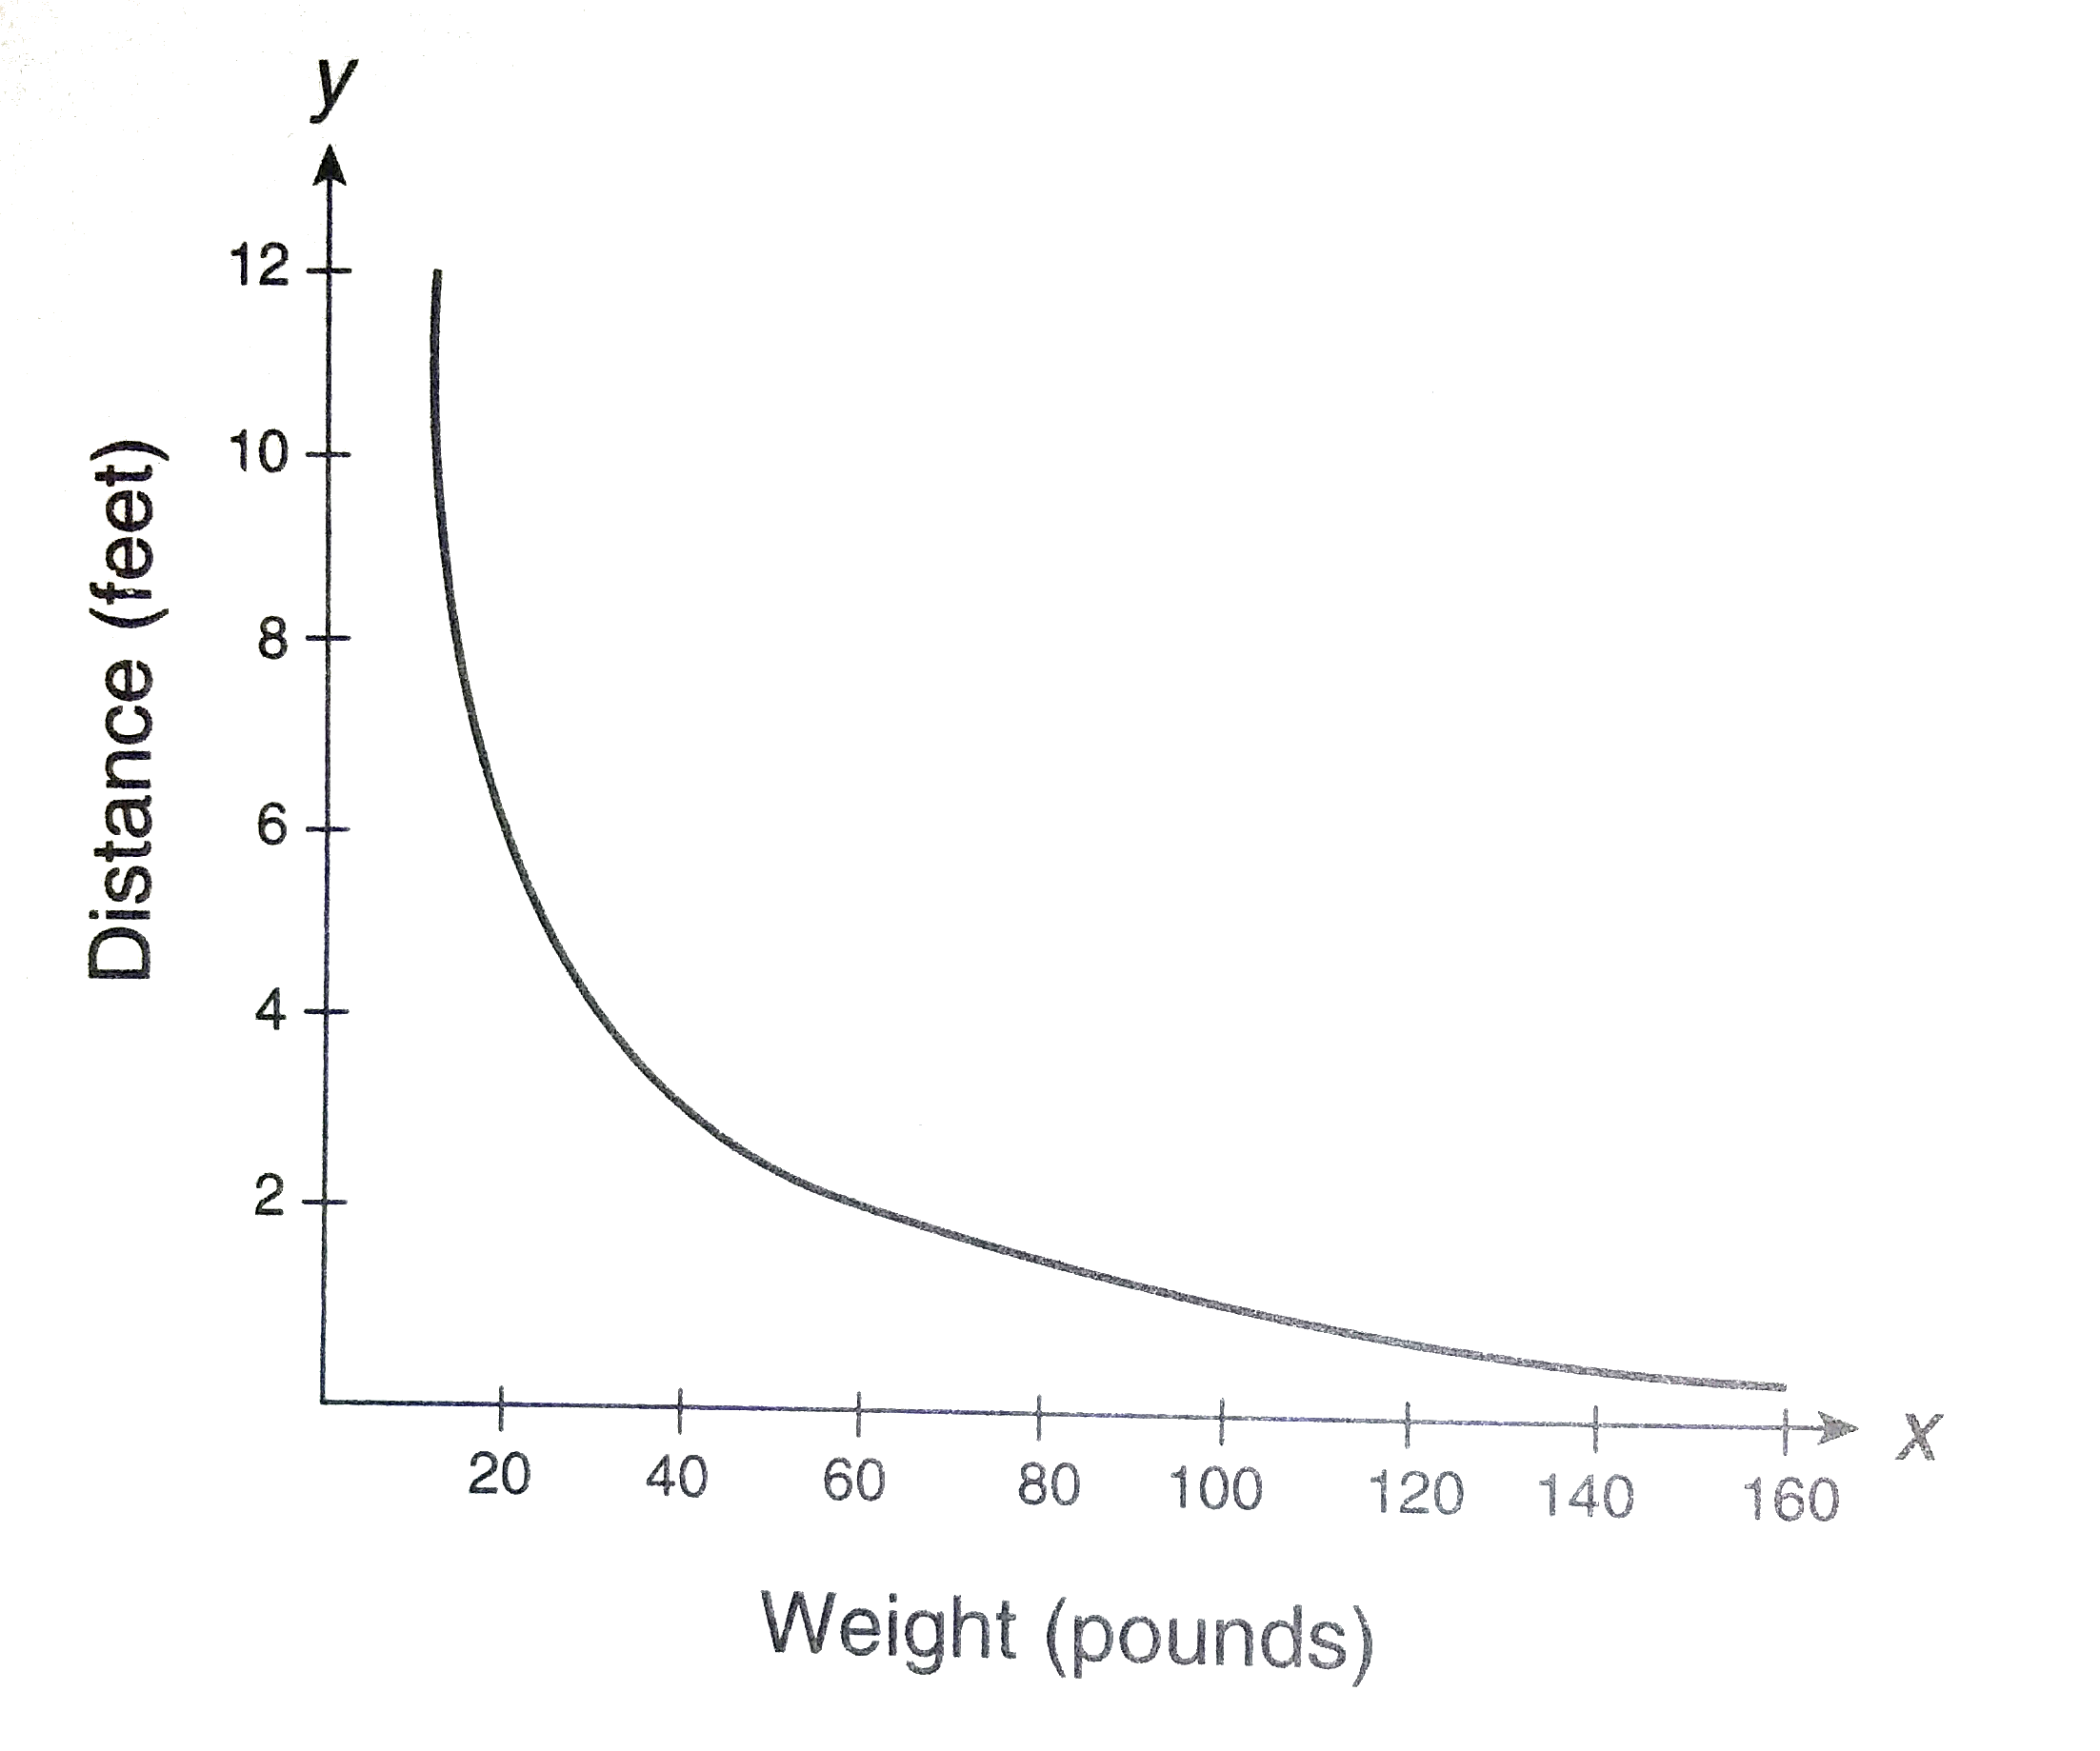
The graph above shows the relationship between a person's weight and the distance that the person must sit from the center of seesaw to make it balanced. Which of the following best represents the equation of this graph?
View SolutionWhich type of tournament is best if there are a large number of teams participating?
View Solution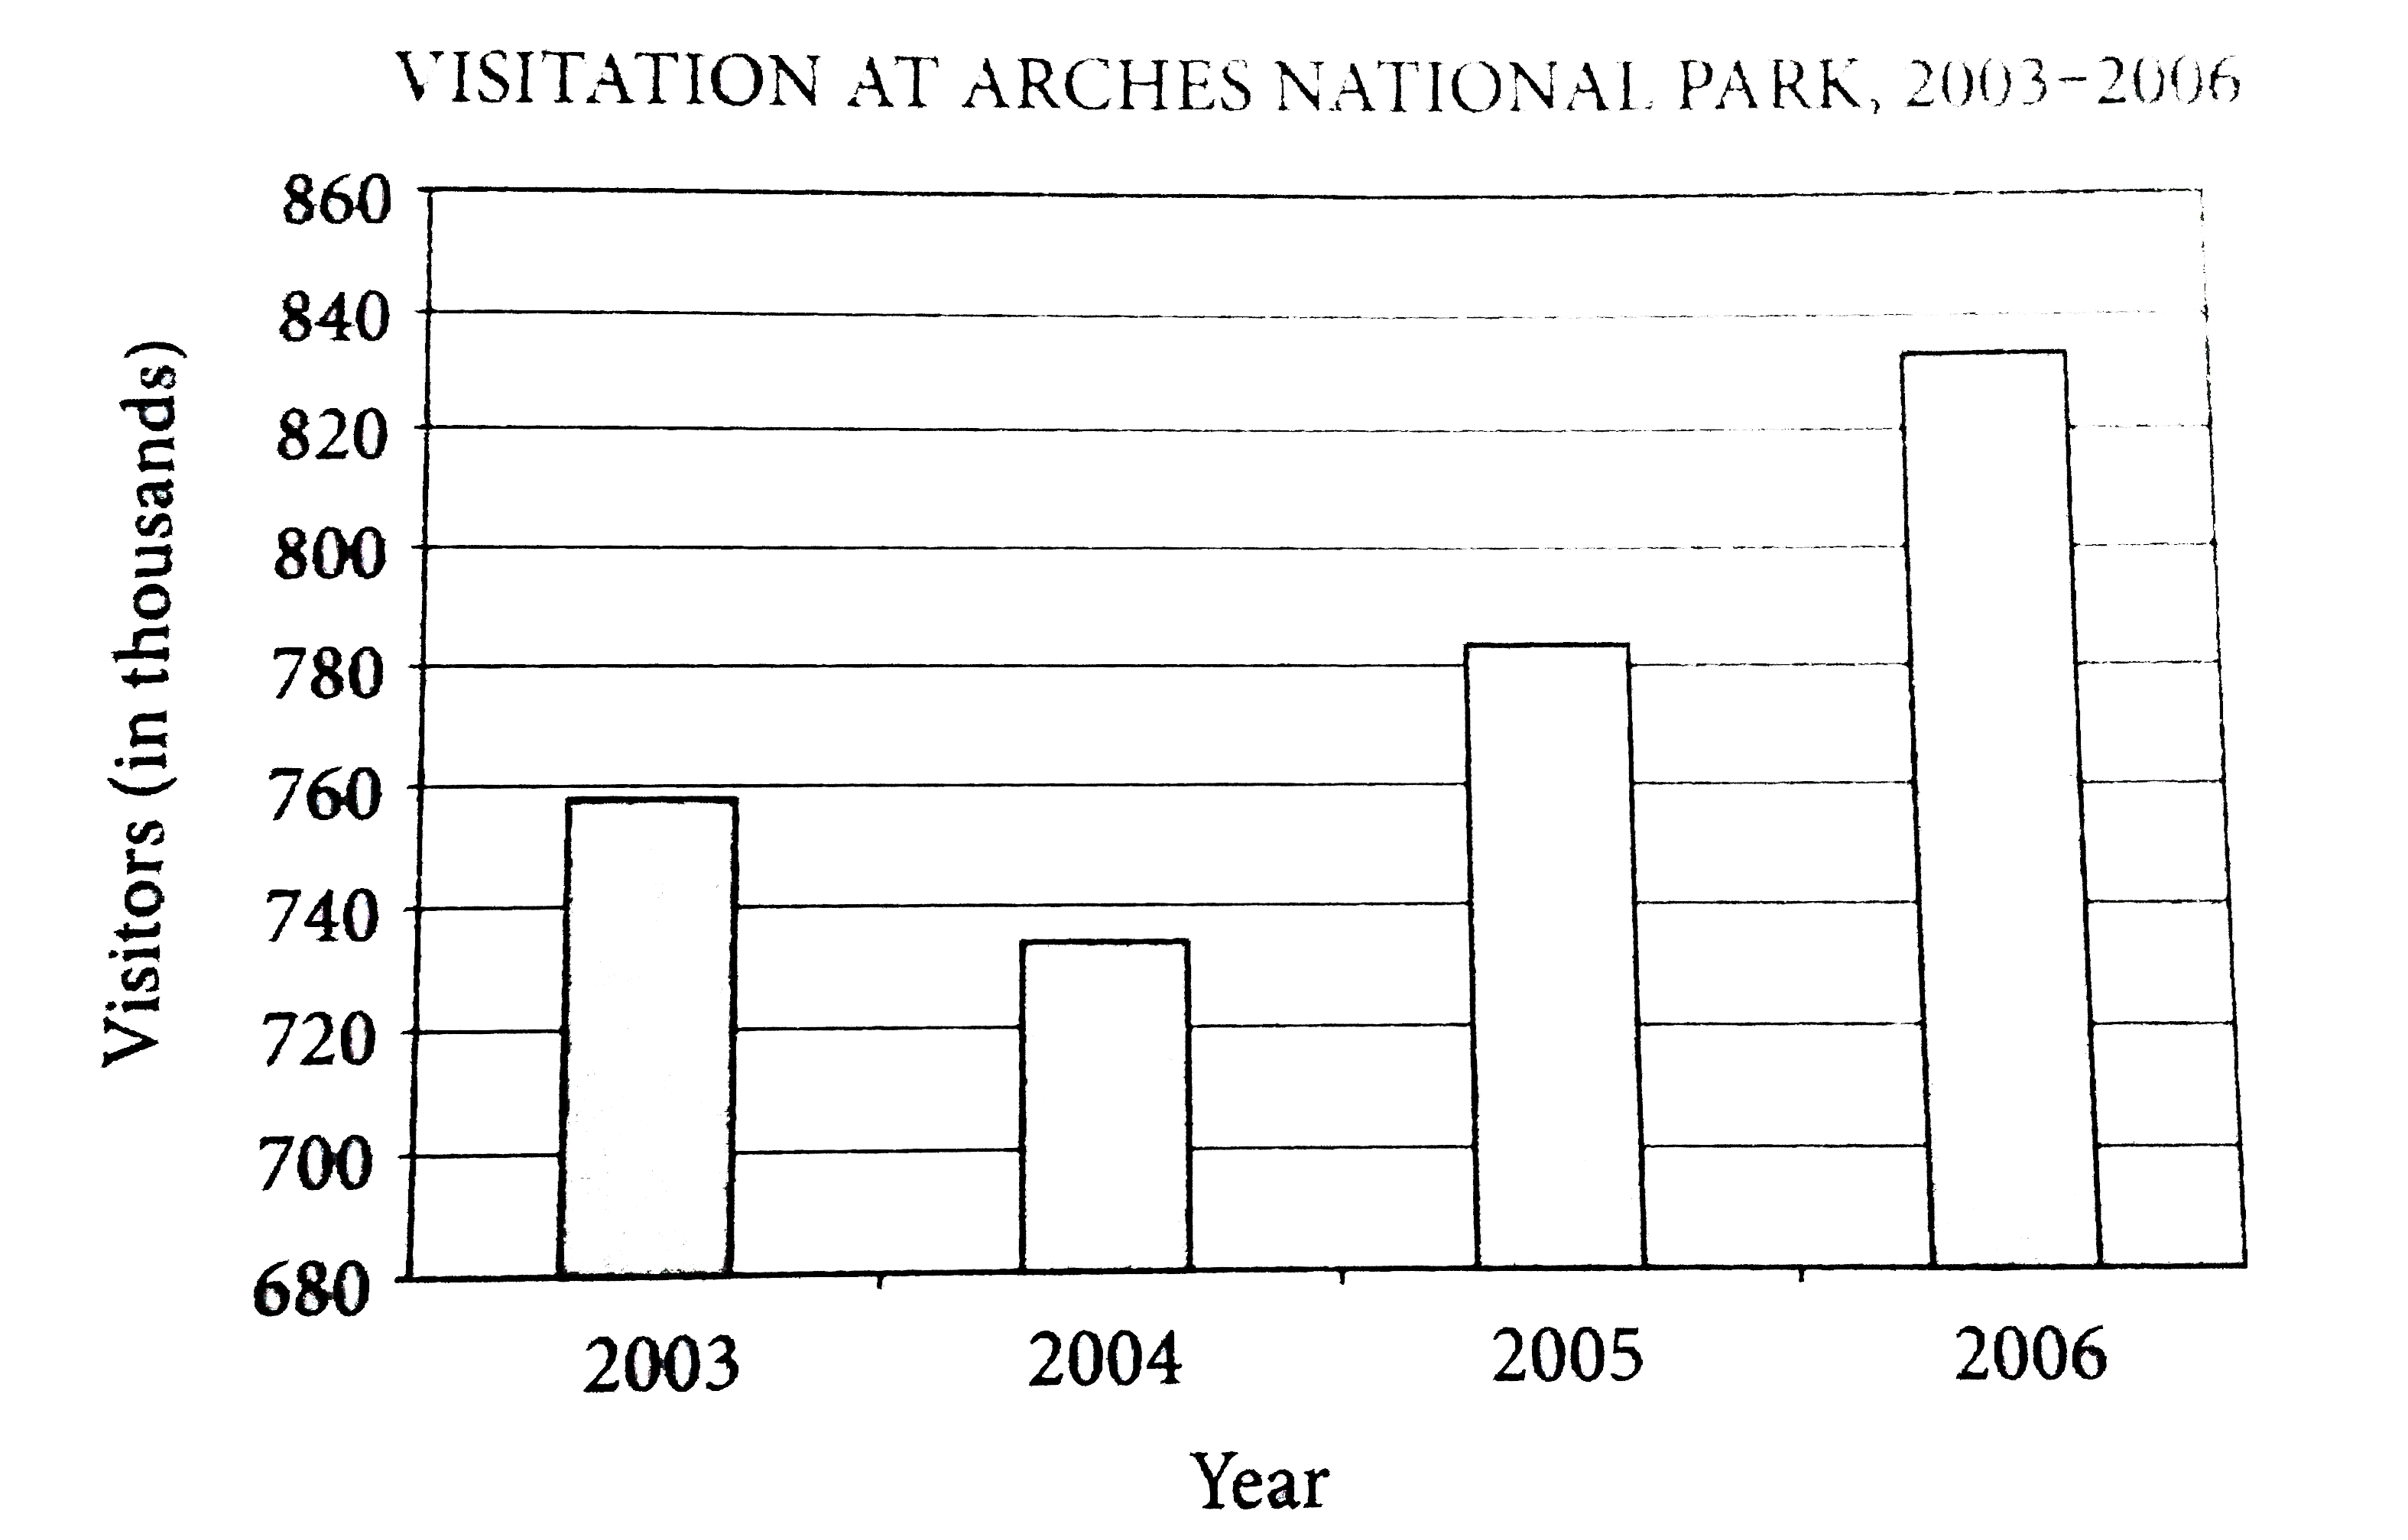
The chart above shows the number of visits, in thousands, at Arches National park for the years 2003 to 2006. Which of the following is the closest approximation of the percent increase in the number of visits from 2004 to 2006?
View SolutionThe table below shows the numbers of rows and columns in each of 5 matrices.
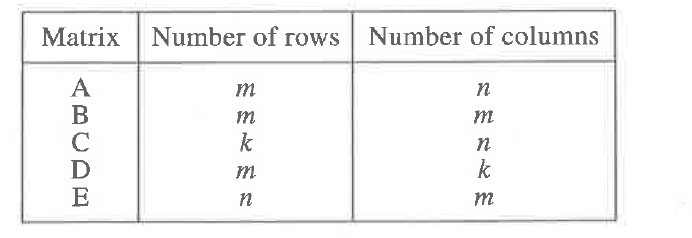
For distinct values of k, m, and n, which of the following matrix products is NOT possible?
View Solution