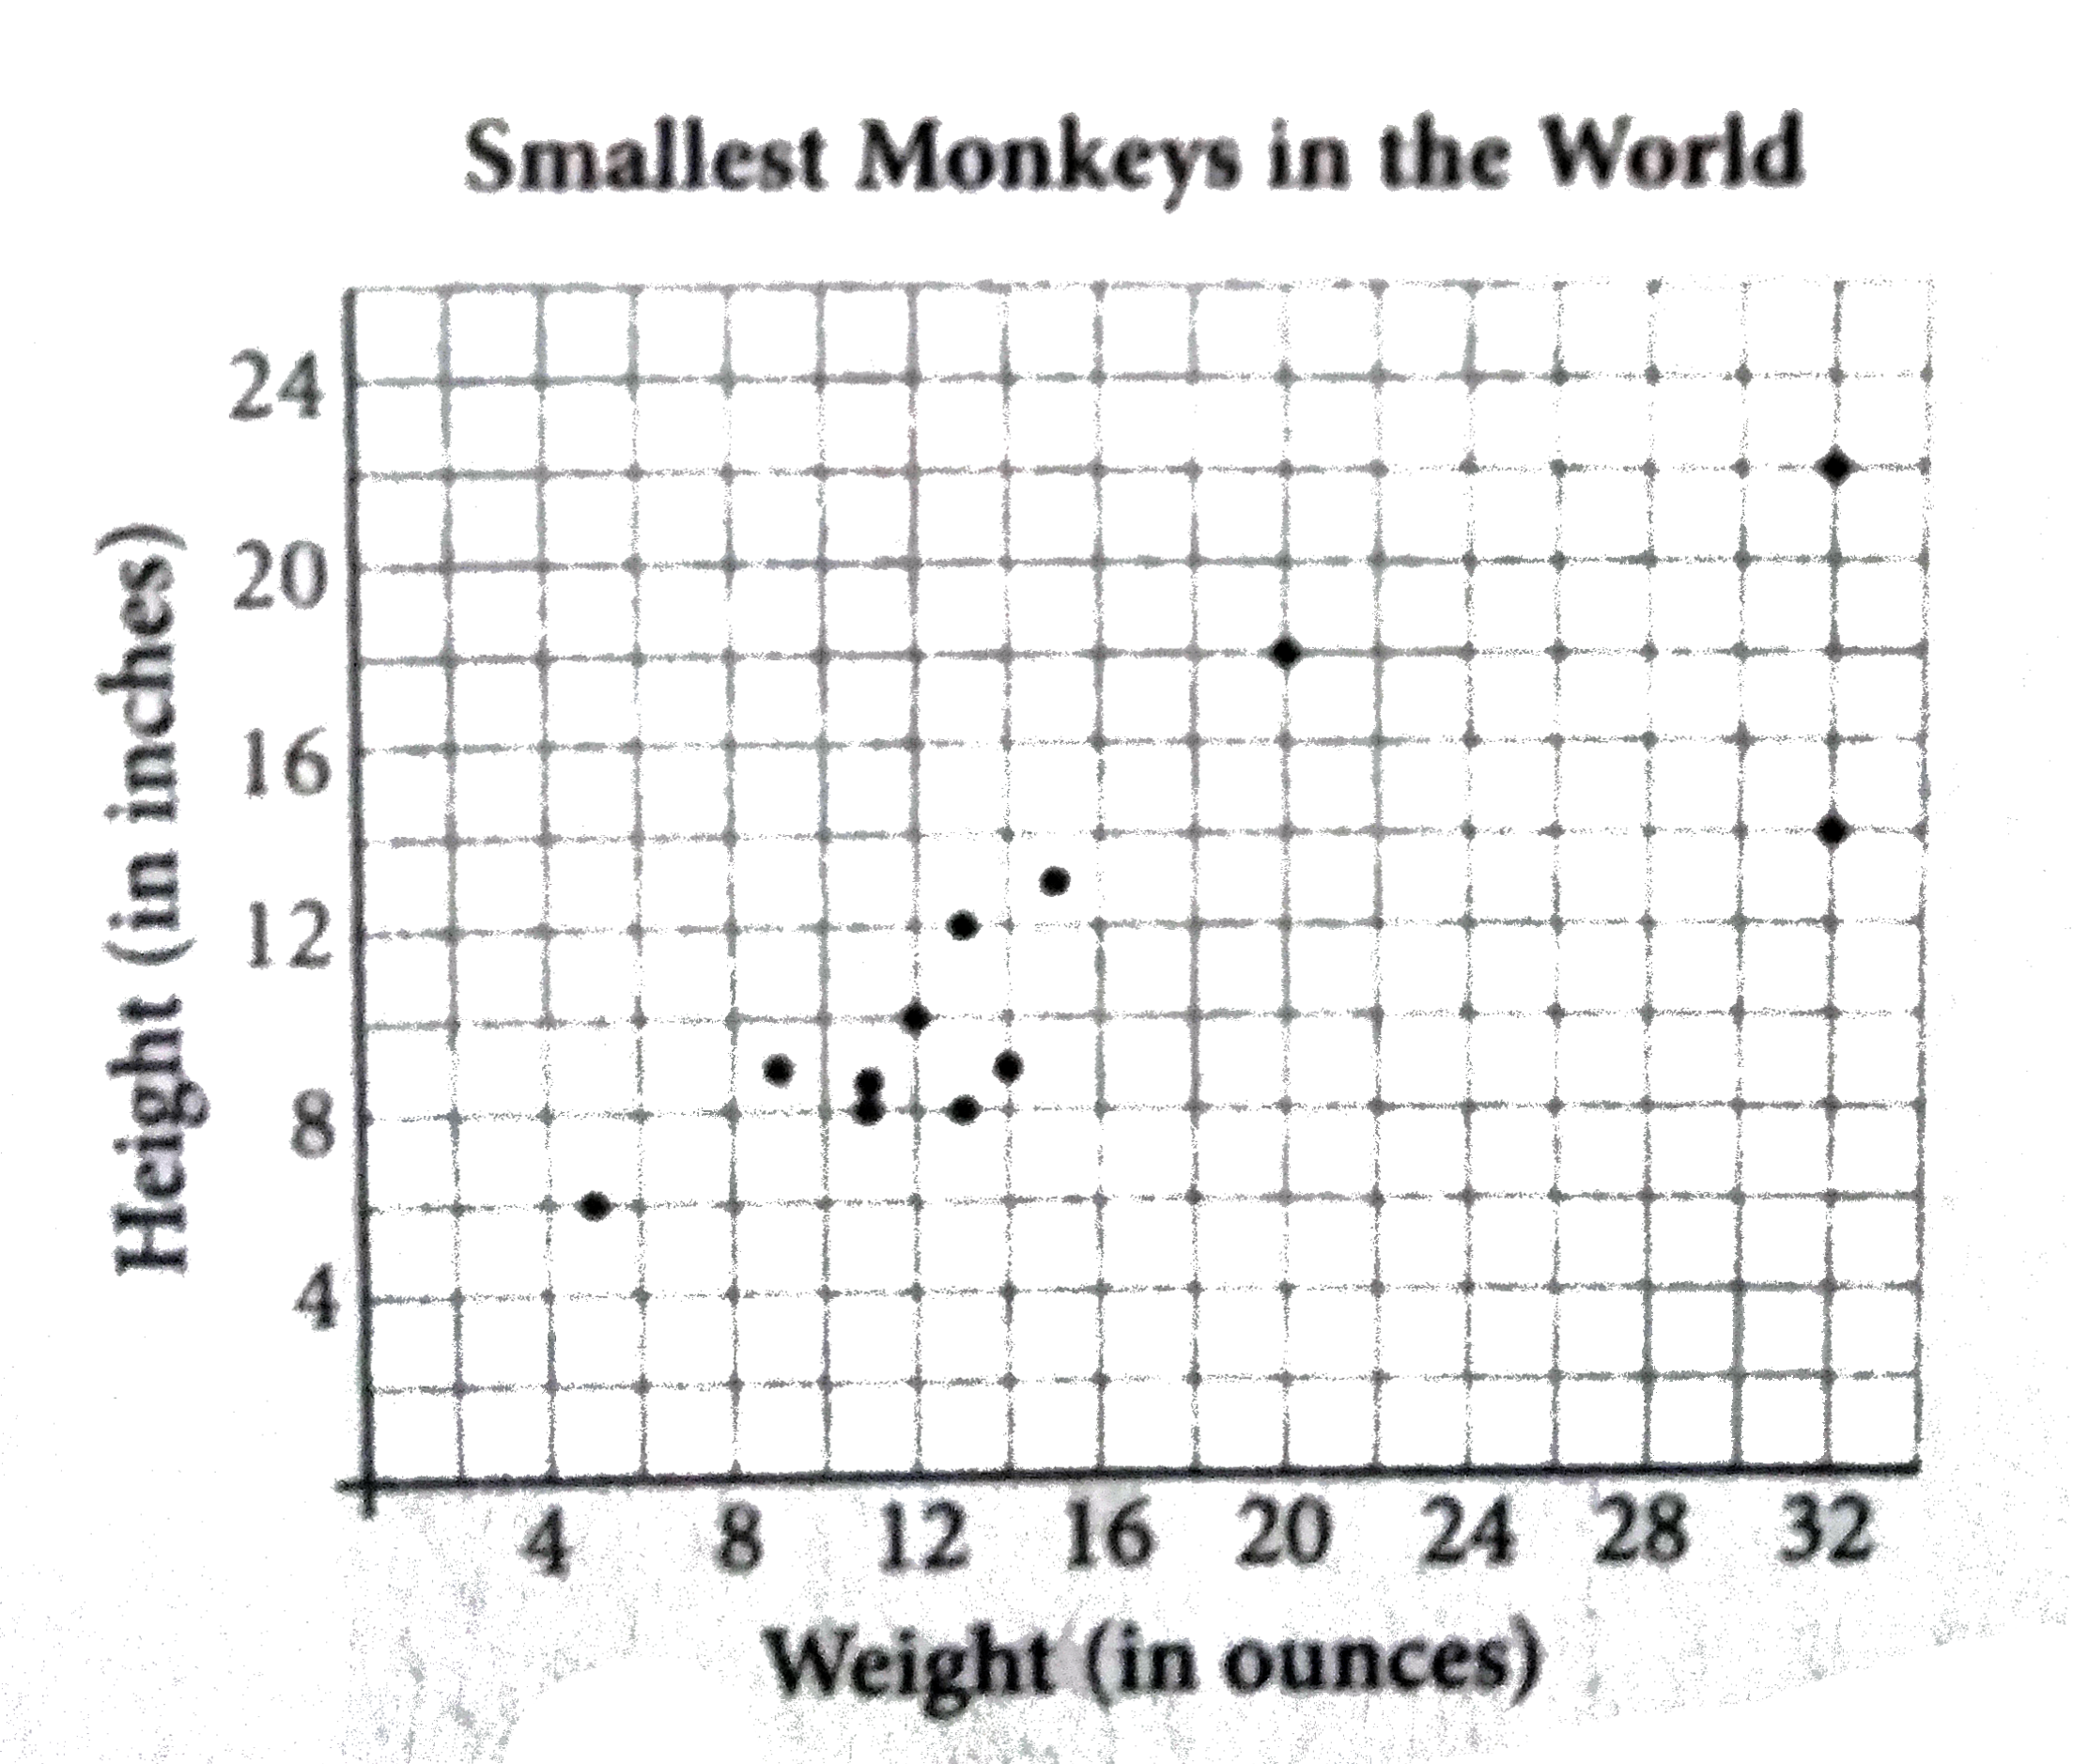
There are more than 250 known species of monkeys in the world. The scatterplot above shows the average height and weight of 12 species of particularly small monkeys, most of the which live in the Amazon Basin of South America. What is the height, in inches, of the monkeys represented by the data point that is farthest from the line of best fit (not shown)?
The correct Answer is:14 inches
Difficult: Medium
Category: Problem Solving and Data Analysis/ Scatterplots
Strategic Advice: When working with scatterplot,a line of best fit should be drawn so that about half the data points are above the line and half are below the line.
Getting to the Answer: Draw in the line of best fit. It doesn't have to be prefect -you just need to get an idea of where it should be .
The data point that is farthest from the line is located at (32, 14). Height is plotted on the y-axis, so this data point represents a monkey that is 14 inches tall.
Topper's Solved these Questions
Similar Questions
An atchitect is working on a design for a solar power plant. While double-checking the blueprint, he realizes that he has made an error: The solar panels will not fit on the roof unless the dimensions of the roof are increased by 0.5%. Which of the following expresses this change in the dimensions of the roof as a fraction of the original dimensions?
View Solution
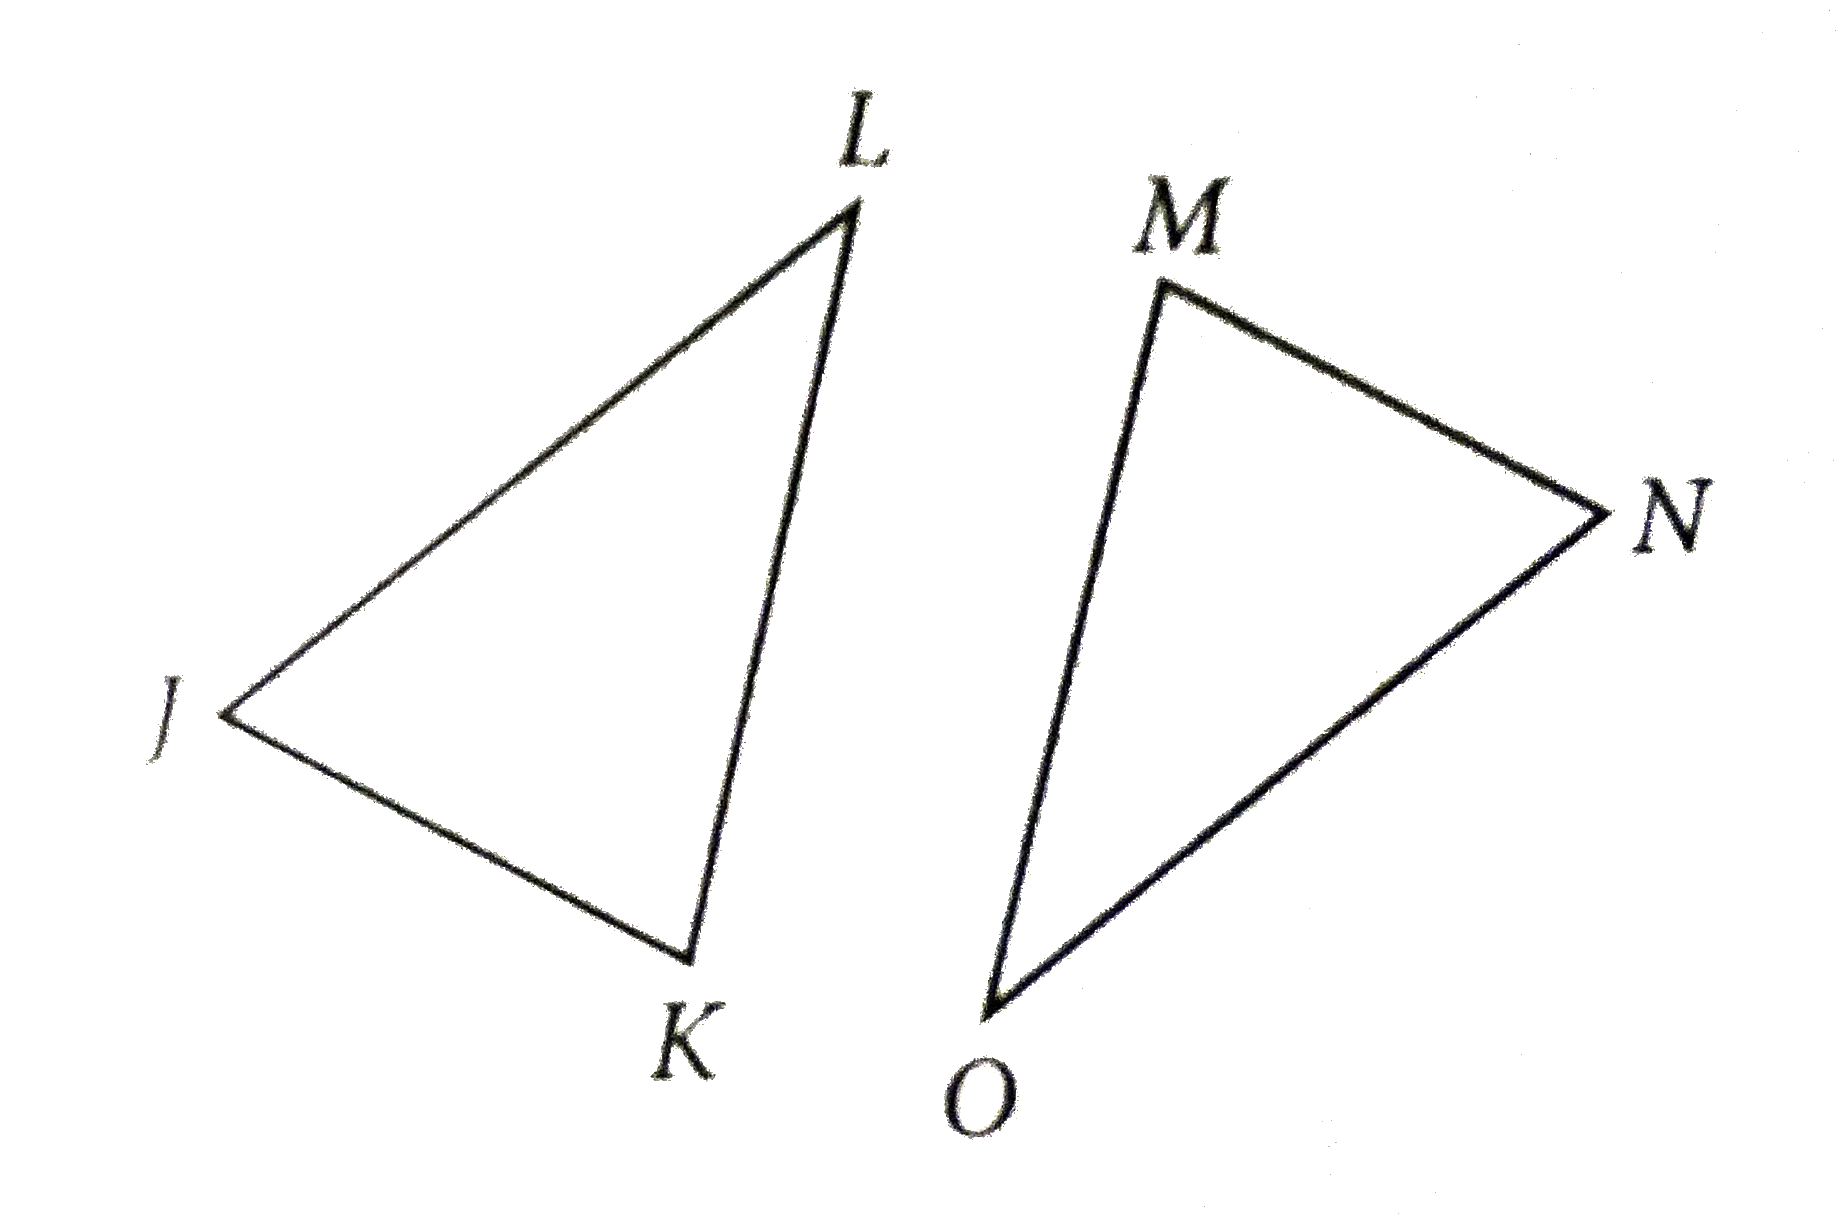
In the diagram above, ¯¯¯¯¯JL=¯¯¯¯¯¯ONand¯¯¯¯¯¯KL=¯¯¯¯¯¯¯OM. Confirmation of which of the following facts would be sufficient to prove that the two triangles are congruent?
View SolutionFrom the following data, using weighted average method, calculate the cost of living index for the year 2006, taking 2002 as the base year.
ltimg src="https://d10lpgp6xz60nq.cloudfront.net/physics_images/PS_MATH_IX_C18_E03_005_Q01.png" width="80%"gt
View SolutionHow many lines of symmetry does the above figure have ?
View SolutionWhich of the following are correct chain isomers of butane ? (i)
View SolutionDetermine the point of symmetry of a regular hexagon.
View SolutionDtermine the images of the following figure about the given line :
View SolutionMatch the following Column A to Column B

View SolutionMatch the following Column A to Column B

View SolutionMatch the following Column A to Column B

View SolutionThe inequation represented by the graph given below is :
View SolutionThe inequation that best describes the graph given below is _________
View SolutionThe inequation that best describes the following graph is _________
View SolutionWhich inequations represent the shaded region in the given figure
View SolutionThe equation of straight line shown in figure is :
ltimg src="https://d10lpgp6xz60nq.cloudfront.net/physics_images/ALN_PHY_R04_E01_020_Q01.png" width="80%"gt
View Solution
