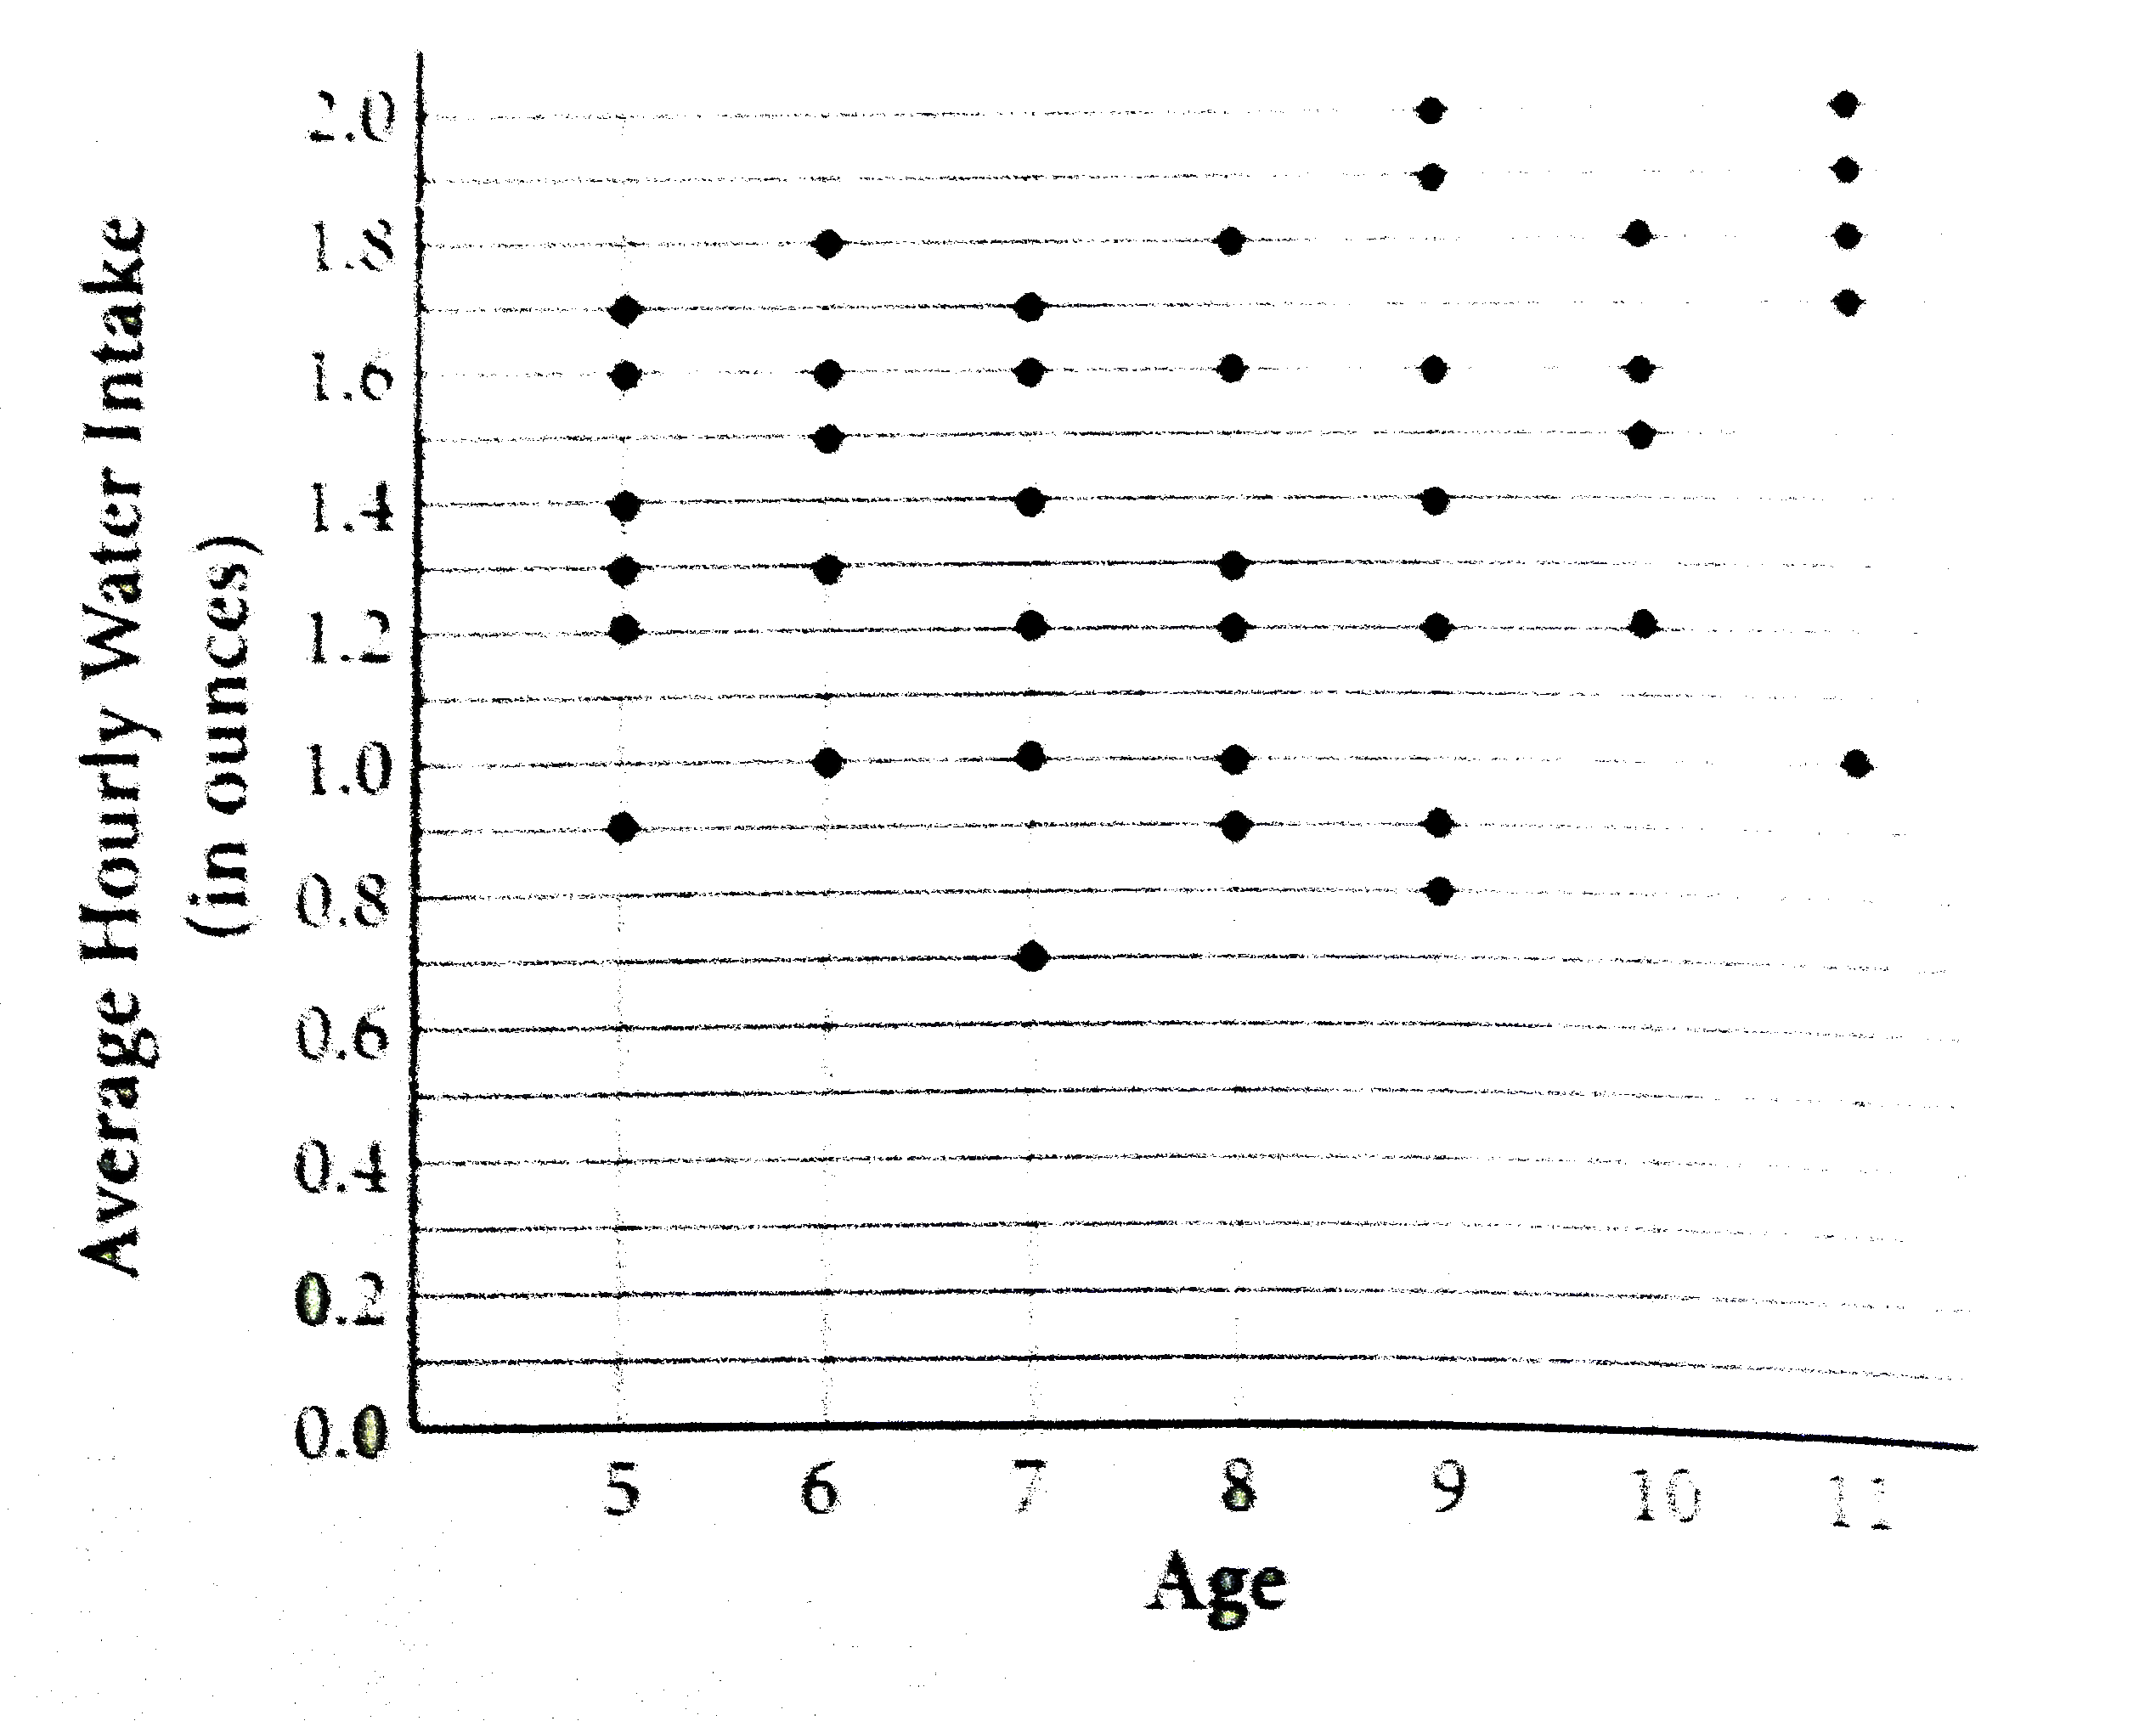
A dietician working in the childrens ward at a hospital is monitoring the water intake of all the patients in the ward. The total water intake for each patient is recorded throughout the day and then averaged over the 24-hour period. The results are recorded in the scatterplot, where each dot represents the average hourly water intake for one child. 
Q.Which of the following ages has the greatest range of values for the average hourly water intake?
A
Age 5
B
Age 6
C
Age 8
D
Age 11
Video Solution
Text Solution
The correct Answer is:D
Difficult: Medium
Category: Problem Solving and Data Analysis/ Scatterplots
Strategic Advice: The range of a value set is the largest value minus the smallest value. In this question, you are comparing the ranges for each age, not for the whole data set.
Getting to the Answer: Read the axis labels carefully. Average hourly water intake is plotted along the vertical axis, and each grib-line represents 0.1. Estimate the y-coordinate of the lowest point and highest point for each of the ages given in the answer choices. (Don't waste times calculating the range for all the ages plottedf along the horizontla axis). The, subtract to find the range for each age:
Age5: highest=1.7, lowest=0.9, difference=0.8
Age6: highest=1.8, lowest=1.0, difference=0.8
Age8: highest=2.0, lowest=0.9, difference=0.9
Age11: highest=2.0, lowest=1.0, difference=1.0
The greatest difference is 1.0 (age 11), so (D) is correct.
|
Topper's Solved these Questions
Similar Questions
Knowledge Check
If Edna drove s miles in t hours, which of the following represents her average speed, in miles per hour?
AstBtsC1stDst
Write the masses in grams of one mole of each of the following:
water
View SolutionWhich one of the following reactions represents water − gas shift reaction ?
View SolutionExcessive intake of alcohol causes
View SolutionIntake of small quantity of methanol can be lethal. Comment.
View SolutionIn diabetes mellitus the patient drink more water as there is urinary loss of
View SolutionIn diabetes mellitus the patient drink more water as there is urinary loss of
View SolutionExpress the daily intake of a human adult in kiloc alorie
View Solution
