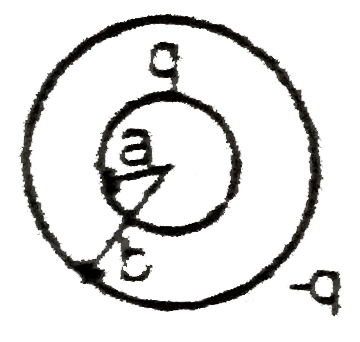
Figure shows two concentric shells of radii a and b uniformly distributed charges q and -q. Which of the following graphs gives correct variation of electric field intensity E with the distance r from the centre?
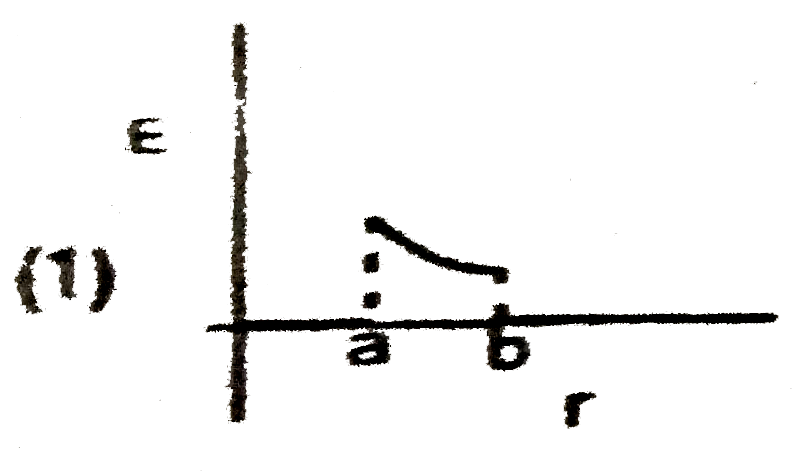
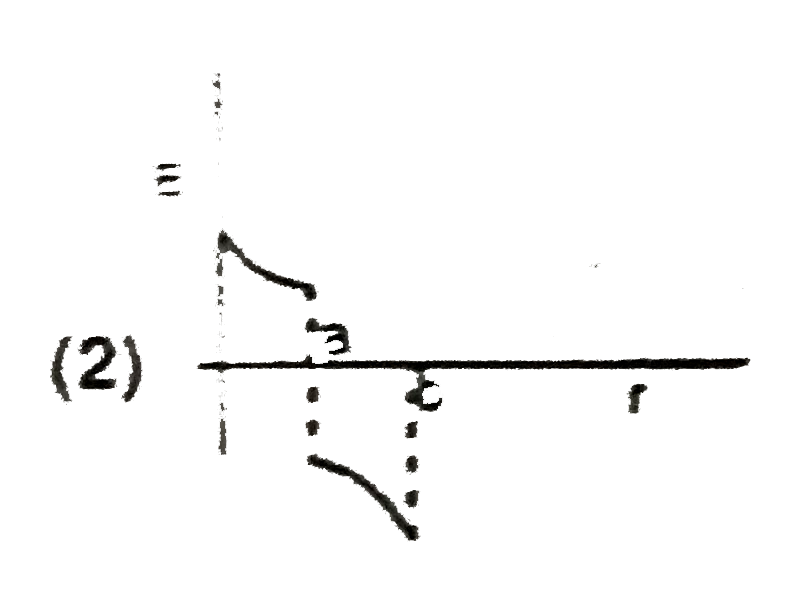
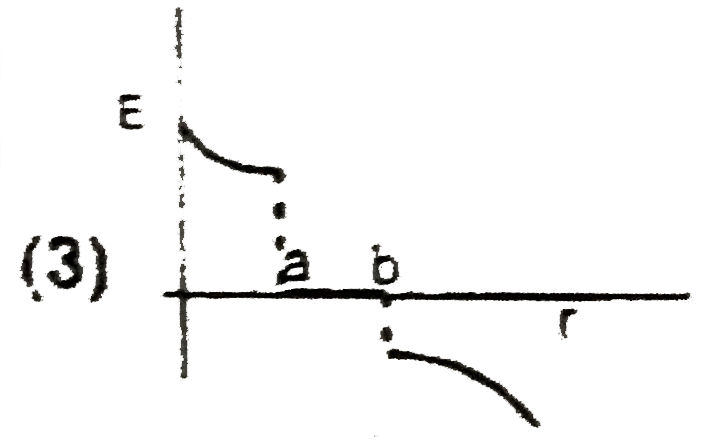
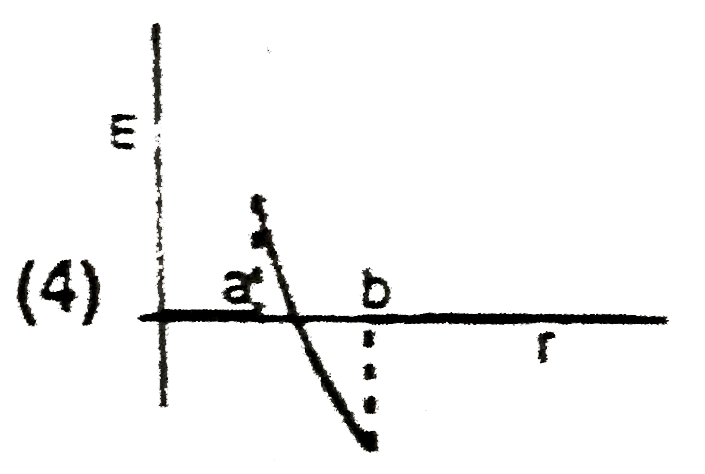
The correct Answer is:A
Step by step video, text & image solution for Figure shows two concentric shells of radii a and b uniformly distributed charges q and -q. Which of the following graphs gives correct variation of electric field intensity E with the distance r from the centre? by Physics experts to help you in doubts & scoring excellent marks in Class 11 exams.
Updated on:21/07/2023Topper's Solved these Questions
Similar Questions
Which one of the following graphs represents the variation of electric field with distance r from the centre of a charged spherical conductor of radius R?
View SolutionA hollow charged sphere of radius R has a constant surface charge density o. Of the following graphs the one, which shows the variation of the electric field strength E with distance X from the centre of the sphere is (A) E I=R x (B) E 1
View Solution
Knowledge Check
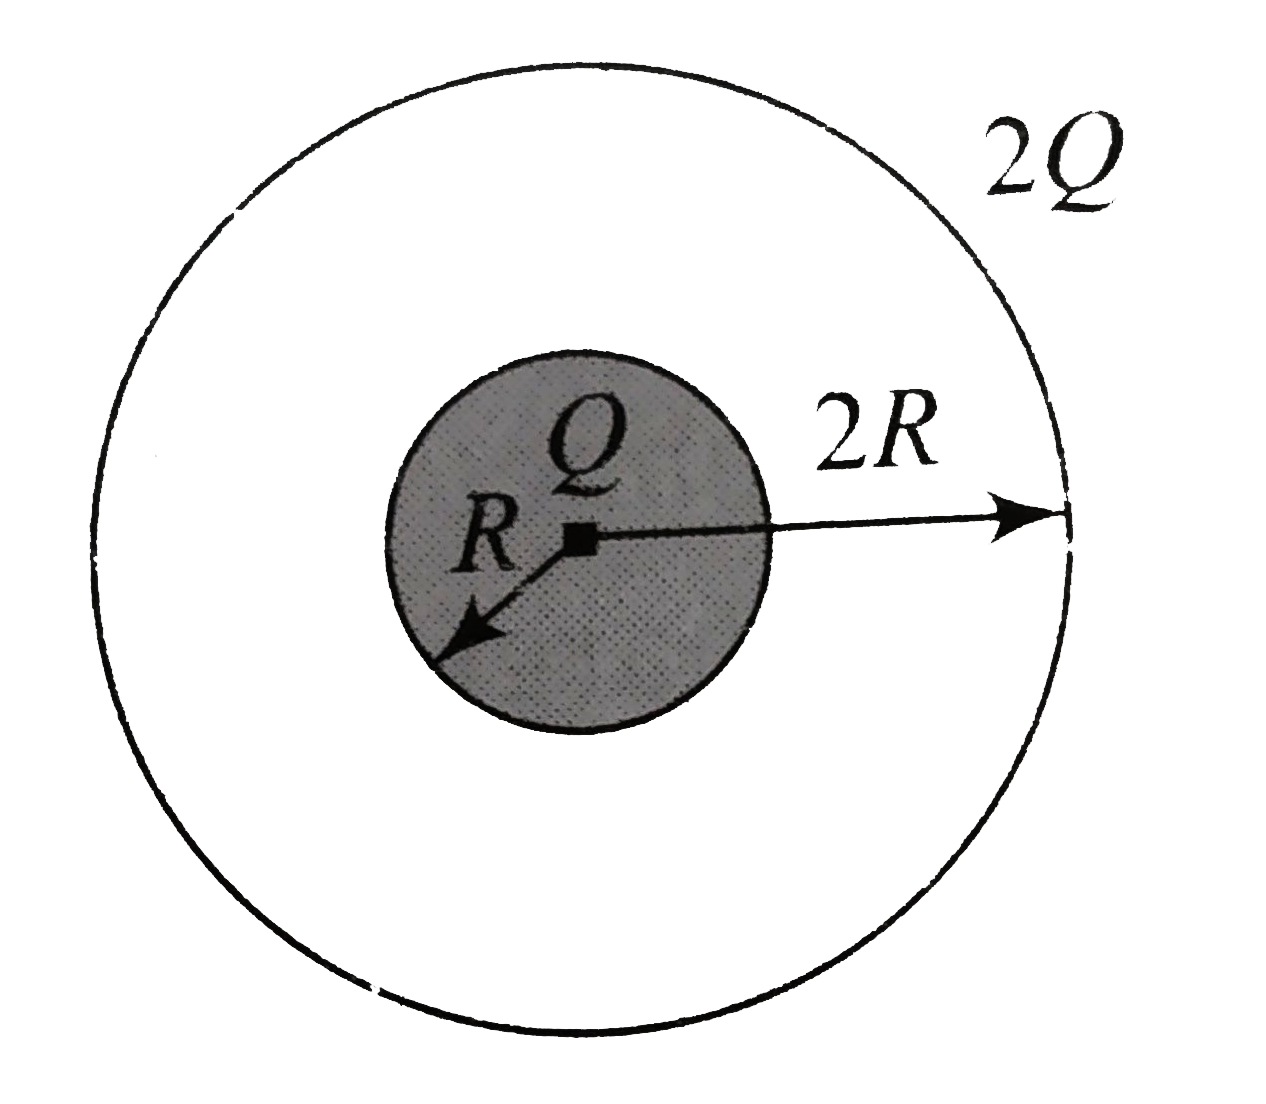
A charge Q is uniformly distributed in a dielectric sphere of radius R (having dielectric constant unity). This dielectric sphere is enclosed by a concentric spherical shell of radius 2R and having uniformly distributed charge 2Q. Which of the following graph correctly represents variation of electric field with distance r from the common centre?
 A
A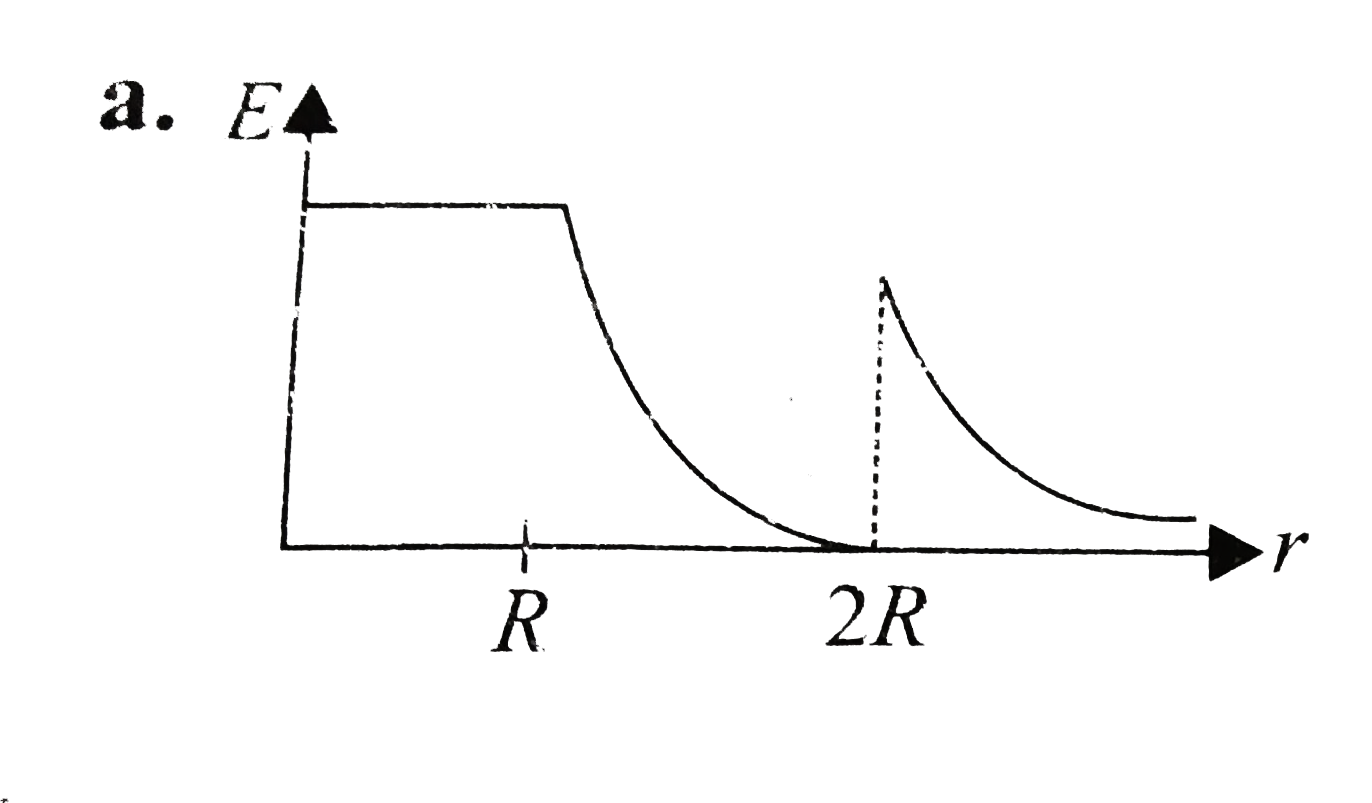 B
B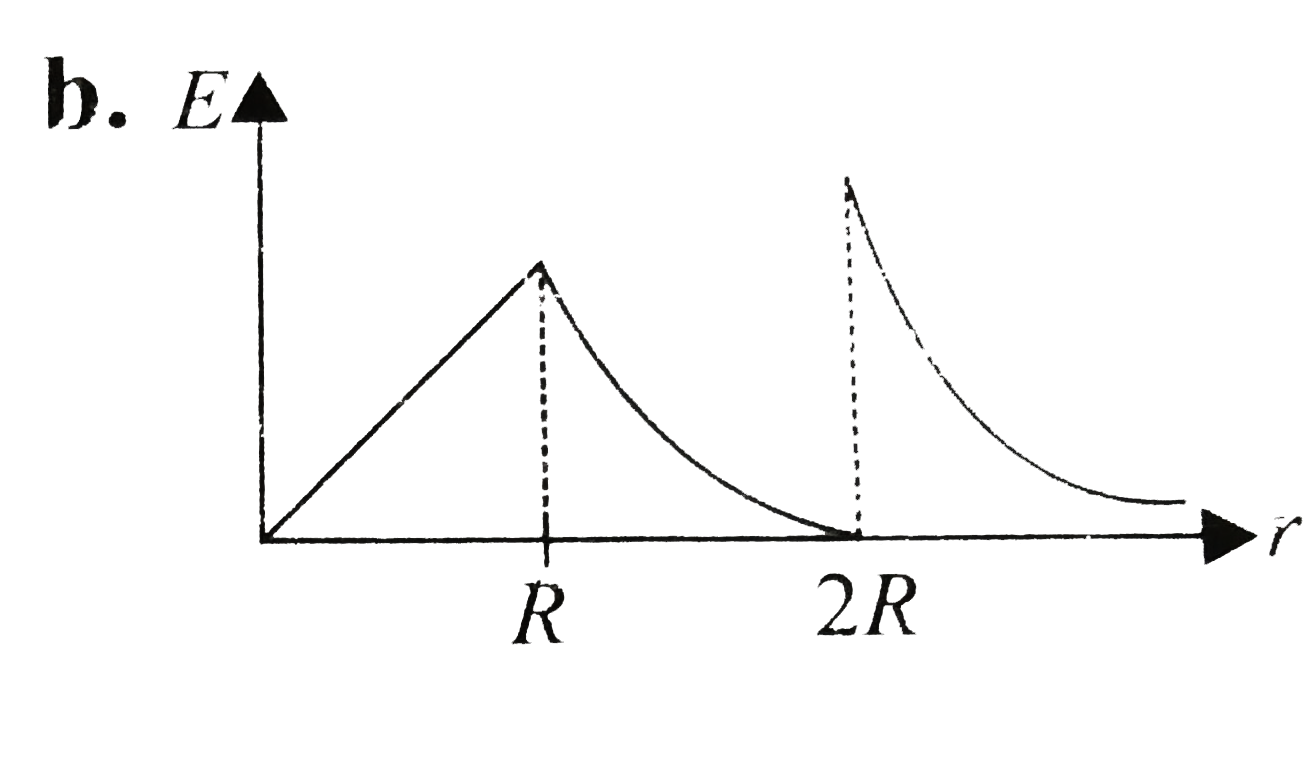 C
C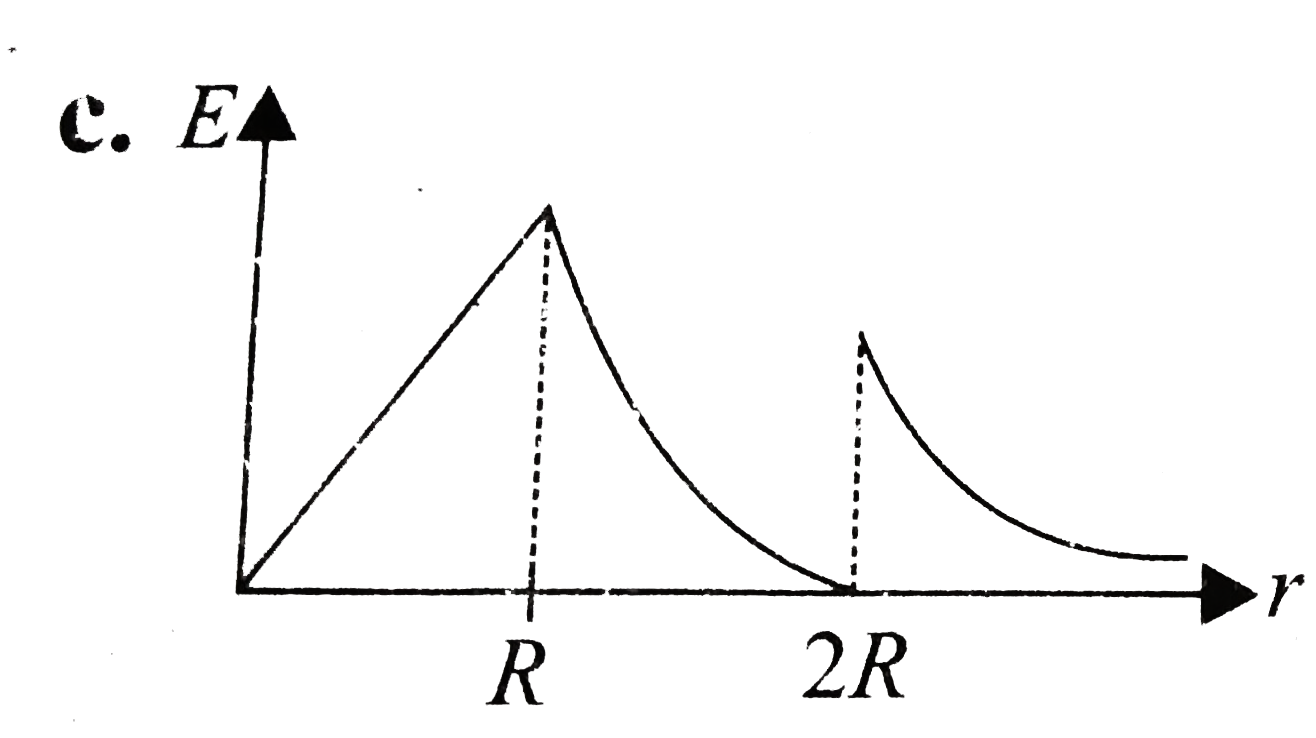 D
D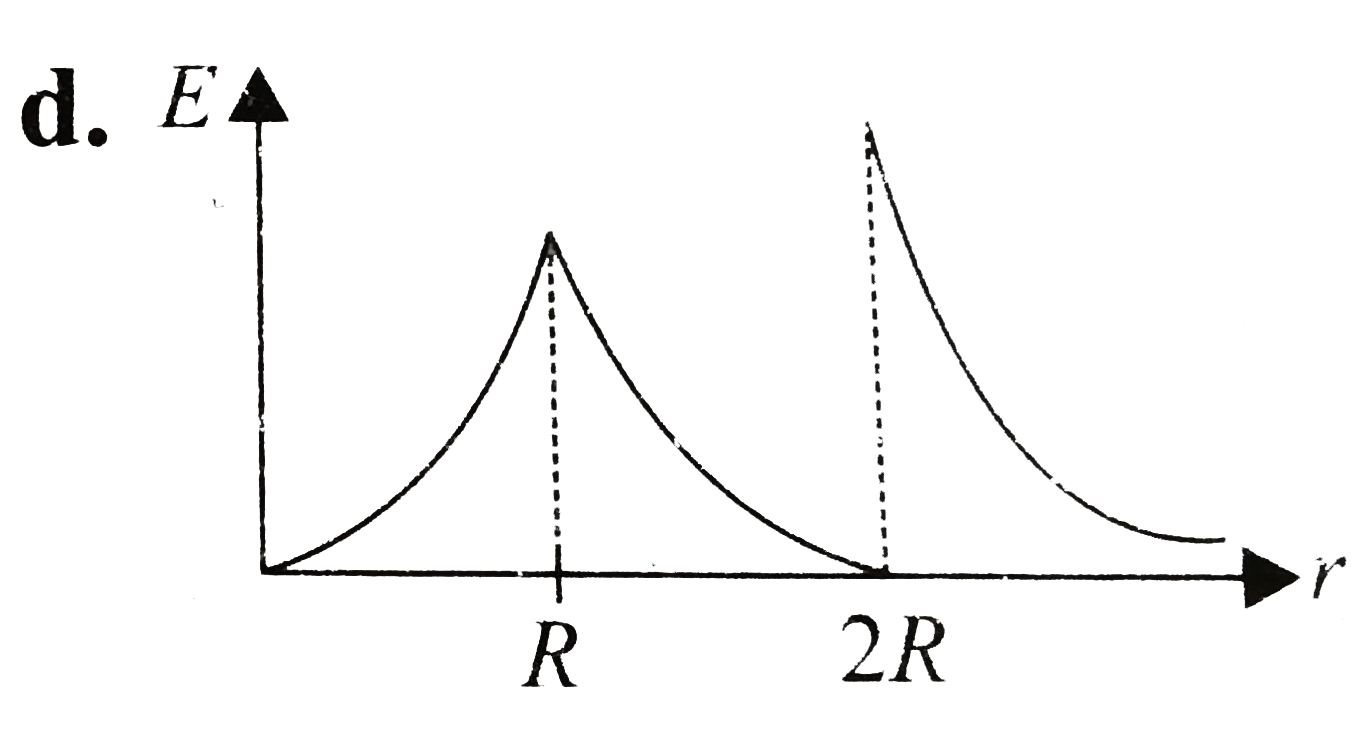
For a uniformly charged non conducting sphere of radius R which of following shows a correct graph between the electric field intensity and the distance from the centre of sphere –
A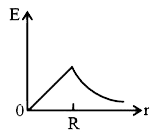 B
B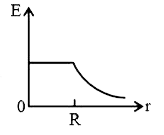 C
C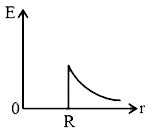 D
D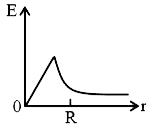
A spherical insulator of radius R is charged uniformly with a charge Q throughout its volume and contains a point charge Q16 located at its centre. Which of the following graphs best represents qualitatively, the variation of electric field intensity E with distance r from the centre?
A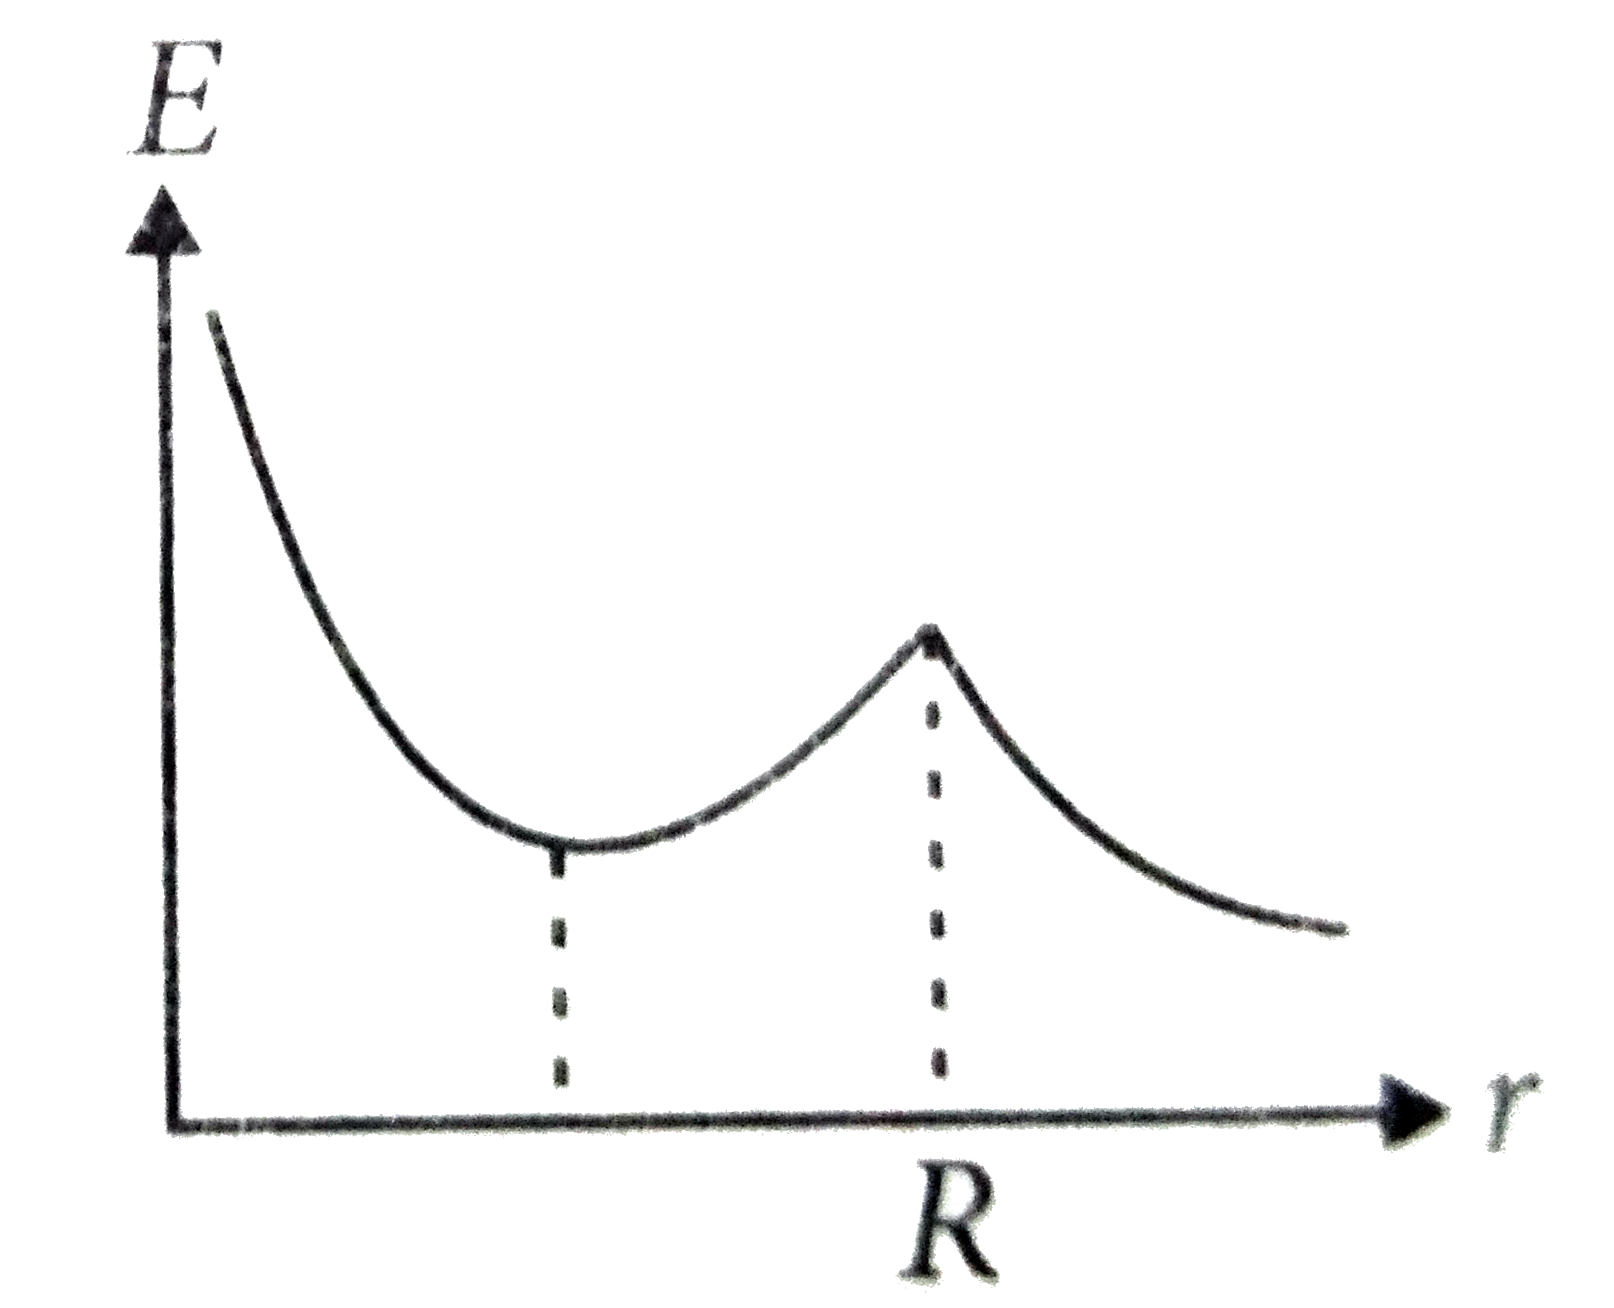 B
B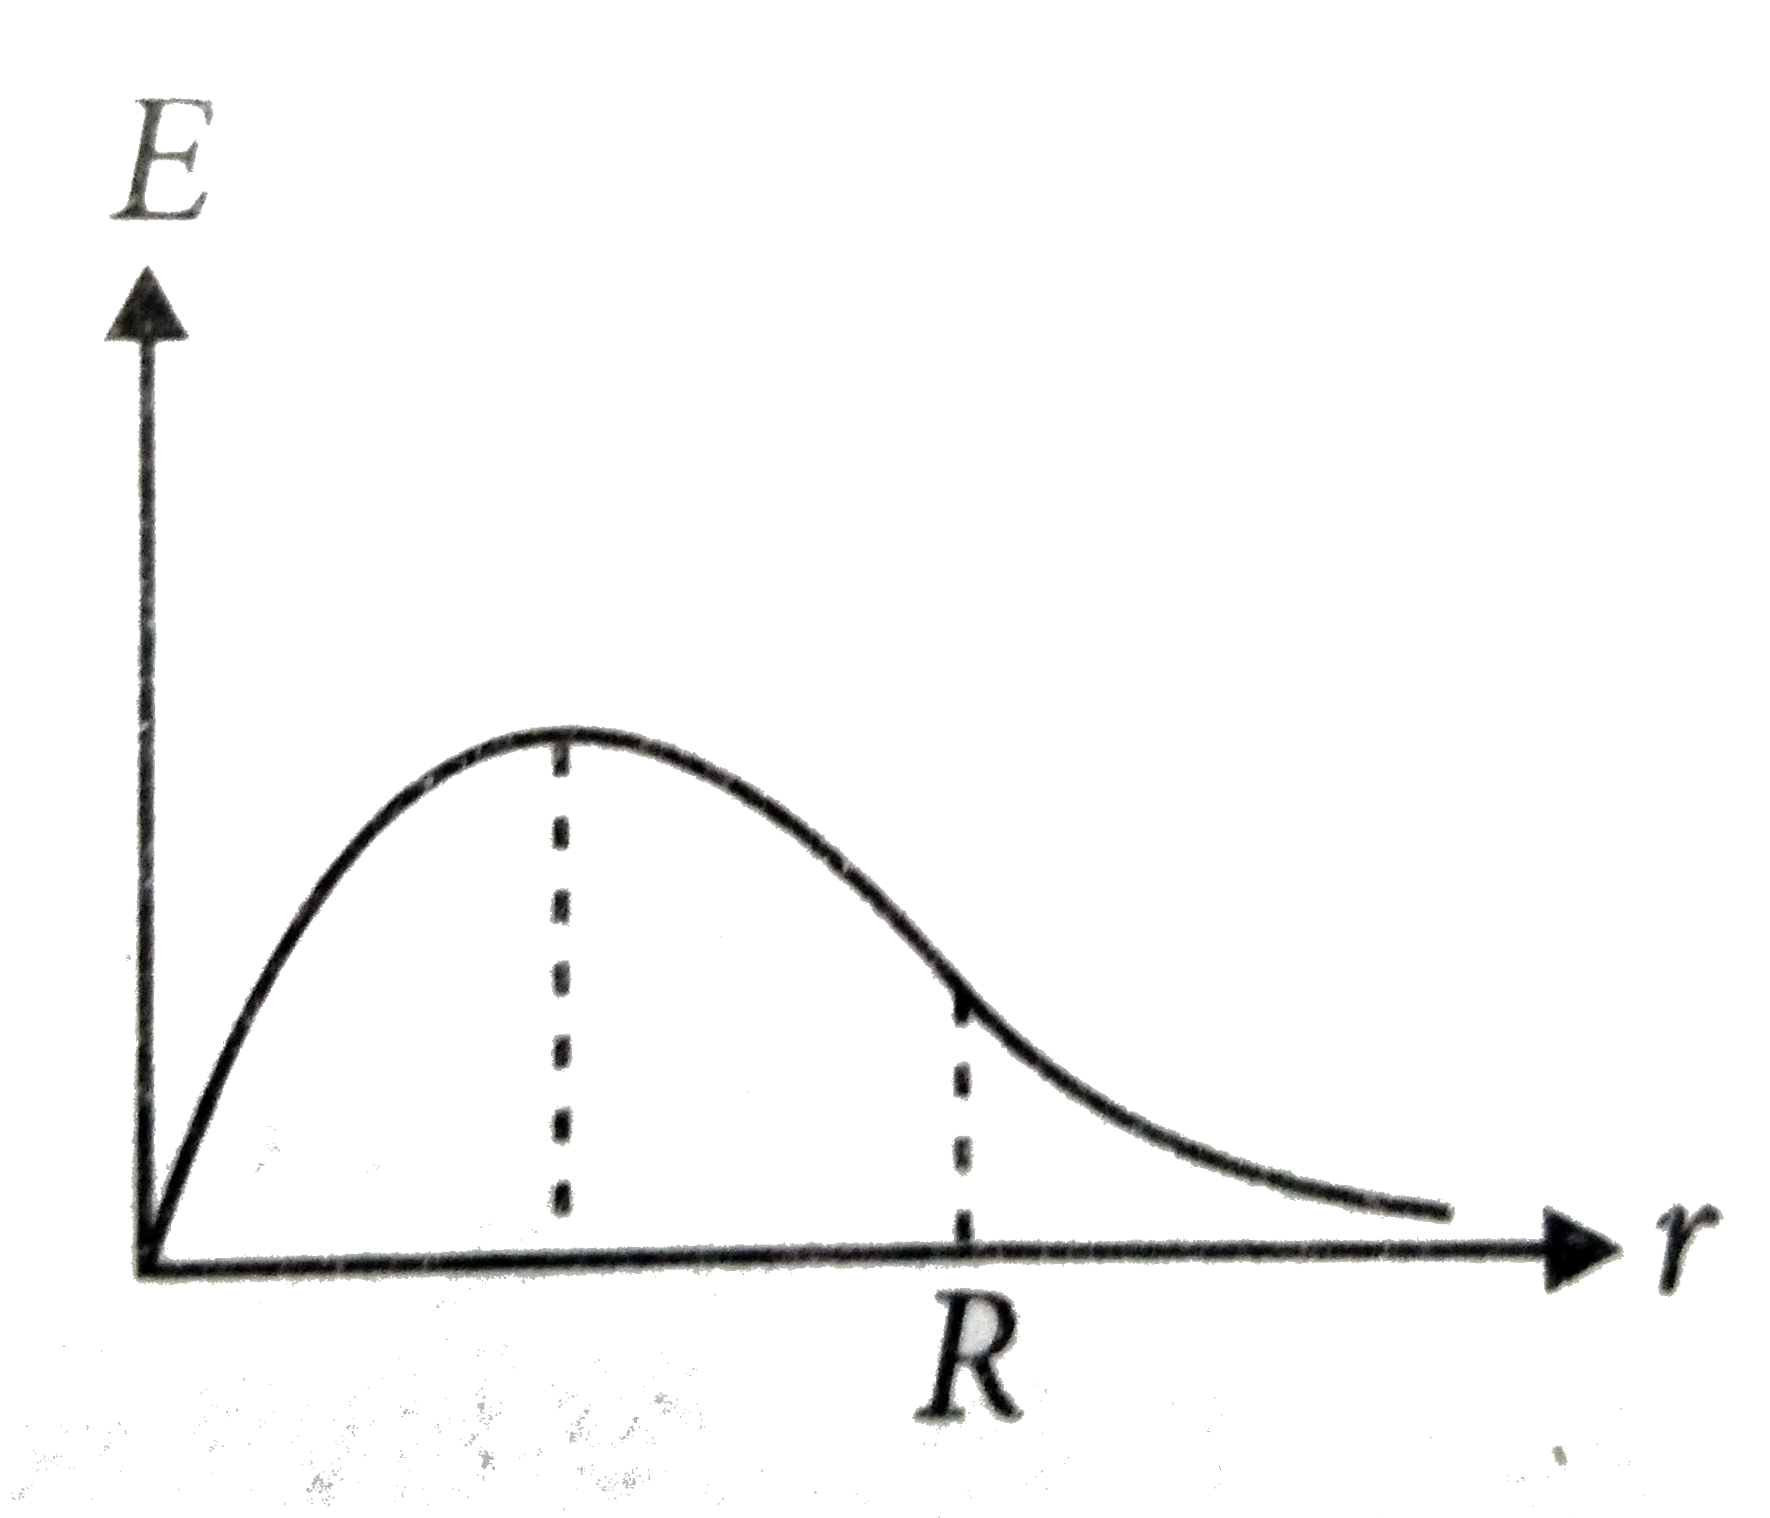 C
C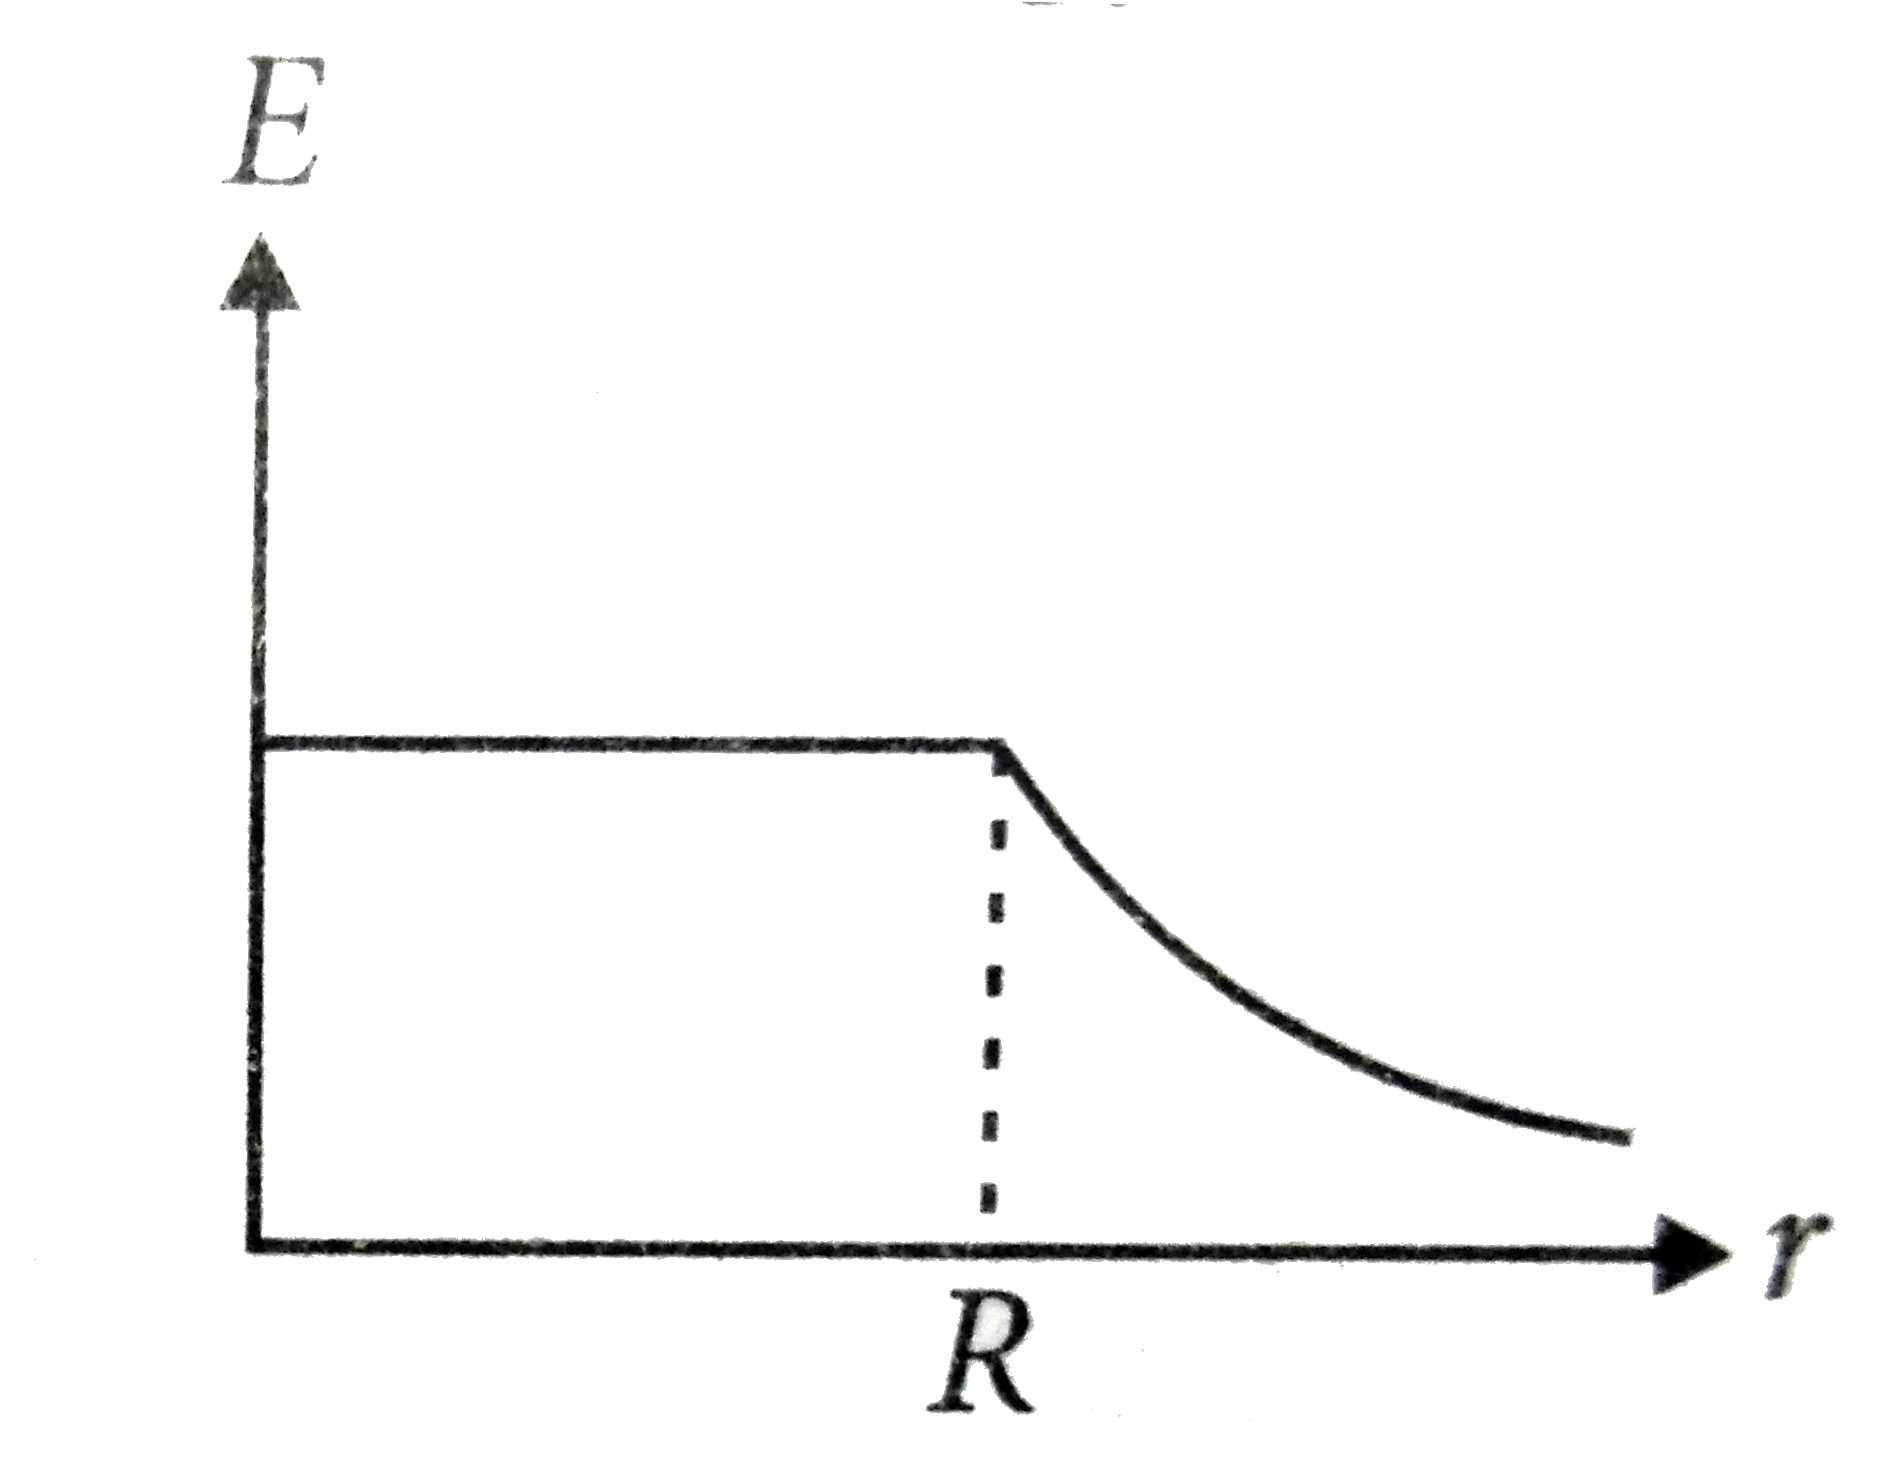 D
D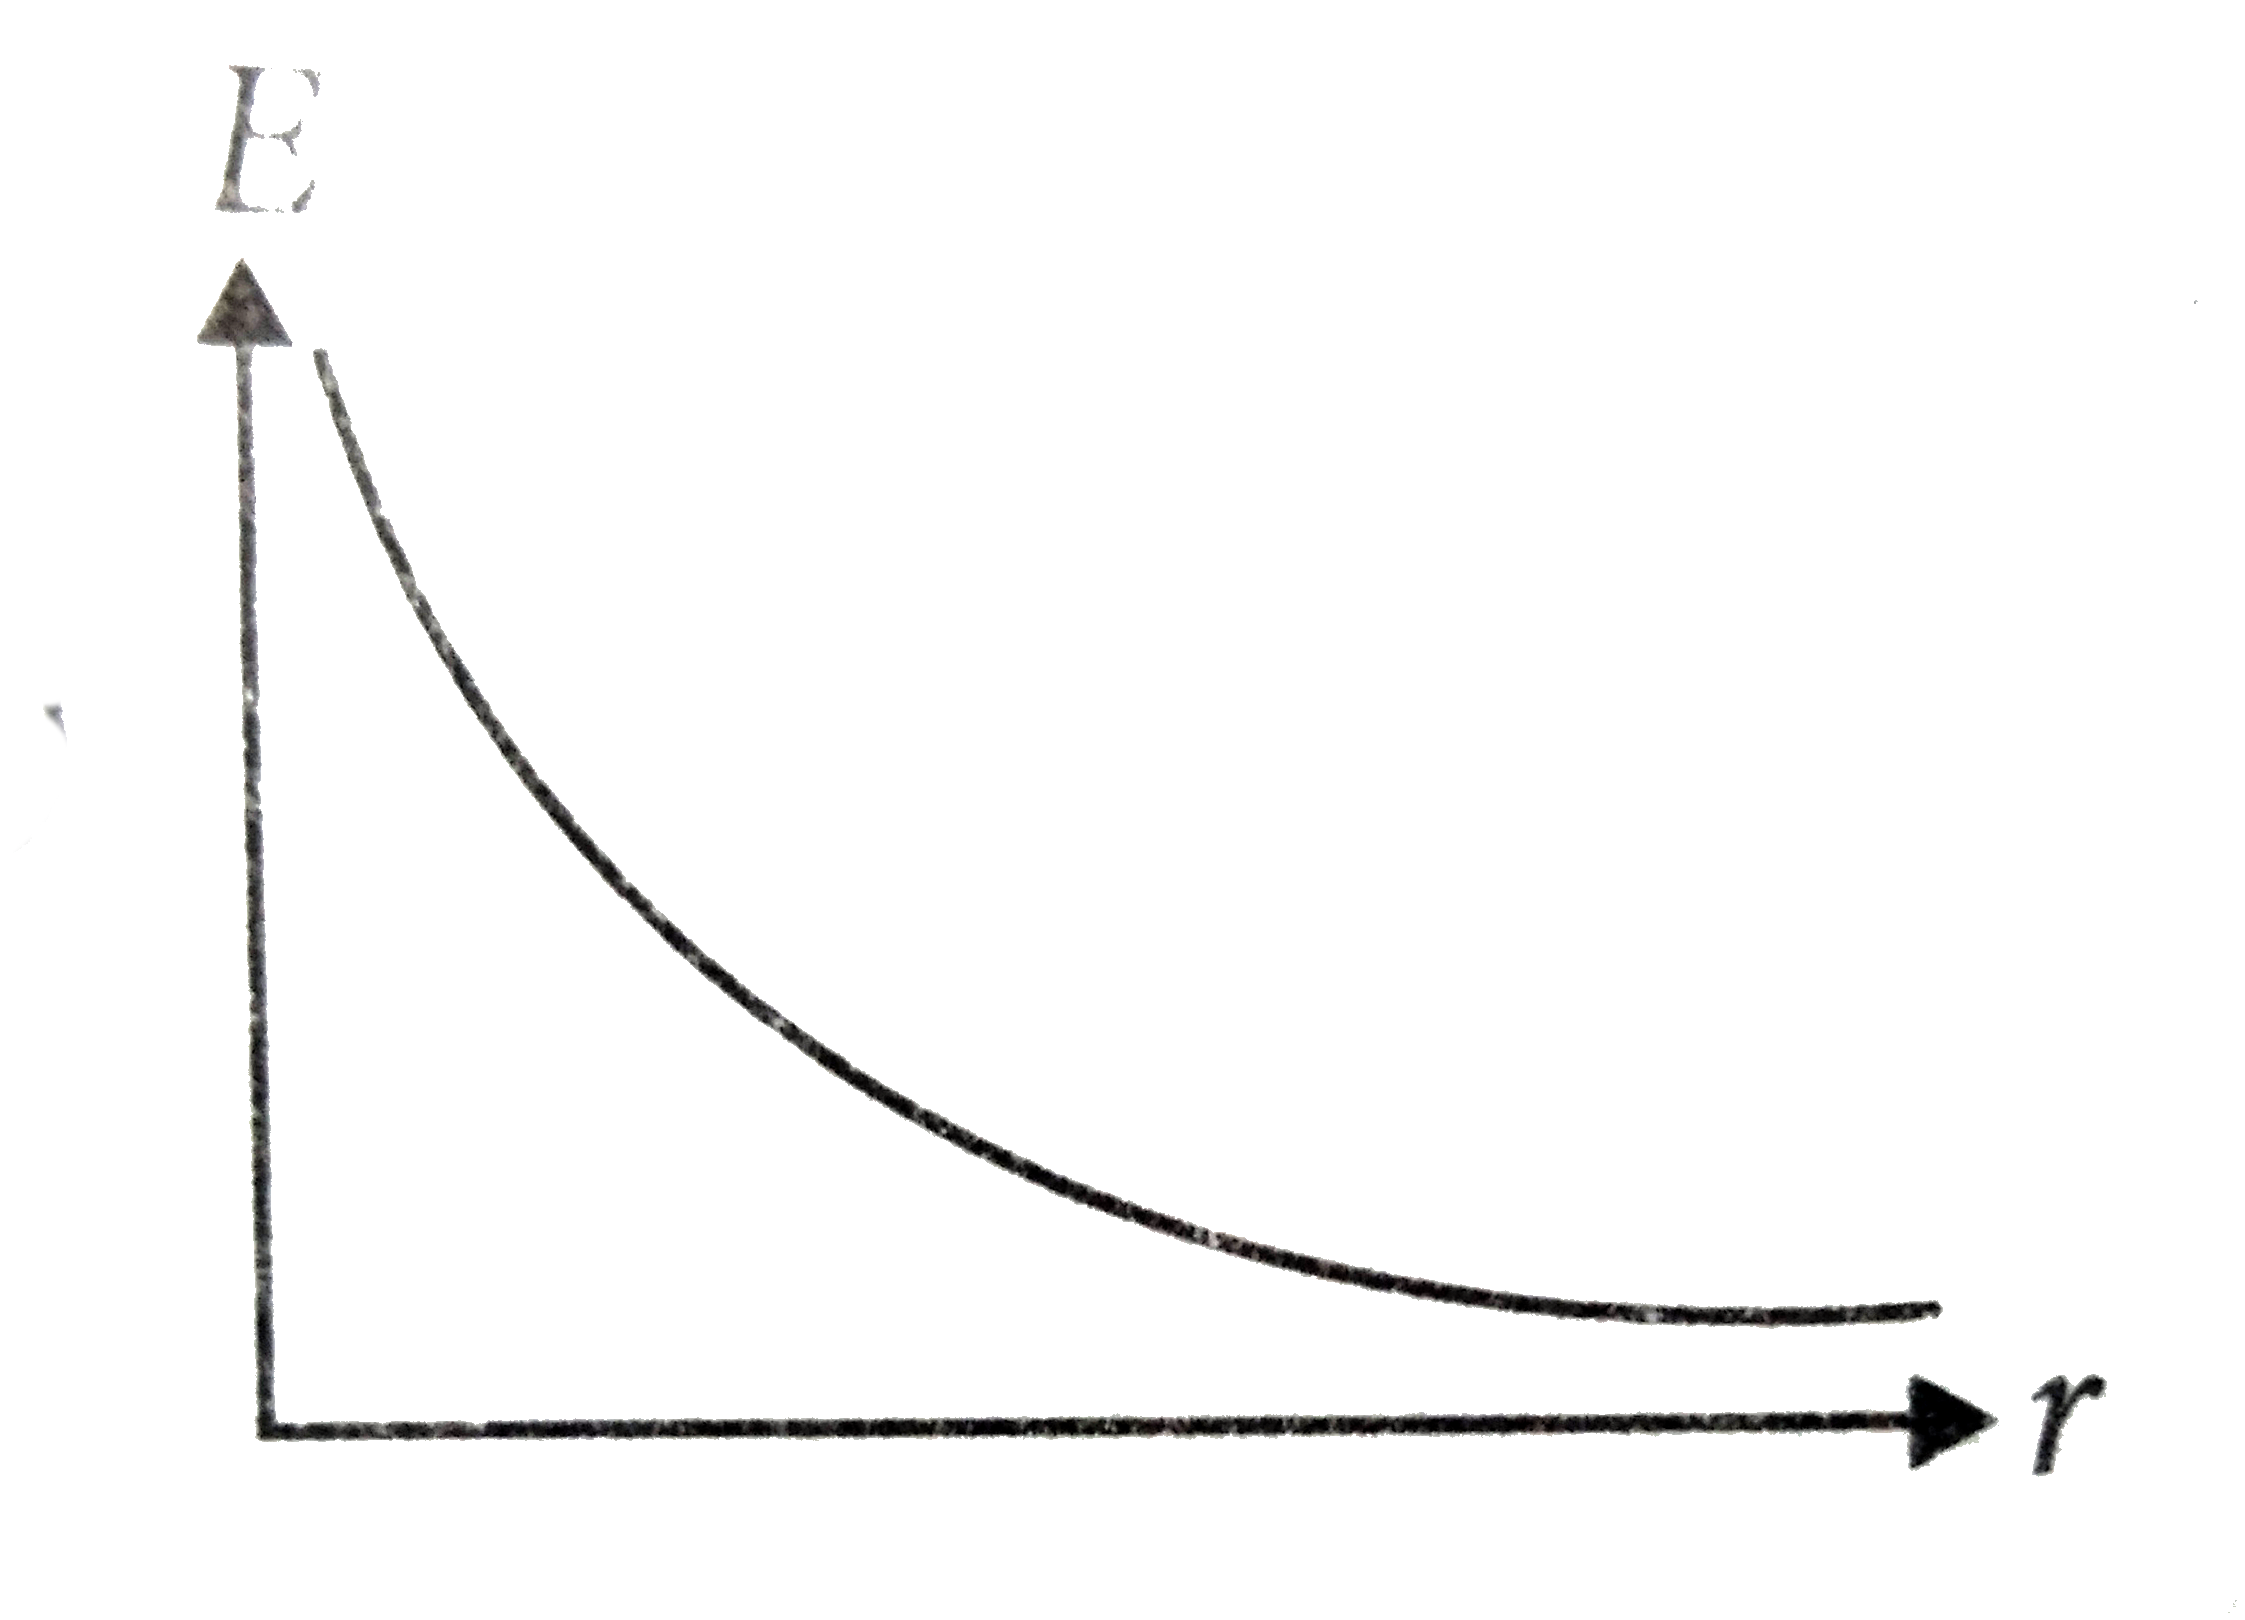
Figure shows two concentric spheres of radii R1 and R2(R2>R1) which contain uniformly distributed charges Q and -Q respectively. Find out electric field intensities at the following positions :
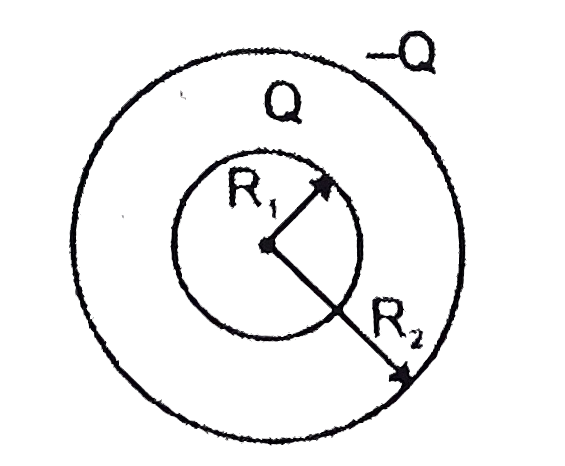
(i) r<R1 (ii) R1≤r≤R2 (iii) r≥R2
View SolutionAn isolated non-conducting solid sphere of radius R is given an electric charge. The charge is uniformly distributed in the volume of sphere. The graph which shows the correct variation of magnitude of electric field with distance from the centre of the sphere is
View SolutionA spherical insulator of radius R is charged uniformly with a charge Q throughout its volume and contains a point charge Q16 located at its centre. Which of the following graphs best represent quanlitatively, the variation of electric field intensity E with distance r from the centre.
View SolutionWhich one of the following graphs represents the variation of electric field with distance r from the centre of a charged spherical conductor of radius R?
View SolutionTwo concentric conducting shells of radius a and b (b>a) carry charges Q and −2Q respectively. The correct variation of electric intensity E as a function of r is given by
View Solution

