The
population of Delhi State in different census years is as given below:

Represent
the above information with the help of a bar graph.
Topper's Solved these Questions
Similar Questions
The following data on the number of girls (to the nearest ten) per thousand boys in different sections of Indian society is given below
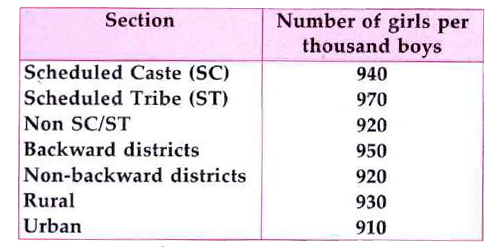
Represent the information above by a bar graph.
View SolutionThe number of hours spent by a school boy in different activities in a day is given below :

Represent the above information using a pie diagram.
View SolutionThe number of hours spent by a school boy in different activities in a day is given below:

Represent the above information using pie diagram.
View SolutionHome appliances sold by a shop in one month are given as below:
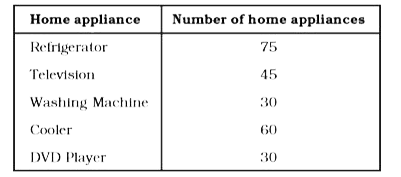
Draw a bar graph to represent the above information.
View SolutionThe number of ATMs of different banks in a city is shown below:
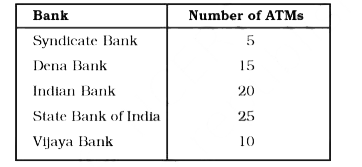
Draw a bar graph to represent the above information by choosing the scale of your choice.
View SolutionIn a school, there are five sections of Class VI. The number of students in each section is given below:

Represent the above data using a bar graph.
View SolutionExpenditure on education of a country during a five years period (2002-2006), in crore of rupees, is given below

Represent the information above by a bar graph.
View SolutionNumber of children in six different classes are given below.
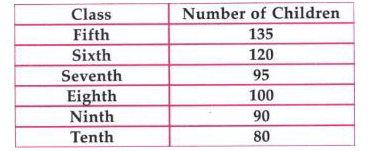
Which class have the second highest strength ?
View SolutionThe expenditure of a family of different heads in a month is given below

Draw a bar graph to represent the data above.
View SolutionThe number of Mathematics books sold by a shopkeeper on six consecutive days is shown below :
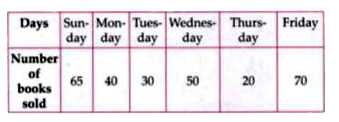
Draw a bar graph to represent the above information choosing the scale of your choice.
View Solution