Read the
following bar graph (Figure) and answer the following questions:
What is the
information given by the bar graph?
State each
of the following whether true or false.
The number
of government companies in 1957 is that of 1982 is 1:9.
The number
of government companies have decreased over the year 1957 to 1983
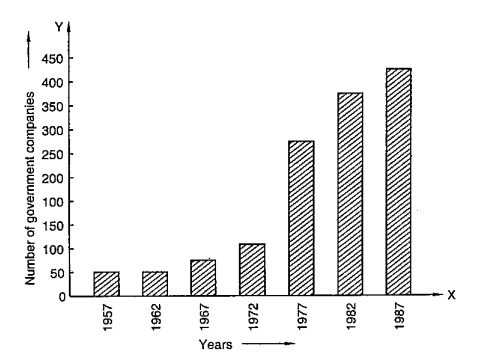
(i)The above bar graph gives information on the number of government companies for some years
(ii) Number of government companies in 1957 = 50
Number of government companies in 1982 = 375
Ratio =50375=215=2:15
∴ the statement is false
(iii) There is no data given for 1983 and the heights of the bars have increased over the years, Hence the statement is False.
Topper's Solved these Questions
Similar Questions
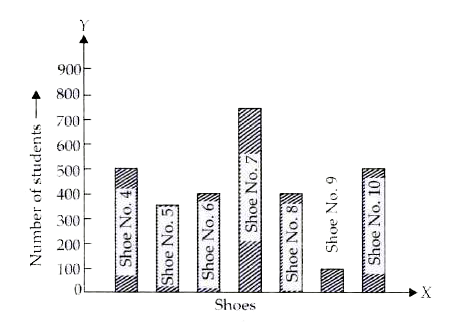
Read the bar graph shown in figure and answer the following questions.
What is the information given by the bar graph?
View SolutionRead the following bar graph given in figure and answer the following questions.
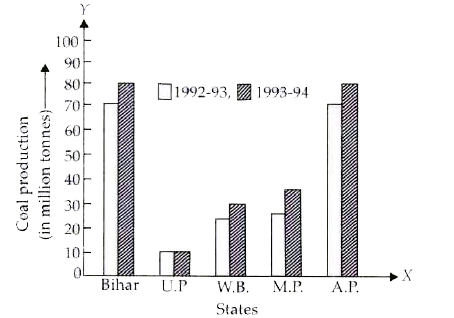
(i) What information is given by this bar graph?
View SolutionRead the bar graph given below and answer the following questions:
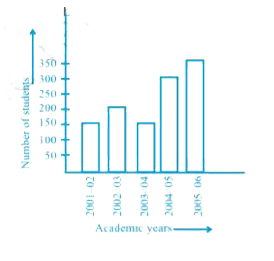
What information is given by the þar graph?
View SolutionRead the graph and answer the following questions
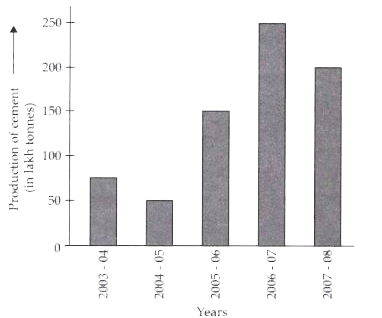
What information is conveyed by the bar graph
View SolutionRead the bar graph and answer the following questons.
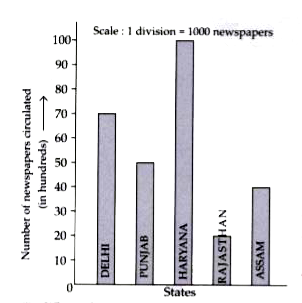
What information is given by graph ?
View SolutionRead the following bar graph given in figure and answer the following questions.
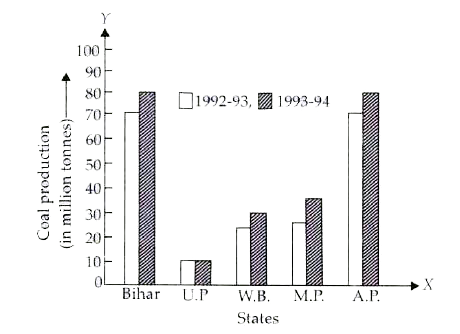
Which state has minimum production?
View SolutionRead the following bar graph given in figure and answer the following questions.
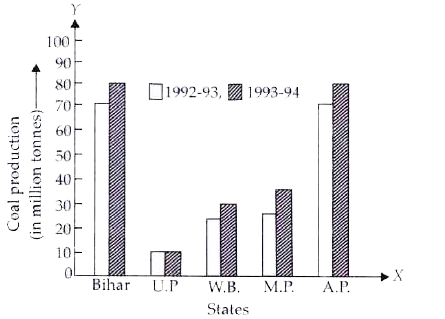
Name the state having same production in both the years?
View SolutionRead the following bar graph given in figure and answer the following questions.
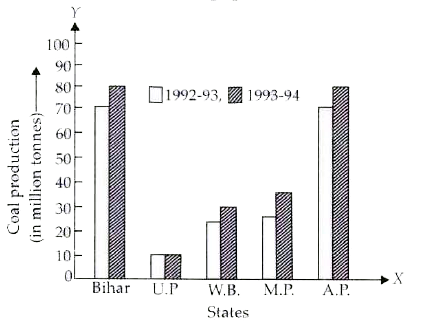
Which two states have same production in 1993-94?
View SolutionRead the bar graph shown in Figure and answer the following questions: What is the information given by the bar graph? What is the order of the change of number of students over several years? State whether true or false. The enrolment during 1996-97 is twice that of 1995-96
View SolutionRead the following bar graph (Figure) and answer the following questions: What information is given by the bar graph? What was the production of cement in the year 1980-81? What is the minimum and maximum productions of cement and corresponding years?
View Solution
