The
following bar graph shows the results of an annual examination in a secondary
school.
Read the
bar graph (Figure) and choose the correct alternative in each of the
following:
The pair of
classes in which the results of boys and girls are inversely proportional
are:
(a) VI,
VIII (b) VI, IX (c)
VIII, IX (d) VIII, X
The class
having the lowest failure rate of girls is
VII (b)
X (c) IX
(d) VIII
The class
having the lowest pass rate of students is
VI (b) VII
(c) VIII (d)
IX
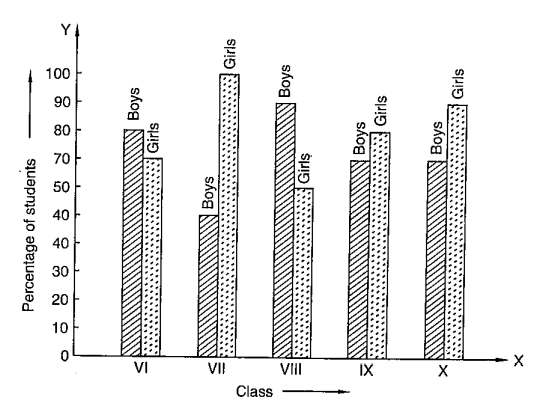
(i)The pair of classes in which the results of boys and girls are inversely proportional are VI and IX. So, (b) is the correct option.
(ii)Lowest failure rate of girls is same to the highest pass rate. Hence, the class having the lowest failure rate of girls is VII. So, the correct option is (a)
(iii)The sum of the heights of the bars for boys and girls in the class VII is minimum, which is 95 + 40 = 135. Hence, the class having the lowest pass rate is VII. Hence, the correct option is (b)
Topper's Solved these Questions
Similar Questions
The following bar graph shows the results of an annual examination in a secondary school. Read the bar graph (Figure) and choose the correct alternative in each of the following: The pair of classes in which the results of boys and girls are inversely proportional are: (a) VI, VIII (b) VI, IX (c) VIII, IX (d) VIII, X The class having the lowest pass rate of students is: VII (b) X (c) IX (d) VIII The class having the lowest pass rate of students is: VI (b) VII (c) VIII (d) IX
View SolutionThe following table shows the marks obtained by Sumit in the annual examination.

Draw a bar graph to show the above information.
View Solution
Knowledge Check
The following bar graph shows the number of students in a particular class of school. Then, answer the following questions.
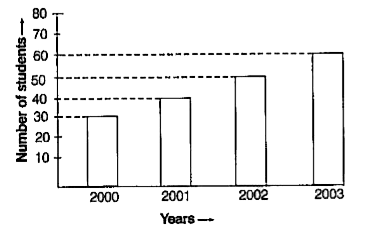
What is the number of students in the year 2003?A10B25C45D60The following bar graph shows the number of students in a particular class of school. Then, answer the following questions.
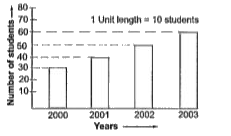
(i) What is the nuber of students in the year 2003 ?A70B60C50D40Study the following graph and answer the questions given below -----
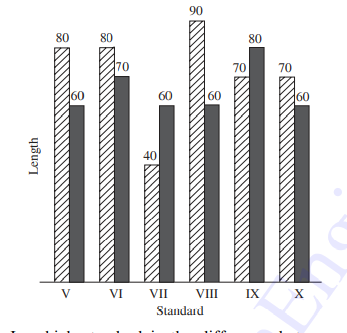
In which pair of standards are the results of girls and boys in inverse proportion ?AV and XBV and VICVI and VIIIDVI and IX
The following bar graph shows the number of students in a particular class of school. Then, answer the following questions.
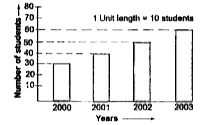
What is the number of students in the year 2003?
View SolutionThe following bar graph shows the number of students in different classes of a school.
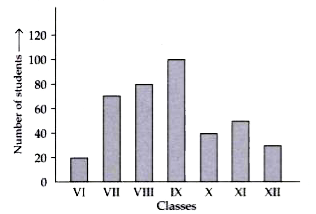
How many more students are there in Class IX than in Class VIII ?
View SolutionThe following data shows the number of students born in different months of a particular year of class VI. Make the bar graph based on the given information.

View SolutionIn the given bar graph what is the ratio of the total boys and girls in all schools
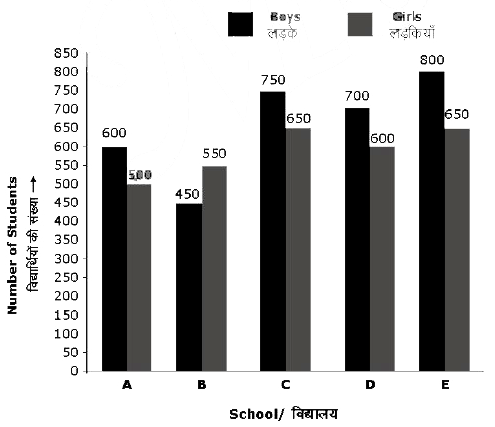
View SolutionThe following bar graph shows the number of students in a particular class of school. Then, answer the following questions.
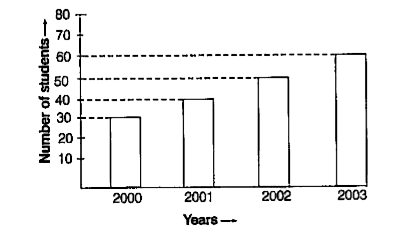
Is the number of students in the year 2002 is twice that in the year 2000?
View Solution
