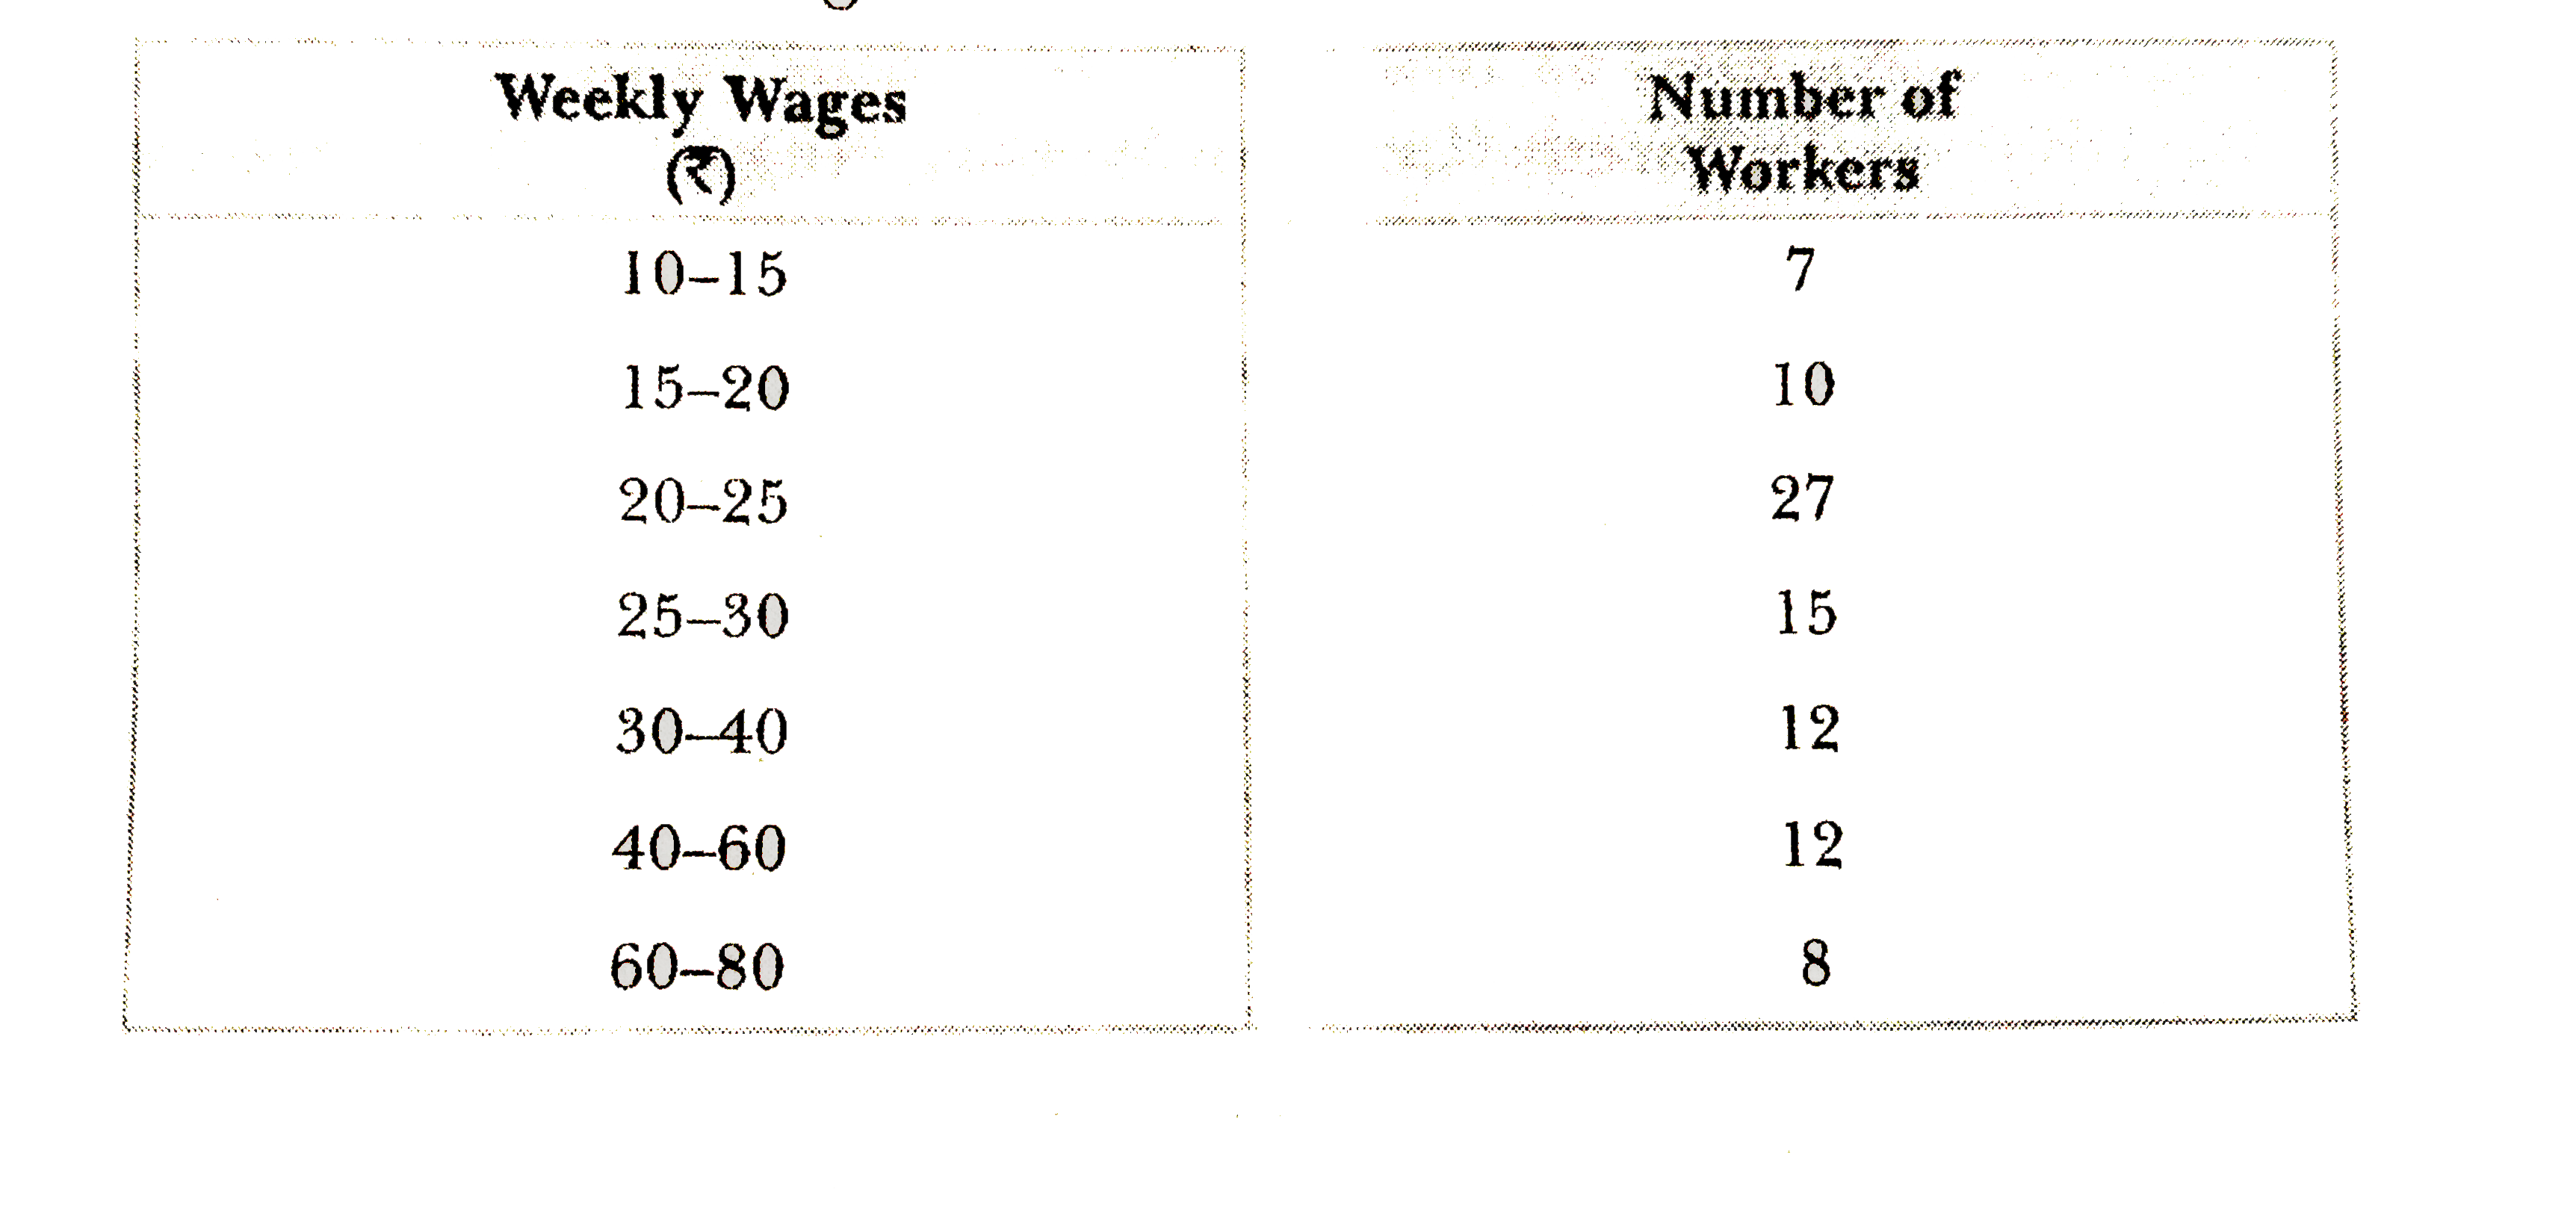
The
following table gives the marks scored by 100 students in an entrance
examination.

Represent
this data in the form of a histogram.
Topper's Solved these Questions
Similar Questions
Present the following data in the form of a histogram :

View SolutionPresent the following data in the form of a histogram :

View SolutionFollowing data gives the marks obtained by 100 students in a test. Find the median

View SolutionThe marks obtained by a student in an examination are given below:

Represent the data using pie diagram
View SolutionThe marks obtained by a student in an examination are given below:

Represent the data using pie diagram.
View SolutionThe marks obtained by a student in an examination are given below :

Represent the data using a pie diagram.
View SolutionThe following table gives the marks scored by 100 students in an entrance examination.

View SolutionThe following distribution table shows the marks scored by 140 students in an examination :

Calculate the mode of the distribution.
View SolutionRepresent the following data using a histogram.

View SolutionThe following table represent marks obtained by 100 students in a test.

Find mean marks of the students.
View Solution
