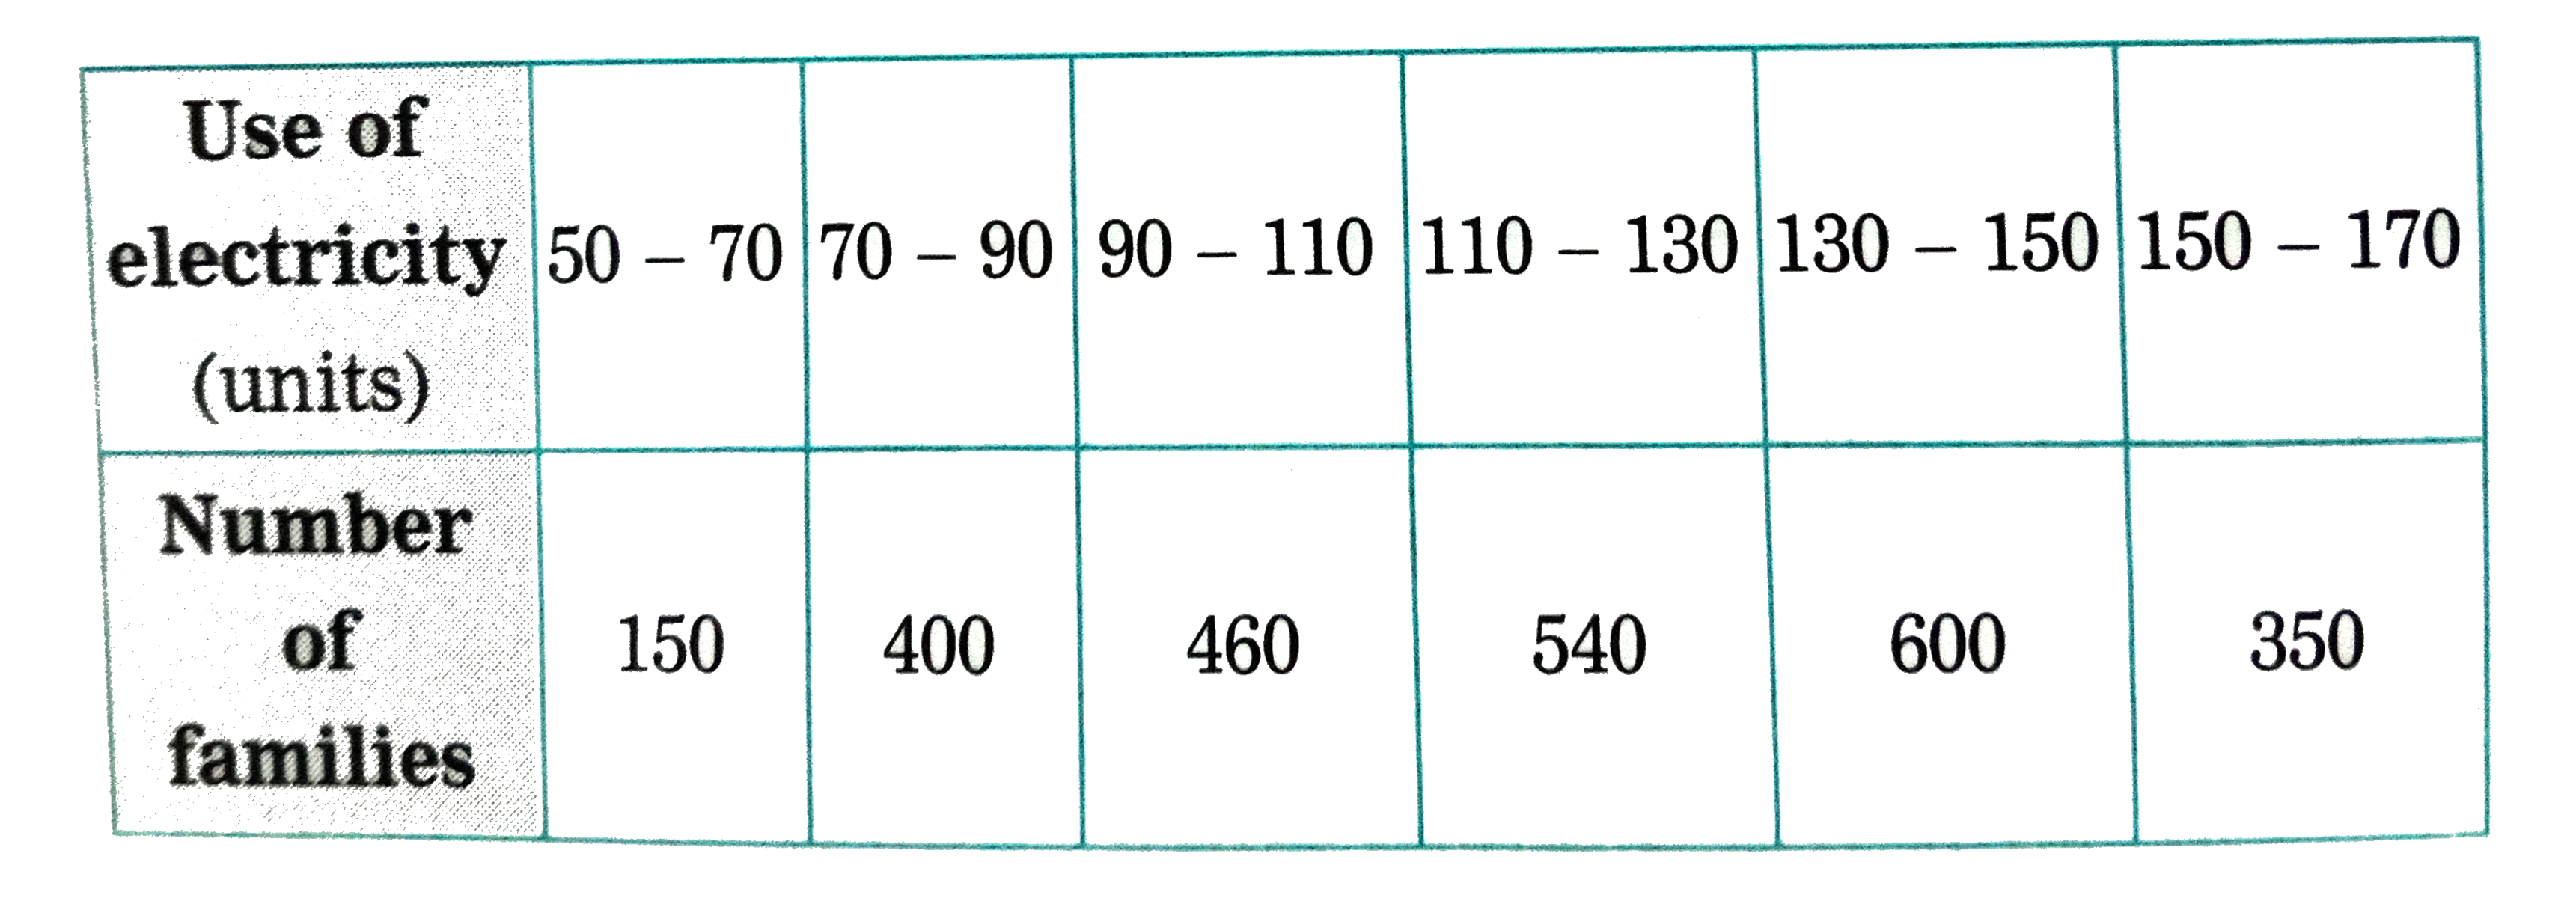
The monthly
profits (in Rs.) of 100 shops are distributed as follows:

Draw a
histogram for the data and show the frequency polygon for it.
Video Solution
Text Solution
|
Topper's Solved these Questions
Similar Questions
Draw a histogram for the following data.

View SolutionDraw a histogram for the following data:

View SolutionDraw a histogram of the following data

View SolutionDraw a histogram of the following data :

View SolutionDraw a histogram of the following data.

View SolutionDraw a histogram from the following data:

View SolutionDraw a histogram for the following frequency distribution.

View SolutionShow the following data by a frequency polygon.

View SolutionShow the following data by a frequency polygon.

View SolutionDraw the Histogram for the following frequency distribution.

View Solution

